Mathematics of Planet Earth - An interactive itinerant scientific exhibition - Centre sciences
←
→
Page content transcription
If your browser does not render page correctly, please read the page content below
1   AN INTERACTIVE ITINERANT SCIENTIFIC EXHIBITION

        Mathematics
        of Planet Earth

    An interactive itinerant
    scientific exhibition
IC MPE Exhibition brochure ARTWORK.indd 1                08/10/2015 15:18
2   MATHEMATICS OF PLANET EARTH

IC MPE Exhibition brochure ARTWORK.indd 2   08/10/2015 15:18
3   AN INTERACTIVE ITINERANT SCIENTIFIC EXHIBITION

    Introduction

    Our planet is a complex                              It is also a system at risk. The planet’s capacity   ‘Mathematics of Planet Earth’ is an
                                                         to support life as we know it is in danger.          international exhibition displaying exhibits,
    system with multiple facets                          The stability of the systems supported by            videos and computer programs. Collectively
    including the physical side                          Planet Earth is threatened by rapid changes          these illustrate how mathematics plays
                                                         in the balance between climate and the Earth         a role in answering essential questions
    (such as the atmosphere, the                         constituents: atmosphere, oceans, rivers, the        that concern our planet. In interactive
    oceans, the soil and the ice                         chemistry of earth components and many               graphics visualisations, videos and hands-
                                                         others. Human activity has grown to the point        on experiments you will discover the
    sheets), biological side (e.g.                       that it influences directly the global climate. It   contributions that mathematics makes to
    biodiversity, aquaculture,                           now has a strong impact on the capacity of the       topics such as astronomy, fluid dynamics,
                                                         planet to be self-sufficient and threatens the       seismology, glaciology and cartography.
    carbon cycle) and the human                          stability of the systems supported on it. The
                                                                                                              www.mathsofplanetearth.org
    side (e.g. urban climates,                           challenges that our planet and our civilisation
                                                         are currently facing cannot be addressed only
    power systems and social                             by separate scientific endeavours. Instead,
    media).                                              our efforts must be multidisciplinary, and
                                                         their common language is mathematics. The
                                                         mathematical sciences play a leading role in
                                                         the joint effort of researchers to understand
                                                         and quantify the challenges we face, and look
                                                         for solutions.

IC MPE Exhibition brochure ARTWORK.indd 3                                                                                                            08/10/2015 15:18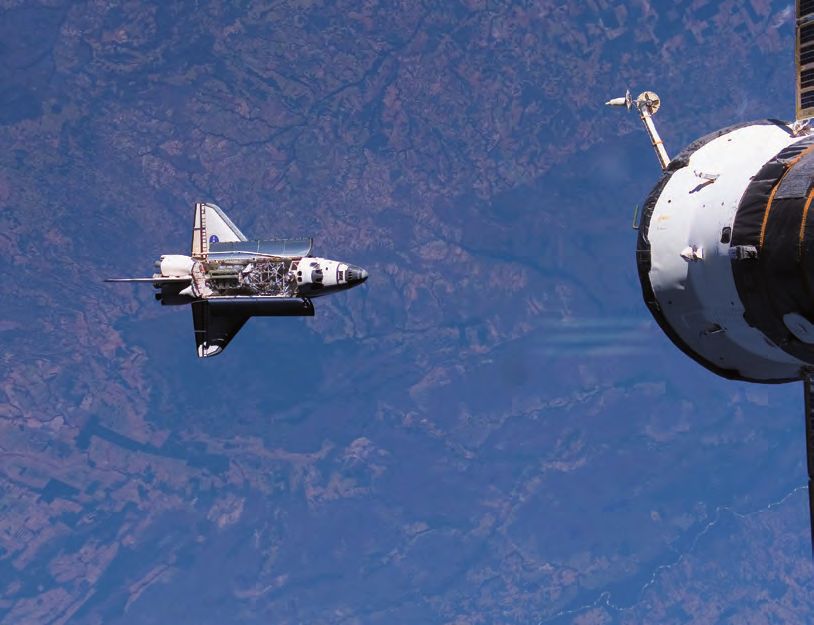
4   MATHEMATICS OF PLANET EARTH

    This exhibition is organised            The exhibit materials are provided by:        Realization of the digital modules and the
                                                                                          videos of the competition:
    by the EPSRC Centre for                 ©© IMAGINARY (project by the Mathematisches
                                               Forschungsinstitut Oberwolfach and         ©© Idea, Design, Program: participants of
    Doctoral Training (CDT) in the             supported by the Klaus Tschira Stiftung)      the competition MPE 2013 Jury chaired by
    Mathematics of Planet Earth             ©© Centre•Sciences (CCSTi Region Centre -
                                                                                             Ehrhard Behrends (Freie Universität Berlin)

    (MPE).                                     Val de Loire)                              The virtual modules are available on the MPE
                                                                                          Open Source Exhibition:
    www.mpecdt.org                          Design and realization of the interactive
                                            hands-on exhibits:                            www.imaginary.org/exhibition/mathematics-
                                                                                          of-planet-earth
                                            ©© Centre•Sciences (CCSTi of region Centre
                                               - Val de Loire – Orléans) and ADECUM
                                               Association for mathematic culture
                                               development), under the auspices of
                                               UNESCO and international mathematical
                                               sciences organizations

                                                                  Mathematisches
                                                                  Forschungsinstitut
                                                                  Oberwolfach

IC MPE Exhibition brochure ARTWORK.indd 4                                                                                       08/10/2015 15:18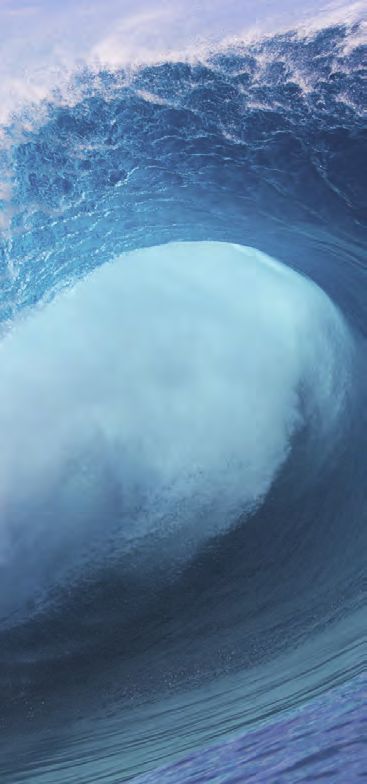
5   AN INTERACTIVE ITINERANT SCIENTIFIC EXHIBITION

    Table of contents

    Hands-on exhibits                                         Digital modules:                          Posters
    1. Maps of the Earth                                 7    1. Dune Ash                          34   1. The Lorenz Attractor             50
    2. Fractals: Models for Nature                       10   2. TsunaMath                         36   2. Stereographic Projection          51
    3. The Water from Rivers to Oceans                   13   3. The Future of Glaciers            38   3. Solitons                         52
    4. From the Core of Earth to Tectonic Plates 16           4. The Sphere of the Earth           39
    5. The Solar System                                  20
    6. The Space of Satellites and                       23
       Communication
                                                              Videos
    7. Chaotic Meteorology                               27
                                                              1. The Future of Glaciers            43
    8. Solitons and Tsunamis                             31
                                                              2. Probing the Invisible, from the   45
                                                                 Earthquake to the Model
                                                              3. Sundials                          47
                                                              4. Bottles and Oceanography          48

IC MPE Exhibition brochure ARTWORK.indd 5                                                                                             08/10/2015 15:18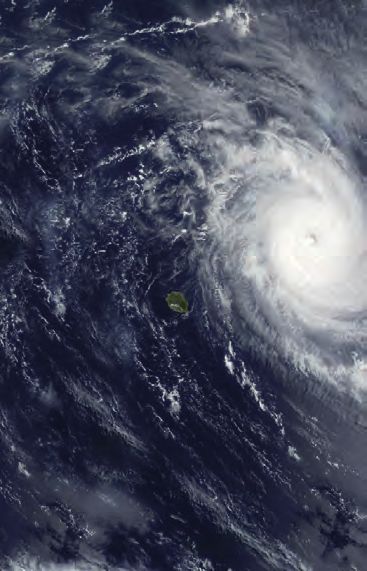
6   MATHEMATICS OF PLANET EARTH

    Hands-on exhibits
    1. Maps of the Earth
    2. Fractals: Models for Nature
    3. The Water from Rivers to Oceans
    4. From the Core of Earth to Tectonic Plates
    5. The Solar System
    6. The Space of Satellites and Communication
    7. Chaotic Meteorology
    8. Solitons and Tsunamis

IC MPE Exhibition brochure ARTWORK.indd 6          08/10/2015 15:18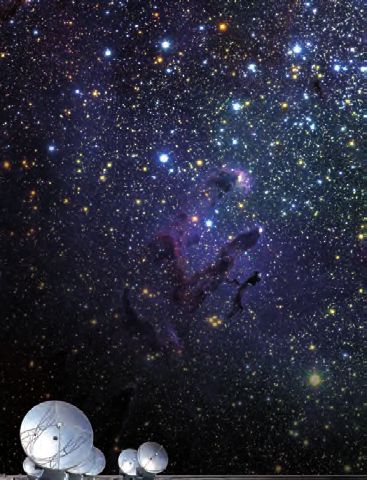
7 AN INTERACTIVE ITINERANT SCIENTIFIC EXHIBITION
Maps of
1. Maps of the Earth
the Earth
Cartographers have always needed to make choices
when drawing maps of the Earth: either preserve
angles for a better local orientation, or the ratios of
areas to compare the relative size of countries.
At small scale, distortions are minimal when using
a well-chosen projection but they become very
important when drawing maps of large regions.
The future: 3D cartography
For small regions one technique consists in taking
numerous photos from airplanes or satellites. When
comparing different photos from the same place,
an algorithm computes the altitude of each point to
create a 3D model of the region. The software can
then create any image corresponding to a particular
1-1 Maps of the Earth
viewpoint. This is the underlying principle behind
applications like Google Earth or Géoportail.
Cartes de la Terre
Les cartographes ont toujours dû faire un choix pour
représenter la Terre : conserver les angles pour s’orienter,
Cartographers have always At small scale, distortions are minimal when
les distances locales pour mesurer ou les surfaces pour
comparer la taille relative des pays.
Al-Idrîsî’s world map (12th C.), Egypt NL
© A.du Boitesselin À petite échelle, les distorsions sont minimes si on choisit
bien la projection. Mais elles deviennent très importantes
using a well-chosen projection but they
lorsqu’on cartographie de grandes régions.
needed to make choices when become very important when drawing maps of
L‘avenir : la cartographie 3D
Pour de petites régions, une des techniques consiste
à prendre de très nombreuses photos aériennes ou
satellitaires. En comparant des photos d’un même
drawing maps of the Earth:
endroit, un algorithme évalue la hauteur de chaque point
large regions.
pour créer un modèle 3D de la région à cartographier. Le
logiciel peut ensuite recréer sur commande les différentes
représentations en perspective selon le point de vue de
l’observateur. C’est ce principe qu’utilisent les applications
comme Google Earth ou Géoportail.
either preserve angles for a The future: 3D cartography
For small regions one technique consists in
better local orientation, or the taking numerous photos from airplanes or
ratios of areas to compare the satellites. When comparing different photos Portulans: first navigation maps (16th C.), Egypt NL
© Y.Vernet
from the same place, an algorithm computes
relative size of countries. the altitude of each point to create a 3D model
of the region. The software can then create Corsica Island in 3D
any image corresponding to a particular
© Nasa-EOS
viewpoint. This is the underlying principle
behind applications like Google Earth or
Géoportail.
1-1 Earth at night - Dec 2012
© Nasa-Earth Observatory System
IC MPE Exhibition brochure ARTWORK.indd 7 08/10/2015 15:18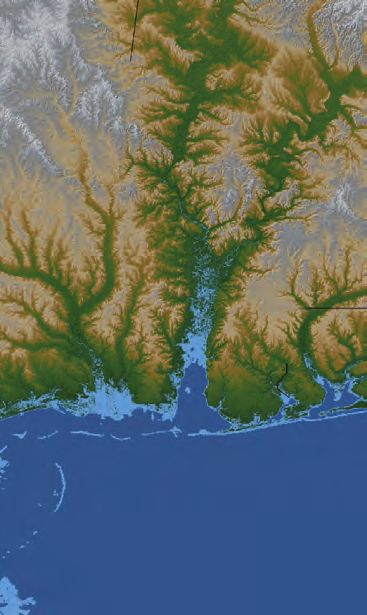
8 MATHEMATICS OF PLANET EARTH
All maps
are wrong!
C.F. Gauss (1777-1855) has shown that it is impossible
to preserve all ratios of distances when drawing a
planar map of a region of the Earth
But do we need
to sacrifice everything?
When drawing a map, one represents each point of Lambert projection & cover plant of the Earth
© Envisat-ESA 2005
the spherical Earth by a point on a plane, a cone or
on a cylinder, which we then unroll. This process is
called a projection.
When angles are conserved, the projection is called
“conformal”. This is the case for the Mercator
projection. This projection allows navigators to follow
a straight line on a conformal map using a compass.
1-2 All maps are wrong!
Azimuthal & cylindrical projections
In the Peters Atlas, each point is projected horizontally © SR-Orléans
on the cylinder. This process is called Lambert
projection. It preserves ratios of areas and respects
the relative size of each country. The projection is
called “equivalent”.
Toutes les cartes
C.F. Gauss (1777-1855) has The trouble with maps sont fausses !
C.F. Gauss (1777-1855) a démontré qu’il est impossible
When drawing a map, one represents each
de préserver tous les rapports de distances lorsqu’on
cartographie la surface terrestre sur une surface plane.
shown that it is impossible to point of the spherical Earth by a point on a
Mais est-on obligé
de tout sacrifier ?
Dessiner une carte, c’est représenter chacun des points du
preserve all ratios of distances
globe par un point sur un plan, ou encore sur un cône ou un
plane, a cone or on a cylinder, which we then
cylindre que l’on peut ensuite mettre à plat : le processus
s’appelle une projection.
Lorsque les angles sont conservés, la projection est dite
“conforme”. C’est le cas de la projection de Mercator. Elle
unroll. This process is called a projection. permettait aux navigateurs de suivre une ligne droite sur une
when drawing a planar map of
carte grâce à un compas de navigation.
Dans l’atlas de Peters, on projette chaque point horizon-
talement sur le cylindre. Ce procédé, appelé projection de
Lambert, conserve les rapports d’aire et respecte la taille
des pays des deux hémisphères : la projection est dite
When angles are conserved, the projection
“équivalente”.
a region of the Earth. is called “conformal”. This is the case for the
Mercator projection. This projection allows
navigators to follow a straight line on a
conformal map using a compass.
Pseudo-Mercator projection
© IGN–Paris 2004
In the Peters Atlas, each point is projected
horizontally on the cylinder. This process is
called Lambert projection. It preserves ratios
of areas and respects the relative size of each
country. The projection is called “equivalent”.
1-2 Terrestrial planisphere by P. Du Val (1676) © Gallica.BNF.fr
IC MPE Exhibition brochure ARTWORK.indd 8 08/10/2015 15:18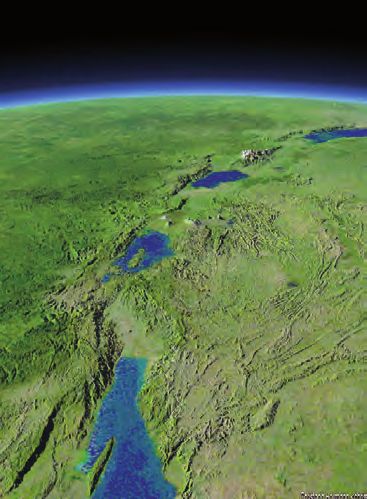
9 AN INTERACTIVE ITINERANT SCIENTIFIC EXHIBITION
References: Activities: Source:
An interactive module on the science of 1. Paris – Vancouver –Tokyo Centre•Sciences
cartography and geometry of the sphere Using the string, find the shortest path joining
two of these cities on the globe, and then on
©© imaginary.org/program/the-sphere-of-the-
the flat map.
earth (can be downloaded for free)
What should you find?
©© imaginary.org/hands-on/all-maps-are-
On a spherical surface, the shortest path
wrong
between two points is the small arc of the
©© www.ngi.be/FR/FR2-1-4.shtm great circle centred at the centre of the sphere
and passing through the two points. Had you
©© accromath.uqam.ca/accro/wp-content/
already realized that the shortest path from
uploads/2013/08/Cartographie.pdf
Paris to Vancouver was passing close to the
©© Maps That Prove You Don’t Really Know North Pole? Not obvious when we look at
Earthwww.youtube.com/watch?v=KUF_ the map…
Ckv8HbE#t=110
Why are all maps distorted?
If we cut a cylinder or a cone we can flatten it
on a plane. This is not possible with a sphere.
Indeed, the curvature of the cylinder and
of the cone is zero, while that of the sphere
is positive. We cannot flatten a surface of
positive curvature without multiple tears.
IC MPE Exhibition brochure ARTWORK.indd 9 08/10/2015 15:18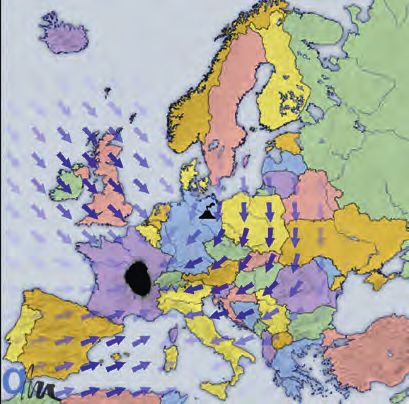
10 MATHEMATICS OF PLANET EARTH
Fractals:
models for
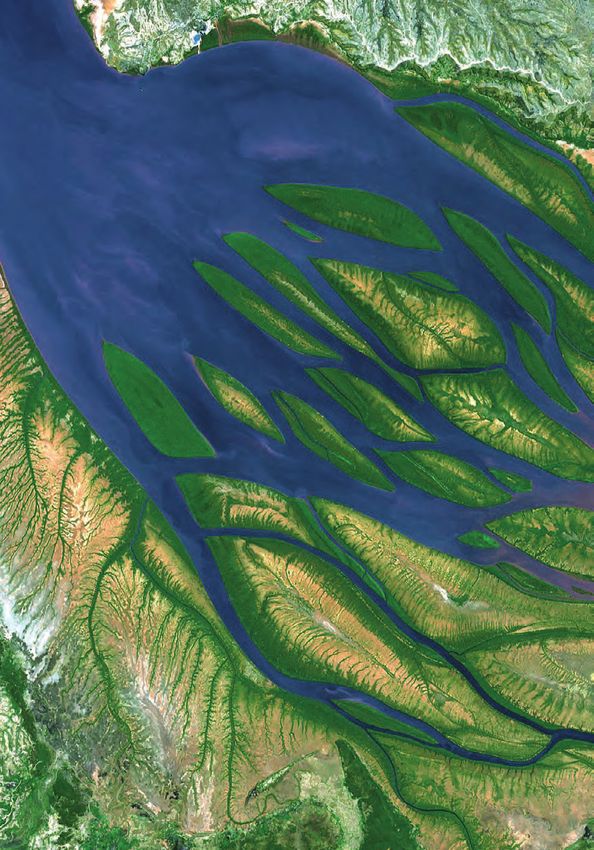
2. Fractals: Models for Nature nature
Fractal geometry, introduced by Benoit Mandelbrot
(1924-2010), provides a large class of geometric objects
that can be used to model the very rugged shapes of
nature, including a variety of complex shapes on the
Earth: mountains, rocky coasts, networks of brooks
and rivers and streams, river deltas, etc. Above our
head, the clouds and galaxies also have fractal
shapes.
Why are so many
shapes fractal?
Certain fractals shapes are created when an position
of equilibrium loses its stability. This is the case with
2-1 Fractals: models for nature
water flowing on sand at low tide: a small rivulet
starts appearing where there is a small irregularity.
The water is attracted to the small depression and the
flowing water amplifies the phenomenon. On a much
larger scale, the same phenomenon occurs when the
rivers of a catchment basin erode are eroding the
landscape. Similarly, water flowing along mountain
slopes creates gullies.
Fractal geometry, introduced Why are so many shapes fractal? Les fractales :
modèles de la nature
Certain fractal shapes are created when a
by Benoit Mandelbrot (1924-
La géométrie fractale, introduite par Benoit Mandelbrot
(1924-2010), fournit une banque d’objets géométriques qui Lick Galaxy
servent de modèles aux formes de la nature très accidentées, © P.J.E.Peebles-Princeton Univ.
position of equilibrium loses its stability.
incluant les formes terrestres : montagnes, côtes rocheuses,
réseaux de ruisseaux et rivières, deltas de fleuves...
Lorsqu’on regarde vers le ciel, les nuages, les galaxies ont
aussi des formes fractales.
2010), provides a large class of This is the case with water flowing on sand Des reliefs aux formes fractales
Certaines formes fractales se créent lorsqu’une position
at low tide: a small rivulet starts appearing
d’équilibre perd sa stabilité. C’est le cas de l’eau des
rigoles qui ruisselle sur le sable à marée basse : les rigoles
geometric objects that can be
commencent à se creuser là où il y a un petit défaut. La
dépression attire l’eau de ruissellement, amplifiant le
phénomène. Sur une beaucoup plus longue échelle de
where there is a small irregularity. The water
temps, le même phénomène se produit lorsque les rivières
d’un bassin versant creusent leur lit. Les ravines des pentes
montagneuses obéissent à la même règle.
used to model the very rugged is attracted to the small depression and the
flowing water amplifies the phenomenon.
shapes of nature, including a On a much larger scale, the same
variety of complex shapes on phenomenon occurs when the rivers of
a catchment basin erode the landscape.
the Earth: mountains, rocky Similarly, water flowing along mountain slopes Hadrapaout region in Yemen (Spot 5)
© CNES 2006/Astrium Services
coasts, networks of brooks creates gullies.
and rivers and streams, river
deltas, etc. Above our head,
the clouds and galaxies also Cauliflower (Romanesco)
© CS-Orléans
have fractal shapes.
2-1 Bombetoka Bay – Madagascar © Nasa-EOS 2005
IC MPE Exhibition brochure ARTWORK.indd 10 08/10/2015 15:1811 AN INTERACTIVE ITINERANT SCIENTIFIC EXHIBITION
Erosion and
fractal coasts
In the ‘60s, it was observed that the geometry of rocky
coasts is also fractal: this means that, when zooming
on a photo, whatever the zoom, we see new details
appearing that have the same character as the large
scale details.
Why is this geometry fractal?
The sea first destroys the most fragile rocks. When it
starts forming a small cove, the sea comes in violently
and enlarges it. But then, the length of the coast
increases, and the strength of the waves is spread
along a longer coast. Hence it is commonly admitted
that erosion is weaker along fractal coasts.
Geographers have modelled the evolution of the
coastal morphology when erosion destroys the
2-2 Erosion and fractal coasts
softer rocks, and hence increases the irregularities.
In their model, the strength of the waves is inversely
proportional to the length of the coast.
The process stabilizes with the final coast having a
fractal dimension exactly equal to 4/3 = 1.333.
Erosion
et côtes fractales
In the ‘60s, it was observed Why is this geometry fractal? Von Koch snowflack
© S.Roux-Orléans
Dans les années 1960, on a remarqué que la géométrie
des côtes rocheuses était fractale, ce qui signifie que, si
The sea first destroys the most fragile rocks.
l’on zoome sur la photo d’une telle côte, on voit apparaître
à petite échelle de nouveaux détails du même type que les
that the geometry of rocky
détails vus à grande échelle.
Pourquoi est-ce
When it starts forming a small cove, the sea une géométrie fractale ?
coasts is also fractal: this
La mer détruit d’abord les rochers les plus fragiles. Aussi,
comes in violently and enlarges it. But then,
quand une anse commence à se former, la mer s’y engouffre
pour l’agrandir. Mais alors, la force de la houle se répartit sur
une plus grande longueur de côte. D’où l’idée que l’érosion
est moindre sur les côtes fractales.
Les géographes ont ainsi modélisé l’évolution de la
the length of the coast increases, and the morphologie côtière soumise à une érosion qui détruit les
means that, when zooming on
rochers les plus fragiles et, en conséquence, rend la côte
plus irrégulière. Dans ce modèle, la force des vagues est
inversement proportionnelle à la longueur de la côte.
strength of the waves is spread along a longer
Ce processus se stabilise et conduit à l’apparition spontanée
d’une côte finale de dimension - appelée fractale -
exactement égale à 4/3 = 1,333.
a photo, whatever the zoom, coast. Hence it is commonly admitted that
erosion is weaker along fractal coasts.
we see new details appearing
Geographers have modelled the evolution
that have the same character of the coastal morphology when erosion
as the large scale details. destroys the softer rocks, and hence increases Low coastal elevations in the Gulf Coast (USA)
© Nasa’s Shuttle Radar Topography Mission
Seaside erosion sand
© Killerlimpet (NC-USA)
the irregularities. In their model, the strength
of the waves is inversely proportional to the
length of the coast.
The process stabilizes with the final coast
having a fractal dimension exactly equal to
4/3 = 1.333.
2-2 Everglades coasts (Florida) © Nasa-EOS
IC MPE Exhibition brochure ARTWORK.indd 11 08/10/2015 15:1812 MATHEMATICS OF PLANET EARTH
References: Activities: Source:
©© accromath.uqam.ca/contents/pdf/ 2. Fractals, from large scale to small scale! Jean Brette (Paris) and S[cube]-CCSTi Île-de-
fractales.pdf (Josiane Lajoie - UQTR - With each of the chains, measure the length France
Automne 2oo6) of the more uneven coast, at the north of the
island. In your opinion, why are the lengths so
©© geoffreyhistoire.pagesperso-orange.fr/
different?
fractales/géographie.html
What should you find?
©© imaginary.org/hands-on/erosion-and-
The north coast, more uneven, is an example
fractal-coasts
of fractal object: each small portion of the
coast, after appropriate zooming resembles
the entire coast.
The south coast is smoother than the north
coast. The measured lengths vary very little.
Some coasts with infinite length!
If you were to measure a real coast with
chains whose links got smaller and smaller,
you would be able to take into account much
smaller details, and the length of the coast
would tend to infinity. Coasts like this can be
found in Corsica, Iceland, Sardinia, etc.
IC MPE Exhibition brochure ARTWORK.indd 12 08/10/2015 15:1813 AN INTERACTIVE ITINERANT SCIENTIFIC EXHIBITION
The melting
of glaciers
3. The Water, from Rivers to Ocean Climate warming induces a thermal expansion of the
oceans and the melting of glaciers.
Simulation software such as ”Flood map”, based on
elevation data coming from satellite radars allows us
to compute the potential consequences of sea-level
rising on coastal regions and populations, including
large cities like Rio de Janeiro, New York, Tokyo,
Shanghai, etc.
How high can sea-level rise?
In the South Pole, the volume of the Antarctica glaciers
is at least 22 million km3. In the North, the volume of
Greenland glaciers is approximately 2,8 million km3.
The total area of the Earth’s oceans is 335 million km2.
If all the glaciers were to melt instantaneously, this
3-1 The melting of glaciers
could lead to a uniform rise of the sea-level rise of 75
New iceberg in Antartica meters!
© Envisat-ESA 2005
Taking into account the limits of such models, the
scientists are presently less pessimistic and forecast
a sea-level rise somewhere between 20 cm and 60 cm
before 2100, including seawater expansion.
La fonte des glaciers
Climate warming induces Simulation software such as ”Flood map”, Le réchauffement climatique provoque la dilatation thermique
des océans et la fonte des glaciers.
based on elevation data coming from satellite
Des simulateurs comme ”Flood map”, basés sur les
données altimétriques des radars satellitaires, montrent les
a thermal expansion of the
conséquences possibles de l’élévation des surfaces des
océans sur les littoraux, les populations et les grandes villes
comme Rio de Janeiro, New York, Tokyo, Shanghai...
radars allows us to compute the potential De combien s’élèverait
la surface des océans ?
oceans and the melting of
© R.A.Rohde-Berkeley Univ.
consequences of sea-level rising on coastal Au pôle sud, le volume des glaciers de l’Antarctique est au
minimum de 22 millions de km3. Au nord, celui des glaciers du
Groenland est de 2,8 millions de km3.
regions and populations, including large
La surface totale des océans est de 335 millions de km2.
Si l’on répartissait uniformément l’eau de ces glaciers sur
glaciers.
tous les océans, la hauteur des mers augmenterait de 75
mètres !
Tenant compte des limites des modèles, les prévisions
cities like Rio de Janeiro, New York, Tokyo, scientifiques sont – actuellement - moins pessimistes,
ramenant cette élévation entre 20 et 60 cm d’ici 2100,
dilatation de l’eau comprise.
Shanghai, etc.
How high can sea-level rise?
In the South Pole, the volume of the Antarctica
glaciers is at least 22 million km3. In the
North, the volume of Greenland glaciers is Elephant-Foot Glacier, Greenland
© R.Roberts-California
approximately 2,8 million km3. The total area
of the Earth’s oceans is 335 million km2. If all
the glaciers were to melt instantaneously, this
could lead to a uniform rise of the sea-level of
75 meters!
Taking into account the limits of such models,
the scientists are presently less pessimistic
and forecast a sea-level rise somewhere
between 20 cm and 60 cm before 2100,
including seawater expansion
3-1 Baffin-island northeast (Canada) © A.Walk.de
IC MPE Exhibition brochure ARTWORK.indd 13 08/10/2015 15:1814 MATHEMATICS OF PLANET EARTH
Permeable or
impermeable?
The study of the diffusion of liquids in the soil, also
called percolation, allows scientists to measure
how water diffuses in the soil, how fast aquifers are
replenished, and understand the diffusion of gas,
petrol and pollutants in the soil.
It is the English mathematician J.M. Hammersley who,
in 1965, highlighted that diffusion and percolation also
occur in telecommunication networks, the spreading
of epidemics, the propagation of fire and the phase
transition from water to ice.
From where comes
the difference?
Why can water diffuse in certain rocks? We can model
a porous medium by a regular grid formed with tubes.
3-2 Permeable or impermeable?
Tubes are closed at random. If the number of closed
tubes is small, then the open tubes form passages
through which the water can flow from one side to the
other. When increasing the number of closed tubes,
a percolation threshold is reached and the medium
becomes impermeable.
Percolation: try to find anotner path
© CR.-Montreal
Perméable
The study of the diffusion In 1965, the English mathematician J.M. ou imperméable ?
L’étude de la diffusion des liquides dans le sol - la percolation -
Hammersley, highlighted that diffusion and
permet aux scientifiques de mesurer la diffusion de l’eau
dans les sols, de savoir à quel rythme elle recharge les
of liquids in the soil, also
nappes aquifères et de comprendre comment se diffusent
les gaz, le pétrole et les polluants dans le sol.
percolation also occur in telecommunication C’est le mathématicien anglais J.M. Hammersley qui, en
1965, a mis en évidence ces phénomènes d’écoulement
qui se retrouvent dans le fonctionnement des réseaux
de télécommunications, la contagion d’une épidémie, la
called percolation, allows networks, the spreading of epidemics, the
propagation d’incendies ou encore la prise d’une gelée.
D’où vient la différence ?
propagation of fire and the phase transition
Pourquoi certaines roches sont-elles perméables ?
On peut comparer un milieu poreux à une grille régulière
scientists to measure how
formée de tubes que l’on bouche aléatoirement l’un après
l’autre. Si le nombre de passages obstrués est faible, l’eau
peut passer de part et d’autre à travers des enfilades
from water to ice. continues de “tubes”. En augmentant ce nombre, le seuil de
percolation est atteint, le milieu devient imperméable.
water diffuses in the soil, how Why can water diffuse in certain rocks?
fast aquifers are replenished, We can model a porous medium by a regular
grid formed with tubes. Tubes are closed
and understand the diffusion at random. If the number of closed tubes is
of gas, petrol and pollutants
Spread of fires in Russia in 2010
© Nasa-EOS
small, then the open tubes form passages Source of the Loue river (France)
© Arnaud 25/ S[cube] 2010
through which the water can flow from one
in the soil. side to the other. When increasing the number
of closed tubes, a percolation threshold
is reached and the medium becomes
impermeable.
© Klaus Tschira Stiftung
3-2 Submarine Cable Map -2012 © Primetrica Inc.
IC MPE Exhibition brochure ARTWORK.indd 14 08/10/2015 15:1815 AN INTERACTIVE ITINERANT SCIENTIFIC EXHIBITION
Water dilates when warming A mathematical model of percolation
References: But the principal cause of the rising of the sea phenomena
©© imaginary.org/hands-on/the-melting-of- level is the thermal expansion of seawater. In These paths are unstable and do not form at
glaciers the last century, the temperature of the Earth each try. It suffices to turn a few squares to
increased by 0.6 °C, inducing a warming of have them appear or disappear.
©© imaginary.org/hands-on/permeable-or-
the oceans at a deepness of 1 km and causing
impermeable This game helps explaining the permeability
a sea level rise of 15 cm. Global warming
of irregular materials, like rocks, and also
Activities: continues to increase the temperature of the
the electric conductivity. It provides a simple
oceans at greater depths.
3-1 Why does the sea level rise? mathematical model of these physical
With your fingers, heat the lower container. 3-2 “A porous abacus” phenomena.
What happens? Why? Place the abacus vertically and make the
squares turn around the axes. Then put back Source:
What should you find? the abacus on its support. Does there exist a
3-1 Centre•Sciences
Global warming causes the melting of ice. path composed of red lines connecting two
When the ice comes from continental glaciers opposite sides? 3-2 Xavier Guyon (University of Paris) and
(mainly Antarctica and Greenland), this adds S[cube]-CCSTi Île-de-France
water to the oceans. What should you find?
The sides of the abacus contain squares
On the other hand, Archimedes’ principle representing links that can be created with
shows that the melting of the Arctic ice field neighbouring squares. When turning a square,
and of the icebergs does not change the the connections change. The experience
volume of the oceans. shows a random drawing where there exist
many paths from one side to the other. These
are called “percolation paths”.
IC MPE Exhibition brochure ARTWORK.indd 15 08/10/2015 15:1816 MATHEMATICS OF PLANET EARTH
Is the core
of the Earth
4. From the Core of Earth liquid or solid?
Using the anomalies in the propagation of seismic
waves detected by analysing seismic data recorded
by seismographs around the world, the Danish
to Tectonic Plates
mathematician Inge Lehmann showed in 1936 that
the liquid the Earth’s liquid core contains a solid inner
core with a radius of 1,200 km.
Despite a temperature of above 5 000 °C, the inner
core is solid because of the pressure, which is more
than 3.5 million times stronger at a depth of 5,000 km
than on the surface.
How to “travel” inside the Earth?
In order to understand the inner structure of the Earth,
scientists put on mathematical glasses to interpret Arenal volcano – Costa-Rica
4-1 Is the core of the Earth liquid or solid?
© Objectif Volcans 2006
the data on seismic waves. They see that the outer
core of the Earth is liquid because shear waves do not
propagate in it. As for the pressure waves, they are
refracted when they enter the outer core. If there was
no solid inner core, an annular region (in brown on the
figure) would exist where no seismic waves would be
detected.
Using the anomalies in the Despite a temperature of above 5 000 °C, the Le cœur de la Terre,
solide ou liquide ?
inner core is solid because of the pressure, En analysant les anomalies dans la propagation des
propagation of seismic
ondes sismiques à partir des données recueillies par des
sismographes autour de la terre, la mathématicienne danoise
Inge Lehmann montre en 1936 que le noyau liquide de la Terre
which is more than 3.5 million times stronger
contient une graine solide de 1 200 km de rayon.
Malgré une température supérieure à 5 000 °C, la graine
devient solide sous l’effet de la pression, plus de 3,5 millions
de fois plus forte à 5 000 km de profondeur qu’en surface.
waves detected by analysing at a depth of 5,000 km than on the surface. Comment voyager
au centre de la Terre ?
Pour comprendre la structure interne de la Terre, les Earth core
seismic data recorded
© SR-CS
scientifiques mettent des lunettes mathématiques pour
How to “travel” inside the Earth?
interpréter les données sur les ondes sismiques.
Ils voient que le noyau externe de la Terre est liquide parce que
les ondes de cisaillement ne s’y propagent pas. Les ondes de
pression, elles, sont réfractées lorsqu’elles pénètrent dans
le noyau externe. S’il n’y avait pas de noyau interne solide
In order to understand the inner structure
sur lequel des ondes sont réfléchies, ils verraient une zone
by seismographs around
annulaire (en brun sur le schéma) où aucune onde sismique
n’est détectée.
of the Earth, scientists put on mathematical
the world, the Danish glasses to interpret the data on seismic waves.
They see that the outer core of the Earth is
mathematician Inge Lehmann liquid because shear waves do not propagate
showed in 1936 that the in it. As for the pressure waves, they are
refracted when they enter the outer core.
Earth’s liquid core contains a
Seismic waves trajectories
© C.Rousseau-Montreal
If there was no solid inner core, an annular
solid inner core with a radius region (in brown on the figure) would exist
of 1,200 km. where no seismic waves would be detected.
4-1 Earth’s gravity field & mass distribution
© Goce sat.-ESA 2004
IC MPE Exhibition brochure ARTWORK.indd 16 08/10/2015 15:1817 AN INTERACTIVE ITINERANT SCIENTIFIC EXHIBITION
Tectonic plates
From the inner core to the surface the Earth
temperature decreases. This induces convection
movements in the Earth’s mantle. The warmer magma
moves closer to the surface where it cools down.
It then sinks inside the mantle and a new cycle is
started. This induces movements of the rigid tectonic
plaques at the surface and creates shears.
How do the tectonic plates move?
There are a dozen of large rigid tectonic plates. They
move very slowly. On a sphere, these movements are
well approximated by a rotation around an axis going
through the centre of the Earth. The two intersection
points of this axis with the Earth’s surface are called
Eulerian poles.
The plate’s movement can be described by three
parameters:
• the latitude and the longitude of one of the plate’s
4-2 Tectonic plates
Eulerian poles,
• the angular rotation speed of the plate around its
axis.
When two plates move apart a rift is formed (Iceland,
East Africa rift). When two plates come closer,
earthquakes are likely as well as the formation of
mountains (the Alps, Andes, Himalayas…).
From the inner core to the How do the tectonic plates move? Tectonic plate movement
© S.Roux-CS
La tectonique
des plaques
There are a dozen of large rigid tectonic
surface the Earth temperature
Du noyau interne à la surface, la Terre se refroidit et entraîne
des mouvements de convection dans le manteau terrestre.
La matière chaude monte et se refroidit à la surface. Elle
plates. They move very slowly. On a sphere,
replonge alors dans le manteau où elle se réchauffe à
nouveau et recommence un nouveau cycle. La présence de
plaques rigides en surface crée des cisaillements.
decreases. This induces these movements are well approximated
Comment se déplacent ces plaques ?
Les plaques terrestres - une douzaine de calottes rigides - se
déplacent très lentement. Sur une sphère, ces mouvements
by a rotation around an axis going through
s’apparentent à une rotation autour d’un axe passant par le
centre de la Terre et sortant par deux points appelés pôles
convection movements in the
eulériens.
La description mathématique du mouvement des plaques fait
intervenir trois paramètres :
the centre of the Earth. The two intersection
• la latitude et la longitude d’un pôle eulérien de la plaque,
• la vitesse de rotation angulaire de la plaque autour de
l’axe.
Earth’s mantle. The warmer
Quand deux plaques s’écartent, une faille se crée et des
points of this axis with the Earth’s surface are volcans peuvent apparaître (Islande, rift de l’Afrique de
l’est). Quand elles se rapprochent, il y a possibilité de séisme
ou naissance d’une chaîne de montagnes (Alpes, Andes,
Himalaya…).
called Eulerian poles. The Mid-Atlantic ridge ``
magma moves closer to the
© J.Y.Royer-Cnrs & Brest University
The plate’s movement can be described by
surface where it cools down. three parameters:
It then sinks inside the mantle ©© the latitude and the longitude of one of the
The Great Rift Valley in East Africa
© C.Hormann-earth.imagico.de
and a new cycle is started. plate’s Eulerian poles,
This induces movements of the ©© the angular rotation speed of the plate
rigid tectonic plaques at the around its axis.
surface and creates shears. When two plates move apart a rift is formed
(Iceland, East Africa rift). When two plates
come closer, earthquakes are likely as well as
the formation of mountains (the Alps, Andes,
Himalayas…).
4-2 San Andreas fault – California © Nasa.EOS
IC MPE Exhibition brochure ARTWORK.indd 17 08/10/2015 15:1818 MATHEMATICS OF PLANET EARTH
References: Source:
©© imaginary.org/hands-on/is-the-core-of-the- the inner structure of the Earth using the data Christiane Rousseau (University of Montreal)
earth-solid-or-liquid on travel times of seismic waves recorded by and Centre•Sciences & Tryame
different stations around the world. The model
©© imaginary.org/hands-on/tectonic-plates
below was proposed by Inge Lehmann to
explain the observed seismic data: the waves
are reflected on the inner core.
Activities:
© Klaus Tschira Stiftung
Travelling through the Earth
4-1 The open heart of the Earth!
Two earthquakes just occurred in the Southern To study the core of the Earth, use your
hemisphere. Observe the seismic waves mathematical eyes: move the green laser to
trajectories in the open part of the Earth. Can observe the propagation of seismic waves
you find where the earthquakes occurred? inside the Earth.
What should you find? What should we find?
To show that the inner core is solid, Inge At the time of Inge Lehmann, it was admitted
Lehmann analysed the travel paths and arrival that a mantle would surround a core. However,
times of the seismic waves generated by large some seismic waves seemed to indicate that
earthquakes located at antipodal points. this model has a flaw and must be correct to fit
with the observed data. Inge Lehman deduced
Calculate the travel time of seismic waves
that the core was not homogeneous: there is
It is easy to calculate the travel path and
a smaller inner core, surrounded by the outer
travel time of seismic waves if one knows the
core. Hence, the wave could be reflected if the
materials through which the wave has travelled.
angle of incidence is sufficiently large.
However, mathematicians want to reconstruct
IC MPE Exhibition brochure ARTWORK.indd 18 08/10/2015 15:1819 AN INTERACTIVE ITINERANT SCIENTIFIC EXHIBITION
Activities: Source:
4-2 Tectonic plates and subduction Jean-Pierre Brun (University of Rennes) and
Observe how slowly this very viscous material Centre•Sciences
flows. It simulates, in the laboratory, the
moving of tectonic plates.
What should you find?
© Klaus Tschira Stiftung
This silicon plate moves very slowly - similar to
the tectonic plates of Earth’s crust. A mountain
range starts by the closure of an oceanic
region. There is a lot of volcanic activity on
the overlapping continent, which undergoes
tectonic compression leading to a thickening
of the crust and to the formation of mountain
ranges with rifts, overlapping and folds. Once
the ocean has completely disappeared, the
continental margin enters in subduction under
the thickened continent. This movement
cannot last very long since the difference of
density between the crust and the mantle is an
obstruction to this subduction.
IC MPE Exhibition brochure ARTWORK.indd 19 08/10/2015 15:1820 MATHEMATICS OF PLANET EARTH
From the Earth
to the sky
5. The Solar System To correct for the effects of atmospheric turbulence
on images obtained by large terrestrial telescopes, a
mathematical technique is used to improve the angular
resolution of the images: each pixel is replaced by a
linear combination of the neighbouring pixels.
How to reduce noise?
In the processing and transport of images taken by
satellites, digital pictures often contain defaults,
called noise, mainly due to yje sensors.
To reduce the noise in the images, one can use partial
differential equations. The best-known is the “heat
equation”. For a gray level image, this turns out to
replace the gray level of each point by a weighted mean
of the gray levels of its neighbours. A drawback of this
method is that it yields fuzzy boundaries on objects.
5-1 From the Earth to the sky
This can be avoided through smoothing techniques,
which use only selected neighbouring points.
Entre ciel et Terre
Pour corriger l’effet des turbulences atmosphériques
sur les images obtenues par nos grands télescopes et
To correct for the effects of
radiotélescopes terrestres, un traitement mathématique est
How to reduce noise?
First image of the Universe,
appliqué, lequel permet d’améliorer la résolution angulaire 300,000 years after the Big-Bang
(WMAP Satellite) © Nasa-EOS
des images obtenues : chaque pixel de l’image est remplacé
par une combinaison linéaire des pixels voisins.
In the processing and transport of images Comment débruiter ?
atmospheric turbulence on taken by satellites, digital pictures often
Dans la saisie, le traitement et le transport des images prises
par les satellites, ces images présentent des défauts, appelés
bruits, qui sont dus aux capteurs.
Pour débruiter ces images à la réception, on utilise des
équations aux dérivées partielles. La plus connue est
images obtained by large contain defaults, called noise, mainly due to
l’équation de la chaleur. Pour une image en noir et blanc,
cela revient à considérer que le niveau de gris de chaque
point est une moyenne pondérée des niveaux de gris des
points voisins. Cela a comme inconvénient de rendre flous
les bords des objets. On y remédie en utilisant des lissages
the sensors.
qui n’emploient pas tous les points voisins.
terrestrial telescopes, a
To reduce the noise in the images, one can use
mathematical technique is partial differential equations. The best-known Isaac VLT in Chile
© ESO Laboratory
used to improve the angular is the “heat equation”. For a gray level image, Infrared Photo of Eagle-Nebula.
1 to 10 Light-Years between stars
© ESO Laboratory
this turns out to replace the gray level of each
resolution of the images: point by a weighted mean of the gray levels
each pixel is replaced by a of its neighbours. A drawback of this method
Ultra deep field of the Universe:
10 millions Light-Years between galaxies
© Hubble/Esa-Nasa
is that it yields fuzzy boundaries on objects.
linear combination of the This can be avoided through smoothing
neighbouring pixels. techniques, which use only selected
neighbouring points.
5-1
IC MPE Exhibition brochure ARTWORK.indd 20 08/10/2015 15:1921 AN INTERACTIVE ITINERANT SCIENTIFIC EXHIBITION
Where is the
Sun at noon?
Maybe you have already noticed that the middle of
the day (or solar noon) is not always at the same time
on your watch? The sunset is sooner on December 10
than at the winter solstice.
If you observe the Sun at noon every day, then its
position draws a figure eight curve, called analemna,
with endpoints at the winter and summer solstices.
The equation of time
The equation of time is the difference between the
solar noon and the official noon.
This difference is explained by two phenomena:
- Since Kepler, we know that the Earth’s orbit is an
ellipse with the sun located at one focus. The Earth
travels faster when it is closer to the sun, i.e. during
the boreal winter: real days are then shorter than
Gallipoli-Puglia-Italy
5-2 Where is the Sun at noon?
© Mi.Ti-Fotolia.com official days.
- The Earth’s axis is at an angle of 23.5 ° with respect
to the axis normal to the plane where it rotates around
the Sun (the ecliptic plane). Thus, solar days are then
longer than the average days around the summer and
winter solstices.
These daily differences add up during the year.
Maybe you have already
Où est le Soleil à midi ?
The equation of time Avez-vous déjà remarqué que le milieu du jour (ou midi
solaire) n’est pas toujours à la même heure sur votre montre ?
The equation of time is the difference between
Le Soleil se couche plus tôt le 10 décembre qu’au solstice
d’hiver.
noticed that the middle of
Observez le Soleil à midi chaque semaine. Sur un an, sa
position décrit un grand 8, appelé analemme, dont les
extrémités sont aux solstices d’hiver et d’été.
the solar noon and the official noon. L’équation du temps
the day (or solar noon) is not
C’est la différence entre le midi officiel et le midi solaire.
Cette différence a deux causes :
This difference is explained by two
Sundial
© Inga Nielsen-Fotolia.com - Depuis Kepler, nous savons que la Terre décrit une ellipse
dont le Soleil est l’un des foyers. Elle tourne plus vite autour
du Soleil lorsqu’elle en est plus près, soit pendant l’hiver
always at the same time on
boréal : les jours réels sont alors plus longs que les jours
phenomena:
officiels.
- L’axe de la Terre a une inclinaison fixe de 23,5 ° par rapport
à la normale au plan de rotation autour du Soleil (l’écliptique).
Les jours solaires sont plus longs que les jours moyens
autour des solstices d’hiver et d’été.
your watch? The sunset is
Ces différences journalières s’additionnent.
©© Since Kepler, we know that the Earth’s
orbit is an ellipse with the Sun located at
sooner on December 10 than at one focus. The Earth travels faster when it
the winter solstice. is closer to the Sun, i.e. during the boreal The ecliptic - Earth’s orbital plane
© SR-Orléans
winter: real days are then shorter than
If you observe the Sun at noon every day, then Analemma
© O.Morand/S.Roux-Orléans
official days.
its position draws a figure eight curve, called
analemna, with endpoints at the winter and ©© The Earth’s axis is at an angle of 23.5 °
summer solstices. with respect to the axis normal to the
plane where it rotates around the Sun (the
ecliptic plane). Thus, solar days are then
longer than the average days around the
summer and winter solstices.
These daily differences add up during the year.
5-2
IC MPE Exhibition brochure ARTWORK.indd 21 08/10/2015 15:1922 MATHEMATICS OF PLANET EARTH
References: Activities: Source:
©© imaginary.org/hands-on/where-is-the-sun- 5-1 The course of the Sun Centre•Sciences
at-noon Place the Sun on one of the seasons. Have it
turn around the Earth. Imagine the shadow
of the palm tree.
What should you find?
© Klaus Tschira Stiftung
The sunrise is on the east and the sunset on
the west. At noon, the Sun is at its highest
position, and the shadow of a stick hammered
in Earth is the shortest at midday. Outside of
the tropics, the shadow is the shortest at the
summer solstice.
A stick hammered in Earth is the oldest
sundial. It allows dividing the day into two
parts: before noon and after noon. If we
could see the stars at the same time as the
Sun, we would see them turning during the
day, but, each month, the Sun would have
changed constellation. The Sun visits the
12 constellations of the Zodiac, one per
month of the year. This is the case since the
Sun is the star closest to the Earth.
IC MPE Exhibition brochure ARTWORK.indd 22 08/10/2015 15:1923 AN INTERACTIVE ITINERANT SCIENTIFIC EXHIBITION
Where are you?
6. The Space of Satellites and
How many satellites orbiting around the Earth are
needed to compute exactly one’s exact position at
each instant?
The GPS system uses a set of satellites (at least 24)
orbiting around the Earth and emitting signals.
An ideal GPS receiver measures the travel time of
three signals from emitted by three satellites to the
receiver. From these measurements, it computes its
Communication
distance to each satellite.
The set of points at a given distance from a satellite is
a sphere centred at the satellite. The receiver is hence
located at one of the two intersection points of three
spheres centred on each of the satellites. The second
intersection point is eliminated since located very far
from the surface of the Earth’s surface.
An underlying hypothesis is that the receiver’s clock is
perfectly synchronized with those of the satellites...
And if not?
6-1 Where are you? Then the receiver needs to measure the signal‘s travel
time from a fourth satellite. From these four (fictitious)
travel times, it computes three position coordinates
and the time shift between its clock and that of the
satellites.
Où suis-je ?
How many satellites orbiting An underlying hypothesis is that the receiver’s Combien faut-il de satellites en orbite autour de la
Terre pour savoir à tout instant où l’on se trouve ?
clock is perfectly synchronized with those of
Le système GPS utilise un ensemble de satellites en
orbite (au moins 24) autour de la Terre, et qui émettent
around the Earth are needed
des signaux. Un récepteur GPS idéal mesure le
temps de parcours de trois signaux émis depuis trois
the satellites...
satellites jusqu’à lui. De cette mesure, il déduit sa
distance à chacun des trois satellites.
L’ensemble des points à une distance donnée d’un
to compute one’s exact
satellite est une sphère centrée au satellite. Le
récepteur est donc l’un des deux points d’intersection
de trois sphères centrées en chacun des trois
And if not? satellites. Le deuxième point d’intersection est éliminé
parce que très loin de la surface de la Terre.
Ce calcul suppose que l’horloge du récepteur soit
position at each instant?
parfaitement synchronisée sur celle des satellites…
Then the receiver needs to measure the Et si ce n’est pas le cas ?
signal‘s travel time from a fourth satellite.
Alors, le récepteur a besoin de capter le temps de
parcours d’un quatrième satellite. À partir de ces
quatre temps de parcours (fictifs), il calcule ses trois
The GPS system uses a set of satellites
coordonnées de position et le décalage de son horloge
From these four (fictitious) travel times, it
avec celle des satellites.
(at least 24) orbiting around the Earth and computes three position coordinates and the
emitting signals. time shift between its clock and that of the
An ideal GPS receiver measures the travel satellites. 4 satellites to know where
ere I am
© SR-Orléans
time of three signals emitted by three Galileo orbits © Esa-www.galileoic.org
satellites to the receiver. From these
measurements, it computes its distance to
each satellite. The set of points at a given
distance from a satellite is a sphere centred
at the satellite.
The receiver is hence located at one of the
two intersection points of three spheres
centred on each of the satellites. The second
intersection point is eliminated since located
very far from the surface of the Earth.
6-1 GPS satellites © P.Carrill-Esa-2004
IC MPE Exhibition brochure ARTWORK.indd 23 08/10/2015 15:1924 MATHEMATICS OF PLANET EARTH
Satellites
under control
Telecommunications, navigation, meteorology, etc.,
but also mobile phones, GPS and the Internet, provide
numerous reasons to place satellites in orbiti around
the Earth.
For this purpose, mathematicians select and optimise
trajectories and orbits of spacecrafts with more
sophisticated techniques.
Controlling the trajectory!
A satellite will remain on its orbit without the need
of additional energy if is given the right initial speed:
this speed depends on the altitude of the orbit. There
is only one possible altitude for a geostationary
satellite: 36,000 km, the one for which the centrifugal
force exerted on the satellite is exactly equal to the
gravitational attraction of the Earth.
6-2 Satellites under control
The same type of techniques can be used when
designing interplanetary missions. In that case,
the spacecraft is accelerated by passing close to
celestial bodies. Moreover, to minimize energy spent
in deceleration, its speed of approach should be small
close to the celestial bodies it is visiting.
Les satellites :
Telecommunications, Controlling the trajectory! tout est sous contrôle
Télécommunications, navigation, météorologie..., mais aussi
A satellite will remain on its orbit without the
téléphones cellulaires, GPS, Internet, autant de raisons
d’envoyer des satellites autour de la Terre.
navigation, meteorology,
Pour cela, les mathématiciens sélectionnent et optimisent
les trajectoires et les orbites des engins spatiaux avec des
méthodes de plus en plus sophistiquées.
need of additional energy if it is given the Une assistance de chaque instant !
etc., but also mobile phones, right initial speed: this speed depends on the
Un satellite se maintiendra sur son orbite sans énergie
additionnelle si on lui confère la bonne vitesse : cette
vitesse dépend de l’altitude de l’orbite. Pour les satellites
géostationnaires, il n’y en a qu’une possible : 36 000 km,
altitude pour laquelle la force centrifuge ressentie par le
altitude of the orbit. There is only one possible
satellite est exactement égale à l’attraction gravitationnelle
GPS and the Internet, provide
de la Terre.
Le même type de techniques peut être utilisé pour les missions
interplanétaires : on accélère le véhicule spatial en lui faisant
frôler des corps célestes. On s’arrange aussi pour qu’il arrive
altitude for a geostationary satellite: 36,000 en douceur auprès des corps célestes qu’il va visiter.
numerous reasons to place
Space Shuttle Discovery approaching ISS
km, the one for which the centrifugal force
© Nasa-Eos
exerted on the satellite is exactly equal to the
satellites in orbits around gravitational attraction of the Earth.
the Earth. For this purpose, The same type of techniques can be used
mathematicians select and when designing interplanetary missions. In
that case, the spacecraft is accelerated by
optimise trajectories and passing close to celestial bodies. Moreover,
orbits of spacecrafts with more to minimize energy spent in deceleration, its
sophisticated techniques. speed of approach should be small close to
the celestial bodies it is visiting.
6-2 The International Space Station © Nasa-Eos
IC MPE Exhibition brochure ARTWORK.indd 24 08/10/2015 15:1925 AN INTERACTIVE ITINERANT SCIENTIFIC EXHIBITION
References: Activities: Source:
©© imaginary.org/hands-on/satellites-under- 6-1 Measuring the height of the Earth Centre•Sciences & Tryame
control Move the satellite and find the highest point
and the lowest one. To take a measurement,
©© imaginary.org/hands-on/where-are-you
first press on the red button, then push on the
green button to record the measurement.
What should you find?
The radar can see the height of the surface of
the Earth by measuring the roundtrip travel
time of a wave emitted by the satellite to the
Earth. These waves cross the atmosphere and
are reflected on the ground. This technique
can be used day and night, as well as during
cloudy periods.
A stereographic view of the oceans
These height measurements allow us
to determine, with a precision of a few
centimetres, the height of the Earth and the
surface of the oceans, and to produce 3D
maps. One can then observe the circulation of
ocean currents and their variations.
IC MPE Exhibition brochure ARTWORK.indd 25 08/10/2015 15:1926 MATHEMATICS OF PLANET EARTH
Activities: Source:
6-2 Orbiting satellites! These orbits can be: Jean Brette (Paris) and Centre•Sciences
Take the tray in your hands. Make it turn as a
©© geostationary for communication, remote
gold panner would make. And make a marble
sensing. The satellites are in orbit at
turn around the Earth. Try to get it to move
an altitude of 36,000 km with the same
on an elliptical orbit. Can its orbit be circular?
angular rotation speed as the Earth.
© Klaus Tschira Stiftung
Why can it escape from the support?
©© polar, with the satellite’s orbit crossing the
What should you find?
polar axis at an altitude between 700 and
The precise orbit of a satellite depends on its
800 km.
mission: observation, communication, GPS,
etc. It will remain on its chosen orbit if it is ©© almost circular. This is the case of the 24
given the right speed. satellites of the GPS system, which orbit at
an altitude of 20,000 km with a speed of
14,000 km/h.
For determining these satellite orbits,
mathematicians use tools developed since
Kepler, but also recent results taking into
account both special and general relativity.
IC MPE Exhibition brochure ARTWORK.indd 26 08/10/2015 15:19You can also read