Media Release | 18 February 2021 FY21 Interim Results: Continuing to manage the impact of COVID-19, while preparing for a safe recovery in ...
←
→
Page content transcription
If your browser does not render page correctly, please read the page content below

Media Release | 18 February 2021

FY21 Interim Results: Continuing to manage
the impact of COVID-19, while preparing for
a safe recovery in trans-Tasman travel

Auckland Airport today announced its financial results for the six months to 31
December 2020.

Auckland Airport Chair Patrick Strange said: “The first half of the 2021 financial year
has continued to be a challenging time for both the company and the wider aviation
industry. While we were pleased to see domestic travel starting to rebuild, international
travel has remained at very low levels.

“The past six months have been a period of constant adjustment for Auckland Airport.
We have taken the opportunity to continue our programme to upgrade core
infrastructure during this period of low passenger numbers while also supporting the
New Zealand government, border agencies and airlines in the operation of a safe
border.

“The company has also been hard at work alongside industry, stakeholders and
medical experts to help establish a recovery path for New Zealand. One area of focus
has been implementing the trial of new testing technologies to improve access to rapid,
low-cost, and less invasive COVID-19 testing for our staff working at the border.

“We have also supported the development of a scientific risk-based model to safely
manage the risk of COVID-19 across the aviation system. Using a ‘traffic light’
approach to categorise countries using COVID-19 risk data, the model offers a method
that could be applied to safely re-establish regular and reliable air connections with low-
risk countries like Australia and certain Pacific nations when that approach is combined
with New Zealand’s domestic virus management strategy and ongoing controls at the
border.”

Mr Strange acknowledged the outstanding efforts of everyone who works at Auckland
Airport and noted that they have done a great job in responding to the quickly evolving
operating environment and the additional health and safety measures required as a
result of the pandemic.

Key performance data for the six months to 31 December 2020:

•   Total number of passengers decreased to 2.8 million, down 73.4% on the previous
    six-month period to 31 December 2019
•   Domestic passengers decreased 44.6% to 2.6 million, and international passengers
    (including transits) decreased 96.8% to 187,003
•   Revenue was down 64.9% to 131.5 million
•   Operating EBITDAFI was down 68.4% to $88.2 million
•   Reported profit after tax was down 80.9% to $28.1 million
•   Earnings per share was down 84.1% to 1.91 cents
•   Net underlying loss after tax of $10.5 million 1
•   Net underlying loss per share of 0.71 cents 1
•   No interim dividend will be paid

Chief Executive Adrian Littlewood said the impact of the COVID-19-related travel
restrictions continued to be felt across the business in the first half of the 2021 financial
year.

“Recognising the ongoing impact that COVID-19 could have on Auckland Airport we
took significant steps to reposition the company.                    Core operating expenses were
reduced by $33 million, or 34%, in the six months to 30 December 2020 and we scaled-
back our significant infrastructure expansion programme while continuing to focus on
upgrading critical infrastructure assets such as runways and roads.

“Nevertheless, the lower number of passengers, especially international and transit
passengers, resulted in significant decreases to our key aeronautical, retail and
transport income. Revenue from our hotel operations and our investment in
Queenstown Airport also declined.

1
 We recognise that EBITDAFI and underlying loss are non-GAAP measures. Please refer to the table at the end of
the media release for the reconciliation of reported profit after tax to underlying loss after tax.
“The partial recovery of New Zealand’s domestic travel market was a positive sign in
the first half of the 2021 financial year. Pleasingly, our domestic passenger numbers
have now recovered to around 65% of the pre-pandemic level. This was in part
achieved by working very closely with domestic airlines and other businesses operating
at the domestic terminal to ensure a high-quality and safe travel experience. It was a
real team effort across the airport system, and I want to acknowledge and thank
everyone involved in this critical work.

“The ongoing success of Auckland Airport’s commercial property business was a
highlight of the first half of the 2021 financial year. Property revenue increased 2.4% to
$47 million, driven by rental growth in the existing property portfolio and a part year
contribution from the large new Foodstuffs distribution centre.

“We have a number of new commercial developments currently under construction
which we expect to be valued at more than $223 million on completion with an
annualised rent roll of $116 million. Our commercial property portfolio is now valued at
approximately $2.4 billion, up 15% in the year to 31 December 2020. This is an
outstanding result that reflects both the underlying quality of our assets and the high-
quality approach of our commercial development team.”

Responding to COVID-19 in 1H21

Mr Littlewood said the unprecedented impact of COVID-19 called for a rapid response
to best protect Auckland Airport’s travellers, precinct workers, the wider community and
its business.

“Our procedures have been completely revised with new operational models to assist
travellers and meet new and evolving border requirements. We developed and
implemented a comprehensive process that included enhancing cleaning protocols,
managing physical distancing, staff protection, new passenger communications, and
reorganising the layout of our international terminal to allow for the separation of
different categories of passengers. We also worked closely with airlines to help
maintain New Zealand’s global freight connectivity. The government’s international air
freight capacity support scheme has also been an important facility to ensure New
Zealand remains connected to its international markets.

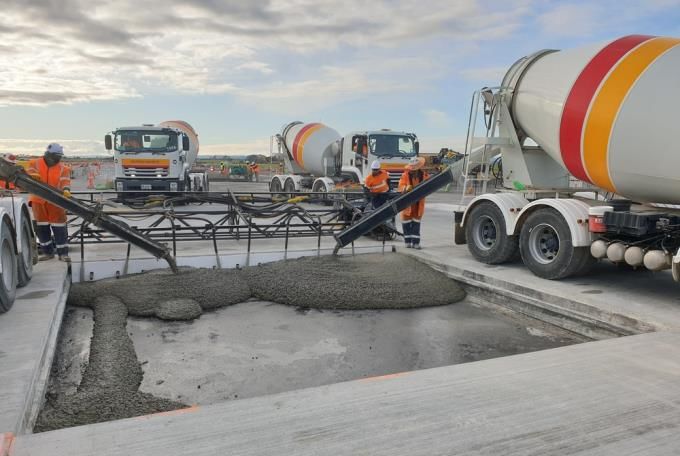
“We were pleased to be the first New Zealand airport to receive Airports Council
International’s Airport Health Accreditation – an endorsement of our COVID-19 health
and safety measures.

“Despite the impact of the COVID-19-related travel restrictions on the company
Auckland Airport was able to continue its support of projects within the local community,
many of which were also impacted by the pandemic. Auckland Airport also remained
committed to long term sustainability by developing a new 10-year strategy with new
targets to guide its activities in relation to diversity, health and safety, resource
consumption, and carbon.”

Positioning for the recovery from COVID-19

Throughout the response to COVID-19 we have constantly adjusted our approach to
ensure we are best placed to recover and manage through the ongoing uncertainty,
said Mr Littlewood.

“As we enter a second year of operating in a pandemic environment we continue to
look for opportunities to strengthen our health and safety response, particularly for
those at the front line, and help support the development of a path to safely restart two-
way connections with our closest neighbours in Australia and the Pacific Islands. Our
work in implementing new rapid saliva testing technology for staff and the proposal for
a safe model to re-open to low risk countries like Australia are examples and we will
continue that work with our colleagues in the aviation and travel industry.

“We have also been reworking our infrastructure development roadmap with airlines to
ensure our refreshed plan for developing airport infrastructure reflects the reality of a
post-pandemic recovery while serving the needs of our airline customers and the
travelling public.

“The low-volume of aeronautical activity has provided a unique opportunity to
accelerate select infrastructure upgrades. Most noticeably for visitors to the airport we
have continued with a major upgrade of the northern airport access road to include high
occupancy vehicle lanes, shared pedestrian and cycle paths, and new wayfinding
gantries. We’ve also successfully completed the replacement of more than 360
concrete slabs in the runway’s east and west touchdown zones and made progress on
an upgrade of the airside fuel network. In January 2021 we began a pavement upgrade
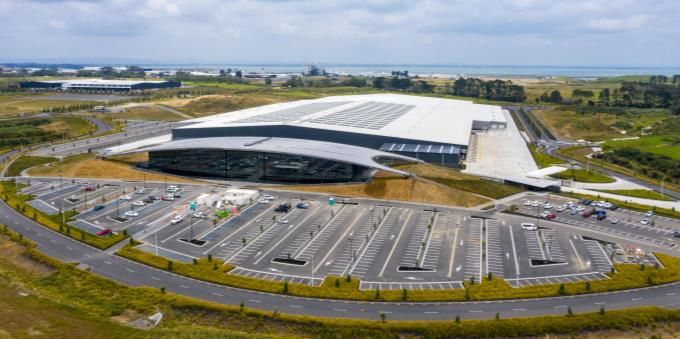
across the airfield’s taxiways and apron and restarted work on a new one-way exit road
system for the international terminal in line with our future terminal development plans.

“The momentum in our commercial property business continued with the completion of
the 84,000 square metre Foodstuffs warehouse and office and a 10,000 square metre
warehouse on Timberly Road. Construction also continued on the structures and
façades of the 5-star Te Arikinui Pullman Hotel and the 4-star Mercure Hotel with the fit-
out of both hotels scheduled for completion when market conditions improve. A $172
million future property development pipeline to accommodate clients such as EBOS
(Healthcare Logistics), Geodis Wilson, Hellmann, DHL and Interwaste will help
Auckland Airport’s property business continue to grow.”

Outlook

Mr Littlewood said: “We expect the timing of the recovery will remain uncertain in the
coming five months of the 2021 financial year. While we have already seen a partial
recovery of domestic travel and the opening of one-way quarantine free travel to
Australia, our recovery path is strongly linked to two-way quarantine free trans-Tasman
travel.

“Despite the ongoing level of uncertainty around the recovery of trans-Tasman and
wider international travel the company is providing underlying earnings guidance for the
2021 financial year of a loss after tax of between $35 million and $55 million.

“Although the government remains committed to restarting two-way trans-Tasman
travel, and we support this, for the purposes of this underlying earnings guidance we
have assumed there will be no material quarantine-free, two-way Tasman travel during
the remainder of the 2021 financial year. It also assumes no further lockdowns of an
extended duration during the period.

“Auckland Airport has a strong focus on investing in infrastructure to help position the
company for the safe and measured recovery in travel. The company is reducing its
capital expenditure guidance for the 2021 financial year to between $200 million and
$230 million and we continue to take a measured approach to capital expenditure due
to the current trading environment.”
The above guidance is subject to any material adverse events, significant one-off
expenses, non-cash fair value changes to property, and any deterioration due to global
market conditions or other unforeseeable circumstances.

ENDS

Note 1. Underlying profit / (loss) reconciliation

For the six months ended 31 December ($m)                       2020                                  2019
                                                   Reported Adjustments Underlying       Reported Adjustments Underlying
                                                      profit           profit / (loss)      profit           profit / (loss)
EBITDAFI per Income Statement                         88.2             -        88.2       279.2             -       279.2

Investment property fair value increase               29.8        (29.8)            -        9.1         (9.1)            -

Fixed asset impairment                                    -         0.9          0.9            -            -            -

Reversal of fixed asset termination costs                 -       (14.9)       (14.9)           -            -            -

Derivative fair value movement                         0.8         (0.8)            -       (0.4)         0.4             -

Share of profit of associates and joint ventures       3.2         (0.1)         3.1         5.0             -         5.0

Depreciation                                        (59.3)             -       (59.3)     (55.4)             -       (55.4)

Interest expense and other finance costs            (35.0)             -       (35.0)     (34.7)             -       (34.7)

Taxation expense                                       0.4          6.1          6.5      (55.6)          1.4        (54.2)

Profit after tax                                      28.1        (38.6)       (10.5)      147.2         (7.3)       139.9

We have made the following adjustments to show underlying profit / (loss) after tax for
the six months ended 31 December 2020 and 2019:

•   we have reversed out the impact of revaluations of investment property. An investor
    should monitor changes in investment property over time as a measure of growing
    value. However, a change in one particular year is too short to measure long-term
    performance. Changes between years can be volatile and, consequently, will impact
    comparisons. Finally, the revaluation is unrealised and, therefore, is not considered
    when determining dividends in accordance with the dividend policy;

•   we have reversed out the impact of fixed asset project write-offs, impairments and
    termination costs. In response to the COVID-19 outbreak, some capital expenditure
    projects were abandoned and fully written off and others were suspended. Some of
    these abandoned or suspended projects incurred contractor termination costs. The
    abandonment or suspension of live capital expenditure projects is extremely rare
and is the direct consequence of COVID-19. These fixed asset write-off costs,
    impairments and termination costs are not considered to be an element of the
    group’s normal business activities and on this basis have been excluded from
    underlying profit;

•   we have also reversed out the impact of derivative fair value movements. These are
    unrealised and relate to basis swaps that do not qualify for hedge accounting on
    foreign exchange hedges, as well as any ineffective valuation movements in other
    financial derivatives. The group holds its derivatives to maturity, so any fair value
    movements are expected to reverse out over their remaining lives;

•   we have adjusted the share of profit of associates and joint ventures to reverse out
    the impacts on those profits from revaluations of investment property and financial
    derivatives; and

•   we have also reversed out the taxation impacts of the above movements in both six-
    month periods.

For further information, please contact:

Media:
Helen Twose
Communications Manager
+64 27 254 0790
helen.twose@aucklandairport.co.nz

Investors:
Stewart Reynolds
Head of Strategy, Planning and Performance
+64 27 511 9632
stewart.reynolds@aucklandairport.co.nz
Interim Financial
Statements 2021


Contents

Financial statements                        02
Notes and accounting policies               08
Shareholder information                     24
Corporate directory                         26

                                Interim Financial Statements 2021   1
Consolidated interim income statement
FOR THE SIX MONTHS ENDED 31 DECEMBER 2020
Unaudited Unaudited
6 months to 6 months to
31 Dec 2020 31 Dec 2019
Notes $M $M
Income
Airfield income 30.8 60.8
Passenger services charge 9.5 91.1
Retail income 7.0 113.6
Rental income 55.4 57.0
Rates recoveries 3.8 3.8
Car park income 12.5 34.3
Interest income 3.1 0.7
Other income 9.4 13.4
Total income 131.5 374.7
Expenses
Staff 5 21.0 30.6
Asset management, maintenance and airport operations 24.5 42.5
Rates and insurance 10.6 8.9
Marketing and promotions 0.2 5.6
Professional services and levies 1.5 2.8
Fixed asset impairment 3 0.9 -
Reversal of fixed asset termination costs 3 (14.9) -
Other expenses 3.3 5.9
Reversal of expected credit losses (3.8) (0.8)
Total expenses 43.3 95.5
Earnings before interest expense, taxation, depreciation,
fair value adjustments and investments in associate and 88.2 279.2
joint ventures (EBITDAFI)1
Investment property fair value change 10 29.8 9.1
Derivative fair value change 0.8 (0.4)
Share of profit of associate and joint ventures 7 3.2 5.0
Earnings before interest, taxation and depreciation (EBITDA)1 122.0 292.9
Depreciation 59.3 55.4
Earnings before interest and taxation (EBIT)1 62.7 237.5
Interest expense and other finance costs 5 35.0 34.7
Profit before taxation 4 27.7 202.8
Taxation expense (0.4) 55.6
Profit after taxation, attributable to the owners of the parent 28.1 147.2
Earnings per share Cents Cents
Basic and diluted earnings per share 1.91 11.97
1 EBITDAFI, EBITDA and EBIT are non-GAAP measures.
THE FINANCIAL STATEMENTS FOR THE SIX-MONTH PERIODS HAVE NOT BEEN AUDITED. THEY HAVE BEEN THE SUBJECT OF A REVIEW
BY THE AUDITORS PURSUANT TO NEW ZEALAND STANDARD FOR REVIEW ENGAGEMENTS 2410 (REVISED) FOR THE SIX-MONTH PERIOD
TO 31 DECEMBER 2020 AND NEW ZEALAND STANDARD FOR REVIEW ENGAGEMENTS 2410 FOR THE SIX-MONTH PERIOD TO 31 DECEMBER
2019. THE FULL-YEAR FINANCIAL STATEMENTS TO 30 JUNE 2020 HAVE BEEN AUDITED.
THE ACCOMPANYING NOTES FORM PART OF THESE FINANCIAL STATEMENTS.Consolidated interim statement of comprehensive income
FOR THE SIX MONTHS ENDED 31 DECEMBER 2020
Unaudited Unaudited
6 months to 6 months to
31 Dec 2020 31 Dec 2019
$M $M
Profit for the period 28.1 147.2
Other comprehensive income
Items that may be reclassified subsequently to the income statement:
Cash flow hedges:
Fair value gains/(losses) recognised in the cash flow hedge reserve 14.4 0.4
Realised (gains)/losses transferred to the income statement (0.5) 1.2
Tax effect of movements in the cash flow hedge reserve (3.9) (0.4)
Total cash flow hedge movement 10.0 1.2
Movement in cost of hedging reserve (2.6) 2.2
Tax effect of movement in cost of hedging reserve 0.7 (0.6)
Items that may be reclassified subsequently to the income statement 8.1 2.8
Total other comprehensive income 8.1 2.8
Total comprehensive income for the period, net of tax, attributable to
36.2 150.0
the owners of the parent
THE FINANCIAL STATEMENTS FOR THE SIX-MONTH PERIODS HAVE NOT BEEN AUDITED. THEY HAVE BEEN THE SUBJECT OF A REVIEW
BY THE AUDITORS PURSUANT TO NEW ZEALAND STANDARD FOR REVIEW ENGAGEMENTS 2410 (REVISED) FOR THE SIX-MONTH PERIOD
TO 31 DECEMBER 2020 AND NEW ZEALAND STANDARD FOR REVIEW ENGAGEMENTS 2410 FOR THE SIX-MONTH PERIOD TO 31 DECEMBER
2019. THE FULL-YEAR FINANCIAL STATEMENTS TO 30 JUNE 2020 HAVE BEEN AUDITED.
THE ACCOMPANYING NOTES FORM PART OF THESE FINANCIAL STATEMENTS.
Interim Financial Statements 2021 3Consolidated interim statement of changes in equity
FOR THE SIX MONTHS ENDED 31 DECEMBER 2020
Property, plant
Issued and Cancelled and equipment
paid-up share revaluation
capital reserve reserve
Notes $M $M $M
Six months ended 31 December 2020
(unaudited)
At 1 July 2020 1,678.6 (609.2) 4,333.7
Profit for the period - - -
Other comprehensive income - - -
Total comprehensive income - - -
Reclassification to retained earnings - - (3.6)
Shares issued 11 0.6 - -
Long-term incentive plan - - -
At 31 December 2020 1,679.2 (609.2) 4,330.1
Six months ended 31 December 2019
(unaudited)
At 1 July 2019 468.2 (609.2) 4,968.8
Profit for the period - - -
Other comprehensive income - - -
Total comprehensive income - - -
Shares issued 11 32.2 - -
Dividend paid 8 - - -
At 31 December 2019 500.4 (609.2) 4,968.8
THE FINANCIAL STATEMENTS FOR THE SIX-MONTH PERIODS HAVE NOT BEEN AUDITED. THEY HAVE BEEN THE SUBJECT OF A REVIEW
BY THE AUDITORS PURSUANT TO NEW ZEALAND STANDARD FOR REVIEW ENGAGEMENTS 2410 (REVISED) FOR THE SIX-MONTH PERIOD
TO 31 DECEMBER 2020 AND NEW ZEALAND STANDARD FOR REVIEW ENGAGEMENTS 2410 FOR THE SIX-MONTH PERIOD TO 31 DECEMBER
2019. THE FULL-YEAR FINANCIAL STATEMENTS TO 30 JUNE 2020 HAVE BEEN AUDITED.
THE ACCOMPANYING NOTES FORM PART OF THESE FINANCIAL STATEMENTS.Share- Share of
based Cash flow Cost of reserves of
payments hedge hedging associate and joint Retained
reserve reserve reserve ventures earnings Total
$M $M $M $M $M $M
1.6 (100.7) (3.9) 28.8 1,308.2 6,637.1
- - - - 28.1 28.1
- 10.0 (1.9) - - 8.1
- 10.0 (1.9) - 28.1 36.2
- - - - 3.6 -
- - - - - 0.6
0.2 - - - - 0.2
1.8 (90.7) (5.8) 28.8 1,339.9 6,674.1
1.4 (67.1) (5.8) 28.8 1,247.8 6,032.9
- - - - 147.2 147.2
- 1.2 1.6 - - 2.8
- 1.2 1.6 - 147.2 150.0
- - - - - 32.2
- - - - (136.3) (136.3)
1.4 (65.9) (4.2) 28.8 1,258.7 6,078.8
Interim Financial Statements 2021 5Consolidated interim statement of financial position
AS AT 31 DECEMBER 2020
Unaudited Audited
As at As at
31 Dec 2020 30 Jun 2020
Notes $M $M
Non-current assets
Property, plant and equipment 9 6,066.5 6,060.8
Investment properties 10 2,094.0 2,042.7
Investment in associate and joint ventures 7 124.5 114.7
Derivative financial instruments 148.4 230.5
8,433.4 8,448.7
Current assets
Cash and cash equivalents 682.4 765.3
Trade and other receivables 48.7 46.2
Taxation receivable 21.0 21.6
Derivative financial instruments 12.1 15.4
764.2 848.5
Total assets 9,197.6 9,297.2
Shareholders’ equity
Issued and paid-up capital 11 1,679.2 1,678.6
Reserves 3,655.0 3,650.3
Retained earnings 1,339.9 1,308.2
6,674.1 6,637.1
Non-current liabilities
Term borrowings 12 1,684.3 1,824.4
Derivative financial instruments 119.3 134.6
Deferred tax liability 233.4 231.7
Other term liabilities 2.2 2.1
2,039.2 2,192.8
Current liabilities
Accounts payable and accruals 92.7 106.3
Derivative financial instruments 4.9 3.0
Short-term borrowings 12 382.5 320.8
Provisions 4.2 37.2
484.3 467.3
Total equity and liabilities 9,197.6 9,297.2
THE FINANCIAL STATEMENTS FOR THE SIX-MONTH PERIODS HAVE NOT BEEN AUDITED. THEY HAVE BEEN THE SUBJECT OF A REVIEW
BY THE AUDITORS PURSUANT TO NEW ZEALAND STANDARD FOR REVIEW ENGAGEMENTS 2410 (REVISED) FOR THE SIX-MONTH PERIOD
TO 31 DECEMBER 2020 AND NEW ZEALAND STANDARD FOR REVIEW ENGAGEMENTS 2410 FOR THE SIX-MONTH PERIOD TO 31 DECEMBER
2019. THE FULL-YEAR FINANCIAL STATEMENTS TO 30 JUNE 2020 HAVE BEEN AUDITED.
THE ACCOMPANYING NOTES FORM PART OF THESE FINANCIAL STATEMENTS.Consolidated interim cash flow statement
FOR THE SIX MONTHS ENDED 31 DECEMBER 2020
Unaudited Unaudited
6 months to 6 months to
31 Dec 2020 31 Dec 2019
Notes $M $M
Cash flow from operating activities
Cash was provided from:
Receipts from customers 133.8 358.6
Interest received 2.2 0.7
136.0 359.3
Cash was applied to:
Payments to suppliers and employees (71.2) (99.7)
Income tax paid - (56.3)
Interest paid (33.7) (34.3)
(104.9) (190.3)
Net cash flow from operating activities 6 31.1 169.0
Cash flow from investing activities
Cash was provided from:
Proceeds from sale of property, plant and equipment 0.1 -
Dividends from associate and joint ventures - 8.9
0.1 8.9
Cash was applied to:
Purchase of property, plant and equipment (76.2) (120.9)
Interest paid – capitalised (3.6) (6.5)
Expenditure on investment properties (32.7) (92.8)
Investment in joint ventures (6.6) (15.4)
(119.1) (235.6)
Net cash flow applied to investing activities (119.0) (226.7)
Cash flow from financing activities
Cash was provided from:
Increase in borrowings 5.0 290.0
5.0 290.0
Cash was applied to:
Decrease in borrowings - (100.0)
Dividends paid 8 - (104.4)
- (204.4)
Net cash flow from financing activities 5.0 85.6
Net (decrease)/increase in cash held (82.9) 27.9
Opening cash brought forward 765.3 37.3
Ending cash carried forward 682.4 65.2
THE FINANCIAL STATEMENTS FOR THE SIX-MONTH PERIODS HAVE NOT BEEN AUDITED. THEY HAVE BEEN THE SUBJECT OF A REVIEW
BY THE AUDITORS PURSUANT TO NEW ZEALAND STANDARD FOR REVIEW ENGAGEMENTS 2410 (REVISED) FOR THE SIX-MONTH PERIOD
TO 31 DECEMBER 2020 AND NEW ZEALAND STANDARD FOR REVIEW ENGAGEMENTS 2410 FOR THE SIX-MONTH PERIOD TO 31 DECEMBER
2019. THE FULL-YEAR FINANCIAL STATEMENTS TO 30 JUNE 2020 HAVE BEEN AUDITED.
THE ACCOMPANYING NOTES FORM PART OF THESE FINANCIAL STATEMENTS.
Interim Financial Statements 2021 7Notes and accounting policies
FOR THE SIX MONTHS ENDED 31 DECEMBER 2020
1. Corporate information
Auckland International Airport Limited (‘the The financial statements presented are for
company’ or ‘Auckland Airport’) is a company Auckland Airport and its wholly owned subsidiaries,
established under the Auckland Airport Act 1987 joint ventures and an associate (‘the group’).
and was incorporated on 20 January 1988 under
the Companies Act 1955. The company was re- These interim financial statements were authorised
registered under the Companies Act 1993 on 6 June for issue in accordance with a resolution of the
1997. The company is an FMC Reporting Entity directors on 18 February 2021.
under Part 7 of the Financial Markets Conduct Act
2013.
2. Basis of preparation and accounting policies
The interim financial statements have been prepared The accounting policies set out in the 2020 Financial
in accordance with generally accepted accounting Report have been applied consistently to all periods
practice in New Zealand and the requirements of the presented in these interim financial statements.
Financial Markets Conduct Act 2013 and the Main
Board/Debt Market Listing Rules of NZX Limited. There are no new or amended standards that are
The interim financial statements comply with New issued but not yet effective that are expected to have
Zealand Equivalent to International Accounting a material impact on the group.
Standards NZ IAS 34 and IAS 34 Interim Financial
Reporting. These financial statements are presented in New
Zealand dollars and all values are rounded to the
Auckland Airport is designated as a profit-oriented nearest million dollars ($M) and one decimal point
entity for financial reporting purposes. unless otherwise indicated.
These interim financial statements are not required
to and do not make disclosure of all of the
information required to be included in an annual
financial report. Accordingly, this report should be
read in conjunction with the financial statements and
related notes included in Auckland Airport’s
Financial Report for the year ended 30 June 2020.3. Changes in key estimates and judgements
The financial position and performance of the group Provision for expected credit losses
continued to be affected by the COVID-19 The provision for expected credit losses as at
pandemic during the period. The following key 30 June 2020 was $7.6 million. During the period
estimates and judgements, arising from COVID-19, ended 31 December 2020, the provision has
were generated on the same basis as at 30 June decreased by $3.8 million reflecting the recovery of
2020: outstanding debt.
Abatements Fair value assessments of investment properties
The group continues to provide abatements to The valuations of investment properties at 30 June
retailers, aeronautical and property tenants 2020 were prepared on the basis of 'material
significantly affected by COVID-19. During the valuation uncertainty'. The group has assessed that,
period ended 31 December 2020, the group as at 31 December 2020 there is no 'material
recognised $97.8 million of abatments as negative valuation uncertainty' for investment properties
variable lease payments. These abatements were (note 10).
consistent with expectations and were factored into
revaluations and impairment assessments at Other balance sheet assessments
30 June 2020. There have been no material changes in the
assessments of the following items disclosed in the
Fixed asset write-offs, impairment and termination 30 June 2020 financial statements:
costs
No fixed assets were written off during the period • Impairment of associate and joint ventures (note
ended 31 December 2020. 7); and
• Fair value assessments of property, plant and
At 30 June 2020, the group recognised a equipment (note 9).
$39.7 million impairment of capital works in
progress. During the period ended 31 December
2020, the group recognised a further impairment of
$0.9 million.
The provision for contract termination costs as at
30 June 2020 was $36.3 million. The group
successfully concluded negotiations with most
contractors during the period ended 31 December
2020, resulting in $18.0 million being used in
settlements, $14.9 milllion being reversed to the
income statement and $3.4 million provisions
remaining at period end.
Interim Financial Statements 2021 9Notes and accounting policies CONTINUED
FOR THE SIX MONTHS ENDED 31 DECEMBER 2020
4. Segment information
(a) Identification of reportable segments During the period ended 31 December 2020, New
The group has identified its operating segments Zealand's international border remained closed for
based on the internal reports reviewed and used by non-residents, significantly affecting airfield income
the chief executive, as the chief operating decision- and passenger services charges. Further
maker, in assessing performance and in determining information is available in the 2020 Financial Report.
the allocation of resources.
Retail
The operating segments are identified by The retail business provides services to the retailers
management based on the nature of services within the terminals and provides car parking
provided. Discrete financial information about each facilities for passengers, visitors and airport staff.
of these operating segments is reported to the chief
executive at least monthly. The chief executive The above-mentioned travel restrictions continued
assesses the performance of the operating to affect retailers within the terminals and the group
segments based on segment EBITDAFI. Interest provided $94.8 million of abatements to retailers
income and expenditure, taxation, depreciation, fair during the six-month period ended 31 December
value adjustments, and share of profits of associate 2020. Refer to note 3 for further information.
and joint ventures are not allocated to operating
segments as the group manages the cash position Property
and borrowings at a group level. The property business earns rental revenue from
space leased on airport land outside the terminals
including cargo buildings, hangars, shops and other
(b) Types of services provided
stand-alone investment properties.
Aeronautical
The aeronautical business provides services that The group provided $2.8 million of rent abatements
facilitate the movement of aircraft, passengers and to property tenants during the six-month period
cargo and provides utility services that support the ended 31 December 2020, but this was offset by
airport. The aeronautical business also earns rental new tenancies, with no material impact on total
revenue from space leased in facilities such as property rental revenue due to COVID-19 during the
terminals. period.
Aeronautical Retail Property Total
$M $M $M $M
Six months ended 31 December 2020
(unaudited)
Total segment income 52.5 21.9 51.7 126.1
Total segment expenses 18.7 5.3 8.4 32.4
Segment earnings before interest expense,
taxation, depreciation, fair value adjustments
33.8 16.6 43.3 93.7
and investments in associate and joint
ventures (EBITDAFI)
Six months ended 31 December 2019
(unaudited)
Total segment income 167.3 154.1 50.2 371.6
Total segment expenses 46.7 16.7 11.1 74.5
Segment earnings before interest expense,
taxation, depreciation, fair value adjustments
120.6 137.4 39.1 297.1
and investments in associate and joint
ventures (EBITDAFI)
Income reported above represents income generated from external customers. There was no inter-
segment income in the period (31 December 2019: nil).(c) Reconciliation of segment EBITDAFI to income statement
Unaudited Unaudited
6 months to 6 months to
31 Dec 2020 31 Dec 2019
$M $M
Segment EBITDAFI 93.7 297.1
Unallocated external operating income 5.4 3.1
Unallocated external operating expenses (10.9) (21.0)
Total EBITDAFI as per income statement 88.2 279.2
Investment property fair value increase 29.8 9.1
Derivative fair value change 0.8 (0.4)
Share of profit of associate and joint ventures 3.2 5.0
Depreciation (59.3) (55.4)
Interest expense and other finance costs (35.0) (34.7)
Profit before taxation 27.7 202.8
The income included in unallocated external operating income consists mainly of interest from third-party
financial institutions and income from telecommunication and technology services provided to tenants. The
expenses included in unallocated external operating expenses consists mainly of corporate staff expenses
and corporate legal and consulting fees.
Interim Financial Statements 2021 11Notes and accounting policies CONTINUED
FOR THE SIX MONTHS ENDED 31 DECEMBER 2020
5. Profit for the period
Unaudited Unaudited
6 months to 6 months to
31 Dec 2020 31 Dec 2019
$M $M
Staff expenses comprise:
Salaries and wages 24.5 31.4
Capitalised salaries and wages (2.8) (7.2)
Employee benefits (0.2) 2.4
Share-based payment plans 0.2 0.4
Defined contribution superannuation 0.9 0.9
Government wage subsidy (2.2) -
Other staff costs 0.6 2.7
21.0 30.6
Interest expense and other finance costs comprise:
Interest on bonds and related hedging instruments 18.5 21.3
Interest on bank facilities and related hedging instruments 9.7 6.8
Interest on USPP notes and related hedging instruments 4.5 7.1
Interest on AMTN notes and related hedging instruments 4.4 4.4
Interest on commercial paper and related hedging instruments 1.5 1.6
38.6 41.2
Less capitalised borrowing costs (3.6) (6.5)
35.0 34.7
Interest rate for capitalised borrowings costs 4.04% 3.94%
As part of its response to COVID-19, the group reduced its workforce, affecting both employees involved
in operational activities and employees whose time is predominantly capitalised to capital expenditure
projects. Salaries and wages have previously been disclosed net of the capitalised amounts. To improve
transparency and illustrate the impact of fewer project oriented employees and less time capitalised to
projects, ‘capitalised salaries and wages’ has been disaggregated from ‘salaries and wages’ in both the
current and comparative periods.
The interest expense amounts disclosed in the table above are net of the impact of interest rate hedges.
The gross interest costs of bonds, bank facilities, USPP, AMTN and commercial paper, excluding the
impact of interest rate hedges, was $35.1 million for the period ended 31 December 2020 (31 December
2019: $41.0 million).6. Reconciliation of profit after taxation with cash flow from operating
activities
Unaudited Unaudited
6 months to 6 months to
31 Dec 2020 31 Dec 2019
$M $M
Profit after taxation 28.1 147.2
Adjustments for:
Depreciation 59.3 55.4
Deferred taxation expense (1.5) 2.2
Fixed asset impairment 0.9 -
Reversal of fixed asset termination costs (14.9) -
Share-based payments 0.2 0.4
Equity-accounted earnings from associate and joint ventures (3.2) (5.0)
Investment property fair value increase (29.8) (9.1)
Derivative fair value (increase)/decrease (0.8) 0.4
Items not classified as operating activities:
Loss on asset disposals 0.5 -
Decrease/(increase) in property, plant and equipment retentions and
payables 34.9 (10.4)
Decrease/(increase) in investment property retentions and payables 5.0 (0.1)
Items recognised directly in equity 0.8 -
Movement in working capital:
(Increase) in trade and other receivables (2.5) (22.0)
Decrease in taxation receivable/(payable) 0.6 (2.9)
(Decrease)/increase in accounts payable and provisions (46.6) 13.0
Increase/(decrease) in other term liabilities 0.1 (0.1)
Net cash flow from operating activities 31.1 169.0
Interim Financial Statements 2021 13Notes and accounting policies CONTINUED
FOR THE SIX MONTHS ENDED 31 DECEMBER 2020
7. Associate and joint ventures
Movement in the group’s carrying amount of investments in associate and joint ventures:
Unaudited Unaudited
6 months to 6 months to
31 Dec 2020 31 Dec 2019
$M $M
Movement in investment in associate and joint ventures continuing
Investment in associate and joint ventures at the beginning of the period 114.7 105.7
Further investment in joint ventures 6.6 15.4
Share of profit after tax of associate and joint ventures 3.2 5.0
Share of dividends received and repayment of partner contribution - (8.9)
Investment in associate and joint ventures at the end of the period 124.5 117.2
Carrying value of investments in associate and joint ventures:
Unaudited Audited
As at As at
31 Dec 2020 30 Jun 2020
$M $M
Investment in associate and joint ventures continuing
Tainui Auckland Airport Hotel Limited Partnership 23.1 20.5
Tainui Auckland Airport Hotel 2 Limited Partnership 28.3 21.7
Queenstown Airport Corporation Limited 73.1 72.5
Total 124.5 114.7
8. Distribution to shareholders
Unaudited Unaudited
6 months to 6 months to
31 Dec 2020 31 Dec 2019
Dividend payment date $M $M
2019 final dividend of 11.25 cps 18 October 2019 - 136.3
2020 final dividend N/A - -
As part of the capital restructure undertaken in April 2020 in response to COVID-19, Auckland Airport
agreed financial covenant waivers with its bank lenders and USPP noteholders and agreed that no
dividends will be paid while those waivers are in effect. Hence no final dividend was paid during the period
ended 31 December 2020 (31 December 2019, $104.4 million dividends paid in cash and $31.9 million of
dividends reinvested).
The company has a dividend reinvestment plan, but this was inactive during the period as no dividend was
paid.9. Property, plant and equipment
Unaudited Audited
As at As at
31 Dec 2020 30 Jun 2020
$M $M
At fair value 5,719.2 5,675.2
At cost 214.7 202.1
Work in progress at cost 381.1 372.8
Accumulated depreciation (248.5) (189.3)
Net carrying amount 6,066.5 6,060.8
The group carries land, buildings and services, Vehicles, plant and equipment and work in progress
infrastructure and runway, taxiways and aprons at are carried at cost.
fair value.
Additions to property, plant and equipment were
At 31 December 2020 and 31 December 2019 the $57.2 million for the six months ended 31 December
group undertook a desktop review of the property, 2020 (six months ended 31 December 2019:
plant and equipment balances carried at fair value. $135.1 million).
For assets valued using the discounted cash flow
approach, the 31 December 2020 desktop Transfers from investment property were
assessment considered expectations of the timing $8.4 million for the six months ended 31 December
and shape of the recovery from COVID-19, which 2020 (six months ended 31 December 2019:
remains uncertain. The changes since the last $1.2 million). The transfers in both the current and
valuations at 30 June 2020 include the expected comparative periods were to make land available for
delay in establishing quarantine free travel, offset by the international terminal exit road.
positive strides in vaccine development and rollout.
For assets valued using the optimised depreciated The following categories of property, plant and
replacement cost approach, the assessment equipment are leased to tenants:
considered movements in the capital goods price
index provided by Beca Projects NZ Ltd (Beca). For • Aeronautical land, including land associated
assets valued using the market value alternative use with aircraft, freight and terminal use carried at
and direct sales comparison approaches, the $216.0 million (30 June 2020: $216.0 million);
assessment considered the outcome of the • Land associated with retail facilities within
investment property desktop review described in terminal buildings carried at $1,667.5 million
note 10. These assessments indicated that there (30 June 2020: $1,667.5 million); and
was no material fair value movement in property,
plant and equipment from 30 June 2020. • Space within terminal buildings, being 13% of
total floor area or $123.2 million (30 June 2020:
Impact of COVID 19 13% of total floor area or $113.7 million).
The impact as at 30 June 2020 of COVID 19 on the
valuation of property, plant and equipment was set
out in note 11 of the 2020 Financial Report. Given
the circumstances, all of the valuations as at 30 June
2020, except for reclaimed land, were prepared on
the basis of “significant market uncertainty” or
“material valuation uncertainty”, and therefore the
valuers advised that less certainty should be
attached to their valuations than would normally be
the case. Due to the ongoing impacts of COVID-19,
including the considerable uncertainty as to the
timing and shape of the recovery, the group and its
valuers consider that the carrying values remain
subject to 'significant market uncertainty' or
'material valuation uncertainty'.
Interim Financial Statements 2021 15Notes and accounting policies CONTINUED
FOR THE SIX MONTHS ENDED 31 DECEMBER 2020
10. Investment properties
Unaudited Audited
6 months to 12 months to
31 Dec 2020 30 Jun 2020
$M $M
Balance at the beginning of the period 2,042.7 1,745.4
Additions 29.9 138.6
Transfer to property, plant and equipment (note 9) (8.4) (9.5)
Write-offs - (0.4)
Change in net revaluations 29.8 168.6
Balance at the end of the period 2,094.0 2,042.7
Investment property is measured at fair value, which At 31 December each year, Auckland Airport also
reflects market conditions at balance date. To reviews investment properties that are recently
determine fair value, Auckland Airport commissions constructed or in the latter stages of construction.
investment property valuations at 30 June each year At 31 December 2020, a review of two new
and undertakes a desktop review at 31 December investment properties was performed by Colliers.
each year.
The valuation of these two investment properties
At 31 December 2020 and 31 December 2019, resulted in a $29.8 million increase in the fair value
desktop reviews were performed by at 31 December 2020 (31 December 2019:
Auckland Airport which comprised a review of $9.1 million increase resulting from the valuation of
recent comparable transactional evidence of market four investment properties either recently
sales and leasing activity using market data constructed or in the latter stages of construction).
provided by Colliers. The reviews did not include full
property inspections or the issue of new valuation The following categories of investment property are
reports but examined the likely effect on property leased to tenants:
values relevant to Auckland Airport’s investment
property portfolio. The reviews indicated that there • Retail and service carried at $323.0 million
was no material fair value movement in the overall (30 June 2020: $279.1 million);
investment property portfolio between 30 June and • Industrial carried at $1,295.7 million (30 June
31 December 2020. 2020: $1,240.9 million); and
Impact of COVID-19 • Other investment property carried at
As reported in the 2020 Financial Report, the $164.3 million (30 June 2020: $192.5 million).
group's overall investment property portfolio has
remained stable despite COVID-19. There has been
no material change in circumstances since 30 June
2020 and the portfolio continues to be supported
by high quality tenants, with long leases in industrial
properties. Although the group provided $2.8 million
of rent abatements to property tenants during the
six-month period, these were consistent with
expectations at 30 June 2020. There was no
material impact on overall property rental revenue
during the period (refer to notes 3 and 4 for further
information).
The group has assessed that, as at 31 December
2020, there is no 'material valuation uncertainty' for
investment properties. This assessment is based on
the aforementioned market data provided by
Colliers and the continued stability of the investment
property portfolio since 30 June 2020.11. Issued and paid-up capital and earnings per share
Unaudited Unaudited Unaudited Unaudited
6 months to 6 months to 6 months to 6 months to
31 Dec 2020 31 Dec 2019 31 Dec 2020 31 Dec 2019
$M $M Shares Shares
Opening issued and paid-up capital1 1,678.6 468.2 1,471,916,791 1,210,674,696
Shares fully paid and allocated to
employees by employee share scheme 0.3 0.1 52,400 10,300
Shares vested to employees participating
in long-term incentive plans 0.3 0.2 61,546 89,379
Shares issued under the dividend
reinvestment plan - 31.9 - 3,620,888
Closing issued and paid-up capital1 1,679.2 500.4 1,472,030,737 1,214,395,263
1 During April 2020, the company issued an additional 257,510,728 shares as part of a $1.2 billion capital
raise (refer to the 2020 Financial Report for further details).
Earnings per share
The earnings used in calculating basic and diluted earnings per share is net profit attributable to equity
holders of $28.1 million (31 December 2019: $147.2 million).
The weighted average number of shares used to calculate basic and diluted earnings per share is as follows.
Unaudited Restated
6 months to 6 months to
31 Dec 2020 31 Dec 2019
Shares Shares
For basic earnings per share 1,471,966,206 1,229,278,684
Effect of dilution of share options - -
For diluted earnings per share 1,471,966,206 1,229,278,684
The company has restated the prior period basic and diluted earnings per share to reflect the small dilution
that arose because the new shares issued at $4.66 under both the institutional share placement on 15 April
2020 and the share purchase plan on 1 May 2020 were priced at a 7.5% discount to the $5.04 closing
price on the NZX on 3 April 2020, immediately before the equity raise was announced. Technically, the
extra shares allotted because of the issue discount versus the number required if there was no discount is
referred to as the “implied bonus” element. The prior period comparatives have been adjusted downwards
to reflect those extra bonus shares. There is no adjustment required for the current period.
The reported basic and diluted earnings per share for the six months ended 31 December 2020 is
1.91 cents (six months ended 31 December 2019: 11.97 cents).
Interim Financial Statements 2021 17Notes and accounting policies CONTINUED
FOR THE SIX MONTHS ENDED 31 DECEMBER 2020
12. Borrowings
Unaudited Audited
As at As at
31 Dec 2020 30 Jun 2020
$M $M
Current
Commercial paper 91.9 91.9
Bonds 150.0 150.0
USPP notes 140.6 78.9
Total short-term borrowings 382.5 320.8
Non-current
Bank facilities 210.0 205.0
Bonds 675.0 675.0
USPP notes 471.5 613.5
AMTN notes 327.8 330.9
Total term borrowings 1,684.3 1,824.4
Total
Commercial paper 91.9 91.9
Bank facilities 210.0 205.0
Bonds 825.0 825.0
USPP notes 612.1 692.4
AMTN notes 327.8 330.9
Total borrowings 2,066.8 2,145.2
In the six-month period to 31 December 2020, the company did not issue or repay any bonds or notes but
did draw down $5 million on existing bank facilities.
The financial covenant waivers, granted by bank and USPP lenders remain in place until December 2021
(inclusive). During the current and prior periods, there were no defaults or breaches on any of the borrowing
facilities.
The carrying amount of USPP and AMTN notes has reduced due to foreign exchange rate movements. The
foreign currency exposure is fully hedged by cross-currency interest rate swaps, which have similarly
reduced in value (refer to note 14).13. Financial risk management
The group has a treasury policy which limits Further information on risk management is
exposure to market risk for changes in interest rates contained in the corporate governance section of
and foreign currency, liquidity risk and counter-party the 2020 Financial Report.
credit risk. The group has no other material direct
price risk exposure. There have been no significant changes in the
financial risk management objectives and policies
The interim financial statements do not include all since 30 June 2020.
financial risk management information and
disclosures and should be read in conjunction with
note 18 of the 2020 Financial Report.
14. Fair value of financial instruments
There have been no transfers between levels of the Borrowings issued at fixed rates, including bonds,
fair value hierarchy used in measuring the fair value USPP notes and AMTN notes, are also carried at
of financial instruments in the period to amortised cost, which differs from their fair value.
31 December 2020 (30 June 2020: nil). The fair values are shown in the table below for
comparative purposes and are determined as
The following financial instruments are carried at follows:
amortised cost, which approximates their fair value:
• The group’s bonds are classified as level 1. The
• Cash; fair value of the bonds is based on the quoted
• Trade and other receivables; market prices for these instruments at balance
date;
• Accounts payable and accruals;
• The group’s USPP notes are classified as level
• Other term liabilities; and 2. The fair value of the USPP notes has been
• Borrowings issued at floating rates. determined at balance date on a discounted
cash flow basis using the USD Bloomberg
curve and applying discount factors to the
future USD interest payment and principal
payment cash flows; and
• The group’s AMTN notes are classified as level
2. The fair value of the AMTN notes has been
determined at balance date on a discounted
cash flow basis using the AUD Bloomberg
curve and applying discount factors to the
future AUD interest payment and principal
payment cash flows.
Unaudited Audited
31 Dec 2020 30 Jun 2020
Carrying Fair Carrying Fair
amount value amount value
$M $M $M $M
Bonds 825.0 873.4 825.0 878.9
USPP notes 612.1 625.3 692.4 697.3
AMTN notes 327.8 326.8 330.9 316.0
Interim Financial Statements 2021 19Notes and accounting policies CONTINUED
FOR THE SIX MONTHS ENDED 31 DECEMBER 2020
14. Fair value of financial instruments CONTINUED
The group’s derivative financial instruments are carried at fair value and are classified as level 2. The fair
values are determined on a discounted cash flow basis. The future cash flows are forecast using the key
inputs presented in the table below. The forecast cash flows are discounted at a rate that reflects the
credit risk of both counterparties to the derivative financial instruments.
Unaudited Audited
Fair value Fair value
As at As at
31 Dec 2020 30 Jun 2020
$M $M Valuation key inputs
Interest rate swaps Forward interest rates (from observable yield
curves) and contract interest rates
Liabilities (124.2) (137.6)
Interest basis swaps Observable forward basis swap pricing and
contract basis rates
Assets 1.1 1.2
Cross-currency interest Forward interest and foreign exchange rates
rate swaps (from observable yield curves and forward
exchange rates) and contract rates
Assets 159.4 244.8
15. Commitments
(a) Property, plant and equipment (b) Investment property
The group had contractual obligations to purchase The group had contractual obligations to purchase,
or develop property, plant and equipment for develop, repair or maintain investment property for
$37.1 million at 31 December 2020 (30 June 2020: $64.9 million at 31 December 2020 (30 June 2020:
$91.9 million). $64.6 million).16. Contingent liabilities
Noise insulation confirm which dwellings and schools are eligible for
noise mitigation each year and offers are sent out to
Auckland Airport Designation 1100, contained in the those affected properties. It is at the discretion of
Auckland Unitary Plan, sets out the requirements for individual landowners whether they accept a noise
noise mitigation for neighbouring properties affected mitigation package.
by aircraft noise. The conditions include obligations
on the company to mitigate the impact of aircraft Projections are undertaken annually to determine
noise through the installation of noise mitigation eligibility, and the rate of acceptance of offers of
packages to existing dwellings and schools. The treatment by landowners is variable. However, it is
noise mitigation packages provide treatment of estimated that further costs on noise mitigation
dwellings to achieve an internal noise environment should not exceed $8.1 million (30 June 2020:
of no more than 40dB. The company is required to $8.2 million).
subsidise 100% of treatment costs for properties in
the high aircraft noise area and 75% in the medium
Contractor claims
aircraft noise area.
A contingent liability of $11.6 million (30 June 2020:
The aircraft noise contours included in Designation $10.4 million) is estimated for contractor claims in
1100 reflect the long-term predicted aircraft noise respect of capital works which are under ongoing
levels generated by aircraft operations from the independent assessment of both entitlement and
existing runway and proposed northern runway. value. The group has taken a highly conservative
Annually, the company projects the level of noise view by including all known uncertified contractor
that will be generated from aircraft operations for the claims as part of this estimate.
following 12 months. These annual projections
17. Events subsequent to balance date
On 12 February 2021, the directors of Queenstown Airport resolved that no interim dividend would be
declared for the period ended 31 December 2020.
On 17 February 2021, the directors of Auckland Airport resolved that no interim dividend would be declared
for the period ended 31 December 2020.
Interim Financial Statements 2021 21INDEPENDENT AUDITOR’S REVIEW REPORT TO THE SHAREHOLDERS OF AUCKLAND INTERNATIONAL AIRPORT LIMITED Conclusion We have reviewed the condensed consolidated interim financial statements (‘interim financial statements’) of Auckland International Airport Limited (‘the Company’) and its subsidiaries (‘the Group’) which comprise the consolidated interim statement of financial position as at 31 December 2020, and the consolidated interim income statement, statement of comprehensive income, statement of changes in equity and cash flow statement for the six months ended on that date, and a summary of significant accounting policies and other explanatory information on pages 2 to 21. Based on our review, nothing has come to our attention that causes us to believe that the interim financial statements of the Group do not present fairly, in all material respects, the financial position of the Group as at 31 December 2020 and its financial performance and cash flows for the period ended on that date in accordance with NZ IAS 34 Interim Financial Reporting and IAS 34 Interim Financial Reporting. Emphasis of Matter – Significant market uncertainty or material valuation uncertainty related to the carrying values of property, plant and equipment We draw your attention to note 9 in the condensed consolidated interim financial statements, where the Group discloses that due to the ongoing impacts of COVID-19, including the considerable uncertainty as to the timing and shape of the recovery, the Group and its independent registered valuers consider that the carrying values of the property, plant and equipment, except for reclaimed land, remain subject to “significant market uncertainty” or “material valuation uncertainty” as at 31 December 2020 and therefore less certainty should be attached to the valuations than would normally be the case. Our opinion is not modified in respect of this matter. Basis for Conclusion We conducted our review in accordance with NZ SRE 2410 (Revised) Review of Financial Statements Performed by the Independent Auditor of the Entity (‘NZ SRE 2410 (Revised)’). Our responsibilities are further described in the Auditor’s Responsibilities for the Review of the Interim Financial Statements section of our report. We are independent of the Group in accordance with the relevant ethical requirements in New Zealand relating to the audit of the annual financial statements, and we have fulfilled our other ethical responsibilities in accordance with these requirements. Our firm carries out other assignments for Auckland International Airport Limited in the area of taxation advice, AGM vote scrutineering assistance and assurance reporting for regulatory purposes. These services have not impaired our independence as auditor of the Group. In addition to this, partners and employees of our firm deal with the Group on normal terms within the ordinary course of trading activities of the business of the Group. The firm has no other relationship with, or interest in, the Group. Directors’ responsibilities for the interim financial statements The directors are responsible on behalf of the Company for the preparation and fair presentation of the interim financial statements in accordance with NZ IAS 34 Interim Financial Reporting and IAS 34 Interim Financial Reporting and for such internal control as the directors determine is necessary to enable the preparation and fair presentation of the interim financial statements that are free from material misstatement, whether due to fraud or error. Auditor’s responsibilities for the review of the interim financial statements Our responsibility is to express a conclusion on the interim financial statements based on our review. NZ SRE 2410 (Revised) requires us to conclude whether anything has come to our attention that causes us to believe that the interim financial statements, taken as a whole, are not prepared, in all material respects, in accordance with NZ IAS 34 Interim Financial Reporting and IAS 34 Interim Financial Reporting. A review of the interim financial statements in accordance with NZ SRE 2410 (Revised) is a limited assurance engagement. We perform procedures, primarily consisting of making enquiries, primarily of persons responsible for financial and accounting matters, and applying analytical and other review procedures. The procedures performed in a review are substantially less than those performed in an audit conducted in accordance with International Standards on Auditing (New Zealand) and consequently do not enable us to obtain assurance that we might identify in an audit. Accordingly we do not express an audit opinion on the interim financial statements.
Restriction on use
This report is made solely to the company’s shareholders, as a body. Our review has been undertaken so that we
might state to the company’s shareholders those matters we are required to state to them in a review report and
for no other purpose. To the fullest extent permitted by law, we do not accept or assume responsibility to anyone
other than the company’s shareholders as a body, for our engagement, for this report, or for the conclusions we
have formed.

Andrew Dick
Partner
for Deloitte Limited
Auckland, New Zealand
18 February 2021

                                                                           Interim Financial Statements 2021        23
You can also read