Method matters: pitfalls in analyzing phenology from occurrence records
←
→
Page content transcription
If your browser does not render page correctly, please read the page content below

Posted on Authorea 7 Jan 2021 | The copyright holder is the author/funder. All rights reserved. No reuse without permission. | https://doi.org/10.22541/au.161001475.56669645/v1 | This a preprint and has not been peer reviewed. Data may be preliminary.
Method matters: pitfalls in analyzing phenology from occurrence
records
Elise Larsen1 and Vaughn Shirey1
1
Georgetown University
January 7, 2021
Abstract
Large occurrence datasets provide a sizable resource for ecological analyses, but have substantial limitations. Phenological
analyses in Fric et al. (2020) were misleading due to inadequate curation and improper statistics. Our reanalysis of 22 univoltine
species with sufficient data for independent analysis found substantive differences in macroscale phenological patterns.
Method matters: pitfalls in analyzing phenology from occurrence records
Running title: Caution needed in GBIF phenological analyses
Elise A. Larsen1 , Vaughn Shirey1
1
Georgetown University, Department of Biology; Washington, DC
Email: Elise A. Larsen: eal109@georgetown.edu; Vaughn Shirey: vms55@georgetown.edu
Keywords: phenology, presence-only, GBIF, bias, spatiotemporal bias, Lepidoptera, butterfly, flight period,
latitude
Type of article: technical comment
Number of words in abstract: 49
Number of words in main text: 800
Number of references: 13
Number of figures: 2 + 1 supplemental
Number of tables: 0 main text + 2 supplemental
Corresponding author:
Elise A. Larsen, eal109@georgetown.edu, 412-519-4426 (phone), 202-687-5662 (fax)
Box 571229 Reiss Science Bldg., Room 406, 37th and O Streets, NW Washington DC 20057
Statement of authorship: EAL conceived of the comment and designed the reanalysis. VS collated trait
data and performed reanalysis. EAL and VS wrote and revised the manuscript together.
Data accessibility statement: No new occurrence data were used; only the data file provided in
Fric et al. (2020) supplemental files (https://doi.org/10.1111/ele.13419). Voltinism data and sources are
provided in Supplemental Table 1. All data and code used in this reanalysis are available on github
athttps://github.com/RiesLabGU/Larsen-Shirey2020_EcoLettersComment.
1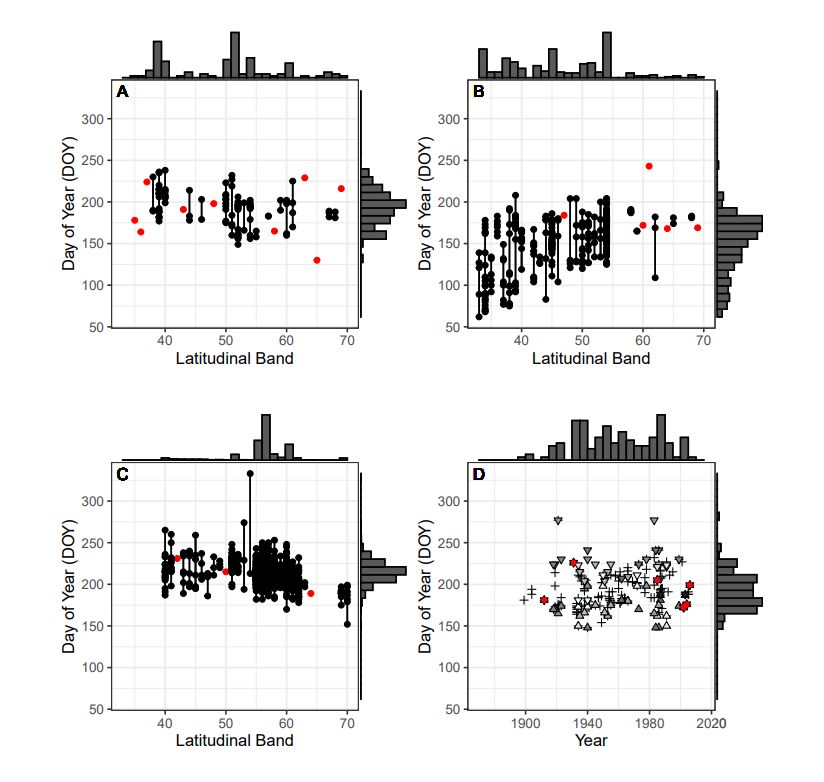
Abstract:
Large occurrence datasets provide a sizable resource for ecological analyses, but have substantial limitations.
Posted on Authorea 7 Jan 2021 | The copyright holder is the author/funder. All rights reserved. No reuse without permission. | https://doi.org/10.22541/au.161001475.56669645/v1 | This a preprint and has not been peer reviewed. Data may be preliminary.
Phenological analyses in Fric et al. (2020) were misleading due to inadequate curation and improper statis-
tics. Our reanalysis of 22 univoltine species with sufficient data for independent analysis found substantive
differences in macroscale phenological patterns.
Main Body:
The aggregation of large datasets from museum records and community science provides a valuable resource
for macroscale ecological analyses. However, such data include spatiotemporal and taxonomic biases that
must be addressed (Troudet et al. 2017; Ries et al. 2019). Given these biases, proper data curation and
appropriate modelling strategies are necessary to ensure valid inferences.
Fric et al. 2020 used occurrence data for 100 species aggregated in the Global Biodiversity Information
Facility (GBIF) in temperate regions of North America and Europe to track phenology across latitudes.
Estimating phenology metrics and trends from large occurrence datasets is possible, but requires sufficient
data density and appropriate statistical methods (Taylor and Guralnick 2017). The data from this study were
frequently too sparse and insufficiently curated to estimate phenological patterns across latitudes. Further,
using regression of residuals resulted in spurious patterns; after correcting for altitude and year, onset and
termination phenology appeared the same at low and high latitudes for most species, contrary to previous
findings (Karlsson 2014, Matechou et al. 2014). We show that applying appropriate data curation and
methods, most species demonstrated later onset and shorter flight periods at higher latitudes.
Many species analyzed (in 105 datasets separated by continent) in Fric et al. (2020) had insufficient data for
independent analysis. Data were analyzed with as few as 15 occurrence records across >20 degrees latitude
and >100 years. Phenological “onset” and “termination” of flight periods were extracted simply as the first
and last day-of-year (DOY) values within latitudinal bands, pooled across all years and altitudes. Pooling
data increased spatiotemporal bias, lowered the resulting power to detect patterns, and resulted in only one
observation date being used as both “onset” and “termination” of flight periods (resulting in one-day flight
periods and “peak flight”) in an average of 20% of latitudinal bands per species (Figure 1).
Fric et al.’s data curation was inadequate regarding spatial precision and outlier detection. Altitudes were
extracted using imprecise GIS coordinates, sometimes representing sea floor or vague place names (eg, ”Mt
Shasta”) and skewed left, giving high altitude observations outsized leverage in regressions. Temporal outliers
were problematic; one species’ onset at 68° N was in January, when the next occurrence across all latitudes was
in June. No sources were cited for species traits, and we found evidence documenting additional generations
in portions of their range for 22 species identified as obligate univoltine (Supplemental Table 1).
Finally, the analytical approach in Fric et al. (2020) produced biased results. Beyond regressing individual
species’ phenometrics against latitude, altitude, and year separately, regression of residuals was used for
corrected regressions. This resulted in biased parameter estimates due to collinearity among explanatory
variables and reduced statistical significance (Freckleton 2002). Results suggested most species’ onset (67
datasets) and termination (71 datasets) were similar across latitudes (Figure 2). These results were surprising,
considering well-documented delayed and/or shortened flight periods at high latitudes (Karlsson 2014).
We sought to validate those results with a more robust analysis, applying stricter data standards and curation.
For 72 species (76 datasets) we confirmed as univoltine, we filtered data for altitude (0-500m) and timing
(March-November). We calculated phenometrics for year-latitude combinations with at least 10 observations.
Only 22 datasets, all European, met these requirements in at least three latitudinal bands (Supplemental
Table 1). For these, onset and termination were estimated from a Weibull distribution using R package phest
(Pearse 2017) and bounded by days (60,330). To estimate unbiased parameters, we modeled each species
phenometric using multiple regression (DOY ~ latitude + year) using R version 3.6.2 (R Core Team 2019).
We compared our results to those from Fric et al. Supplemental Table 2.
We were unable to validate most patterns reported in the original study. Our results varied substantially in
2both onset and termination across species (Figure 2). In contrast to Fric et al. (2020), we found significantly
later and/or shorter flight periods at higher latitudes for most species. These new results were consistent
with the latitudinal gradient in climate and growing season length (Kobayashi et al. 2016). This evidence of
Posted on Authorea 7 Jan 2021 | The copyright holder is the author/funder. All rights reserved. No reuse without permission. | https://doi.org/10.22541/au.161001475.56669645/v1 | This a preprint and has not been peer reviewed. Data may be preliminary.
inaccurate phenological patterns also discredits Fric et al.’s downstream trait analyses.
Despite this critique, we recognize that occurrence data have great potential to address many ecological
questions. New aggregations of large datasets provide valuable inputs for macroscale ecological research,
and the sheer amount of data accumulated across time and space may provide statistical power. However,
“with great power must come great responsibility” (Lee 1962); robust scientific inference requires careful data
curation and robust analytical models. Other phenology metrics are less confounded by abundance and effort
(Belitz et al. 2020); integrated community models with random species effects or informed priors better suit
community phenological analyses (Ellwood et al. 2012). We enthusiastically support continued digitization
and use of collection data in ecological analysis, but urge researchers to exercise caution when using these
data.
Acknowledgements
We appreciate the many collections, programs, and citizen scientists contributing data to GBIF which were
used here. We are grateful to Dr. Leslie Ries, Dr. Mariana Abarca, Dr. Gina Wimp, Grace Jeschke, and
two anonymous reviewers for providing comments improving this manuscript. We thank Dr. Fric for openly
discussing their work with us. This work was supported by the National Science Foundation Award EF-
1702664. V.S. received support from Georgetown University.
References
Belitz, M. W., Larsen, E. A., Ries, L., & Guralnick, R. P. (2020). The accuracy of phenology estimators
for use with sparsely sampled presence-only observations (preprint). In press at Methods in Ecology and
Evolution.https://doi.org/10.1111/2041-210X.13448
Ellwood, E. R., Diez, J. M., Ibánez, I., Primack, R. B., Kobori, H., Higuchi, H., & Silander, J. A. (2012).
Disentangling the paradox of insect phenology: are temporal trends reflecting the response to warming?.
Oecologia, 168(4), 1161-1171.https://doi.org/10.1007/s00442-011-2160-4
Freckleton, R. P. (2002). On the misuse of residuals in ecology: regression of residuals vs. multiple regression.
Journal of Animal Ecology, 71(3), 542-545.https://doi.org/10.1046/j.1365-2656.2002.00618.x
Fric, Z. F., Rindoš, M., & Konvička, M. (2020). Phenology responses of temperate butterflies to latitude
depend on ecological traits. Ecology letters, 23(1), 172-180.https://doi.org/10.1111/ele.13419
Karlsson, B. (2014). Extended season for northern butterflies.International journal of biometeorology , 58
(5), 691-701.https://doi.org/10.1007/s00484-013-0649-8
Kobayashi, H., Yunus, A. P., Nagai, S., Sugiura, K., Kim, Y., Van Dam, B., Nagano, H., Zona, D., Harazono,
Y., Bret-Harte, M. S., Ichii, K., Ikawa, H., Iwara, H., Oechel, W. C., Ueyama, M., & Suzuki, R. (2016).
Latitudinal gradient of spruce forest understory and tundra phenology in Alaska as observed from satellite and
ground-based data. Remote Sensing of Environment, 177, 160-170.https://doi.org/10.1016/j.rse.2016.02.020
Lee, S. (1962) Amazing Fantasy #15, Marvel.
Matechou, E., Dennis, E. B., Freeman, S. N., & Brereton, T. (2014). Monitoring abundance and phenol-
ogy in (multivoltine) butterfly species: a novel mixture model.Journal of Applied Ecology , 51 (3), 766-
775.https://doi.org/10.1111/1365-2664.12208
Pearse, W. D., Davis, C. C., Inouye, D. W., Primack, R. B., & Davies, T. J. (2017). A statistical estimator
for determining the limits of contemporary and historic phenology. Nature Ecology & Evolution, 1(12),
1876-1882.https://doi.org/10.1038/s41559-017-0350-0
3R Core Team (2019). R: A language and environment for statistical computing. R Foundation for Statistical
Computing, Vienna, Austria. URLhttps://www.R-project.org/
Posted on Authorea 7 Jan 2021 | The copyright holder is the author/funder. All rights reserved. No reuse without permission. | https://doi.org/10.22541/au.161001475.56669645/v1 | This a preprint and has not been peer reviewed. Data may be preliminary.
Ries, L., Zipkin, E. F., & Guralnick, R. P. (2019). Tracking trends in monarch abundance over the 20th
century is currently impossible using museum records. Proceedings of the National Academy of Sciences,
116(28), 13745-13748.https://doi.org/10.1073/pnas.1904807116
Taylor, S.D., & Guralnick, R.P., (2019). Opportunistically collected photographs can be used to estimate
large-scale phenological trends (preprint).https://doi.org/10.1101/794396
Troudet, J., Grandcolas, P., Blin, A., Vignes-Lebbe, R., & Legendre, F. (2017). Taxonomic bias in biodi-
versity data and societal preferences. Scientific Reports, 7(9132), 1-14.https://doi.org/10.1038/s41598-017-
09084-6
Figure 1:
Figure 2:
4Posted on Authorea 7 Jan 2021 | The copyright holder is the author/funder. All rights reserved. No reuse without permission. | https://doi.org/10.22541/au.161001475.56669645/v1 | This a preprint and has not been peer reviewed. Data may be preliminary.
Figure 1 Caption:
Raw occurrence data used in the Fric et al. (2020) analysis and flight period lengths by latitude for 3
datasets (A: Agriades glandon in N. America, B:Glaucopsyche lygdamus in N. America, C: Hesperia comma
in Europe) and year for 1 dataset (D: Parnassius smintheus in N. America). Results for these species were
presented in Fric et al. (2020) Figure 1 to demonstrate varied phenological patterns. Red points represent
observations used as both onset and termination. Marginal histograms show data density across latitudes
(above the plot) and time of year (to the right of the plot). Because onset and termination analyses
used only one day of year (DOY, calculated as SuccDay) per latitudinal band, panel D identifies onset
() andtermination(V )observations(f illcoloredbylatitudewheredarkercolorsrepresenthigherlatitudes)inadditiontoallobserva
Figure 2 Caption:
Comparison of model parameters for onset (panels A, B, C) and termination (panels D, E, F) dates as a
function of latitude. Panels A and D show latitude coefficients for 22 species onset and termination phenology.
Values extracted from Fric et al. (2020) Supplemental Table 2 using regression of residuals against latitude,
corrected for year and altitude, are shown as squares. Circles are parameters from the reanalysis. Filled
symbols indicate significant slopes with latitude. Panels B and E show values and boxplots of the model
coefficients for DOY ~ latitude, colored by response: positive (green), non-significant (gray), or negative
(blue) correlations. Panels C and F are stacked barplots of the response signs representing the number of
datasets demonstrating positive (green), non-significant (gray), or negative (blue) correlations with latitude.
Panels B, C, E, and F show four sets of model results extracted from Fric et al. Supplemental Table 2,
and one set of reanalysis results. For Fric et al. (2020) results, “SR” represents single regressions for DOY
~ latitude, while “RR” represents regression of residuals against latitude, corrected for altitude and year.
“SR-105” and “RR-105” show results for all 105 datasets in the original analysis, while “SR-22” and “RR-22”
only include results for the 22 species-region datasets used in our reanalysis. “New” shows results from our
curation and reanalysis of those 22 species-region datasets. See Supplemental Figure 1 for a comparison of
species-specific data and results.
Supplemental Figure 1 Caption:
These panels display the data and regression results for onset and termination across models.
Each row of 3 panels represents a species in the re-analysis. In the left column, all raw oc-
currence data are shown as “+” while onset and termination are shown as ?; red points indi-
cate individual observations used as both onset and termination. Fric et al.’s single regression
results of DOY ~ latitude for onset and termination are overlaid on the data. In the middle
5column, the residuals used in the Fric et al. (2020) regression of residuals are shown for onset
() andtermination(V ), respectively, withredindicatingrecordsof observationsusedasbothonsetandtermination.Becauseeachd
signif icant(black, dotted), ornegative(blue, dashed)correlationswithlatitudeinthecorrespondingmodels.W hiletheF ricetal.a
Posted on Authorea 7 Jan 2021 | The copyright holder is the author/funder. All rights reserved. No reuse without permission. | https://doi.org/10.22541/au.161001475.56669645/v1 | This a preprint and has not been peer reviewed. Data may be preliminary.
0.05f orthef ollowingsingleregressionanalyses : E. maturnaonsetandL. virgaureaetermination.
B C
A Thymelicus lineolus
0
Onset ~ Latitude coefficient
# species by response sign
Maniola jurtina
Lycaena virgaureae 10
Lycaena hippothoe
Limenitis populi 5
Glaucopsyche alexis
Euphydryas maturna 75
Erebia ligea
Colias palaeno
Coenonympha tullia
Carterocephalus palaemon
Brenthis ino 50
Boloria eunomia
Boloria aquilonaris 0
Aricia artaxerxes
Argynnis paphia 25
Argynnis niobe
Argynnis aglaja
Argynnis adippe
Aporia crataegi 0
Aphantopus hyperantus
Anthocharis cardamines
5 05 2 2 05 05 −2
2
−2
2 w
−1
0
−1 −2 −2 Ne
w −1 −1 SR RR Ne
−4 −2 0 2 4 6 8
SR RR SR RR SR RR
Latitude coefficient
D E F
Termination ~ Latitude coefficient
Thymelicus lineolus 0
# species by response sign
Maniola jurtina
Lycaena virgaureae
10
Lycaena hippothoe 2.5
Limenitis populi
Glaucopsyche alexis
Euphydryas maturna 75
Erebia ligea
Colias palaeno 0.0
Coenonympha tullia
Carterocephalus palaemon
Brenthis ino 50
.5
Boloria eunomia −2
Boloria aquilonaris
Aricia artaxerxes
Argynnis paphia
.0 25
Argynnis niobe
Argynnis aglaja −5
Argynnis adippe
Aporia crataegi 0
Aphantopus hyperantus .5
Anthocharis cardamines −7
10
5 05 −2
2
−2
2 w 05 10
5
−2
2
−2
2 w
R− −1 SR RR Ne −1 − Ne
−6 −4 −2 0 2 4 S RR SR RR SR RR
Latitude coefficient
Hosted file
LarsenShirey_SuppFig1.pdf available at https://authorea.com/users/309075/articles/502821-
method-matters-pitfalls-in-analyzing-phenology-from-occurrence-records
6You can also read