Weekly Influenza and COVID-19 Surveillance graphs - GOV.UK
←
→
Page content transcription
If your browser does not render page correctly, please read the page content below
Weekly Influenza and COVID-19
                        Surveillance graphs
   PHE publishes a weekly national influenza and COVID-19 surveillance
   report which summaries the information from the surveillance systems
   which are used to monitor influenza, COVID-19 and other seasonal
   respiratory viruses in England.

   Additional figures based on these surveillance systems are included in this
   slide set.

   The figures presented in this slide set are based on data from week 6
   (between 8 and 14 February 2021).

18 February 2021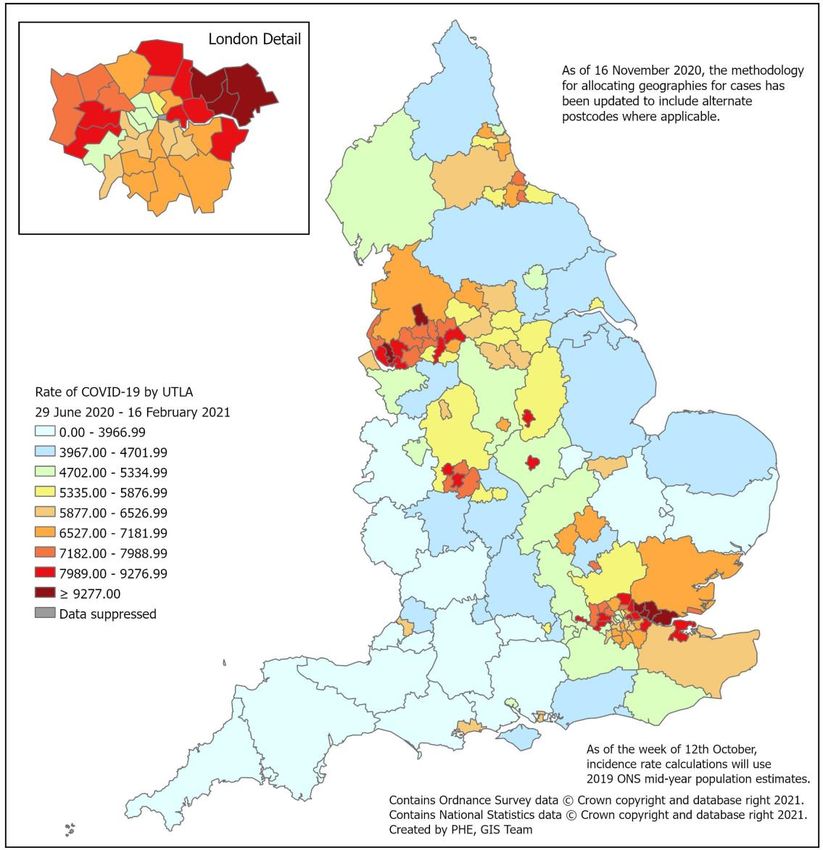
Confirmed COVID-19 cases in
                        England

18 February 2021                     Return to main menu
Weekly COVID-19 incidence per 100,000 population by age group and region,
                   weeks 50 to 6

18 February 2021                                                            Return to main menu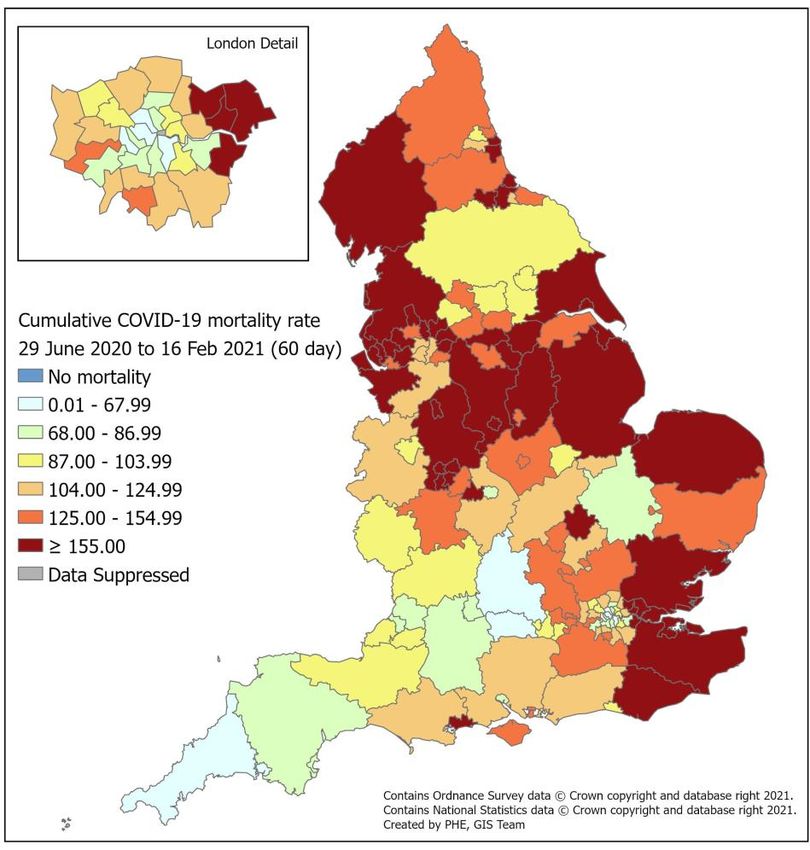
Weekly COVID-19 incidence per 100,000 population by ethnicity and
                   region, weeks 50 to 6

18 February 2021                                                            Return to main menu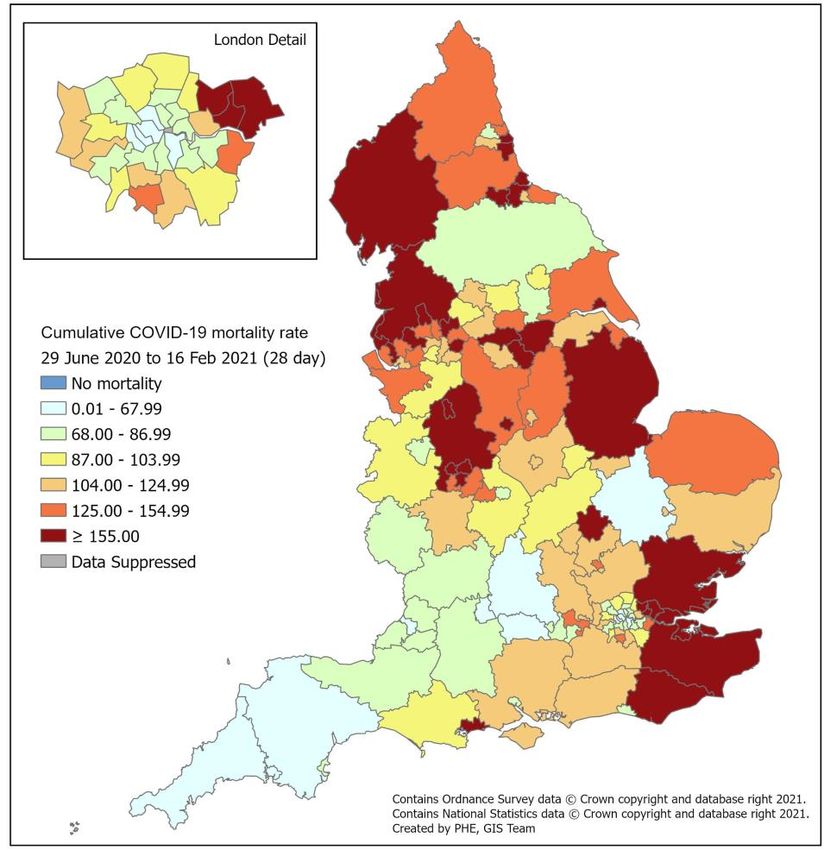
Weekly COVID-19 rate per 100,000 population by IMD quintile (1 being the most
                   deprived and 5 being the least deprived), weeks 50 to 6

18 February 2021                                                            Return to main menu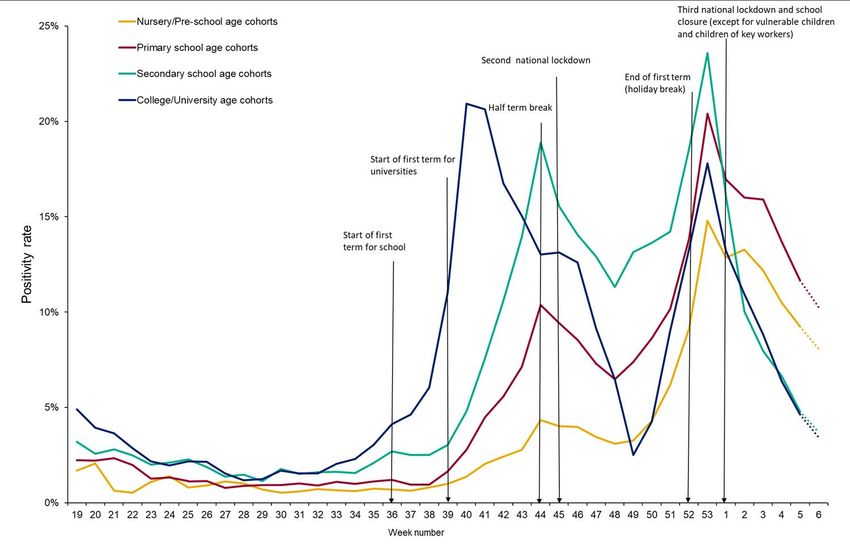
Cumulative rate of COVID-19 cases per 100,000 population tested under Pillar 1
                   and 2, by upper-tier local authority, England (box shows enlarged map of London
                   area)

18 February 2021                                                              Return to main menu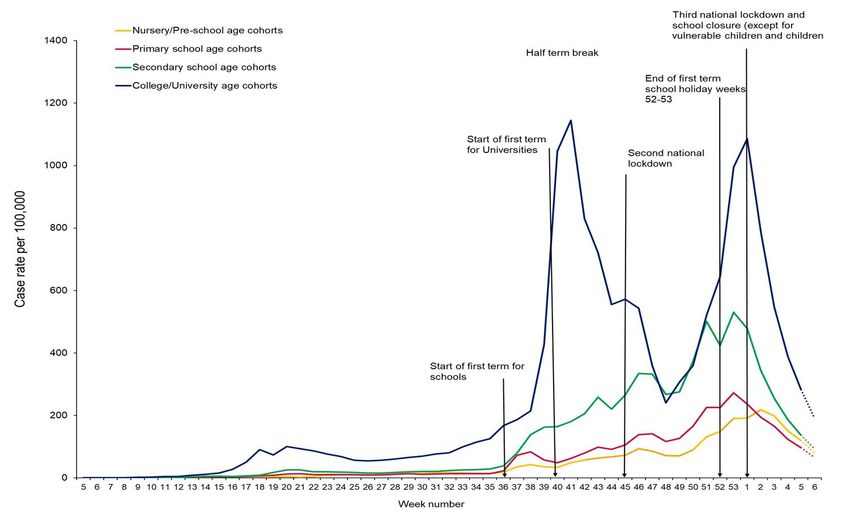
Cumulative rate (from week 27) of COVID-19 cases per 100,000 population
                   tested under Pillar 1 and 2, by upper-tier local authority, England (box shows
                   enlarged map of London area)

18 February 2021                                                                Return to main menu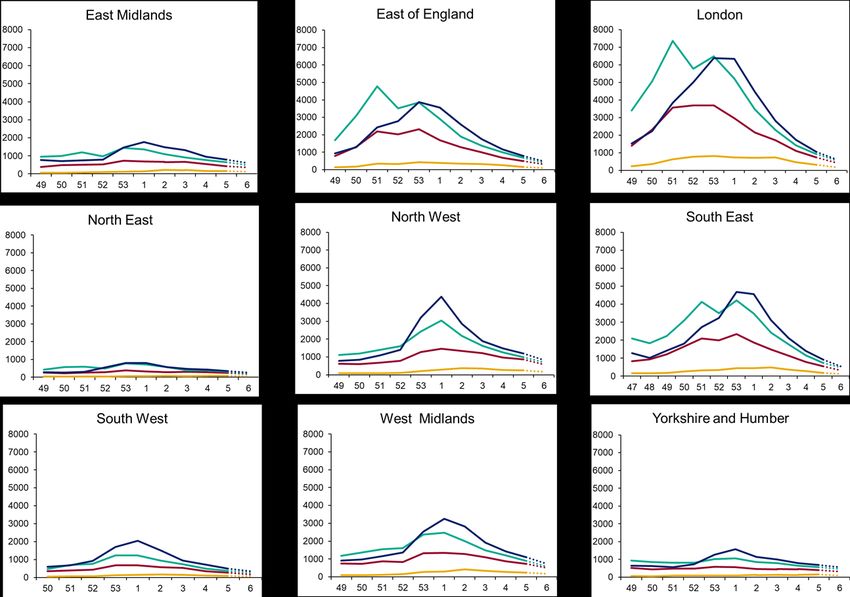
Weekly positivity of laboratory confirmed COVID-19 cases by reason for test,
                                    weeks 41 to 6

                                    35

                                    30

                                    25
                   Positivity (%)

                                    20

                                    15

                                    10

                                     5

                                     0
                                         41   42   43   44   45   46   47   48   49 50 51 52       53   1    2   3   4    5   6
                                                                                 Week number

                                          Community Testing                          Local council testing

                                          Symptomatic Citizen                        Symptomatic essential worker

                                          Symptomatic household member

18 February 2021                                                                                                         Return to main menu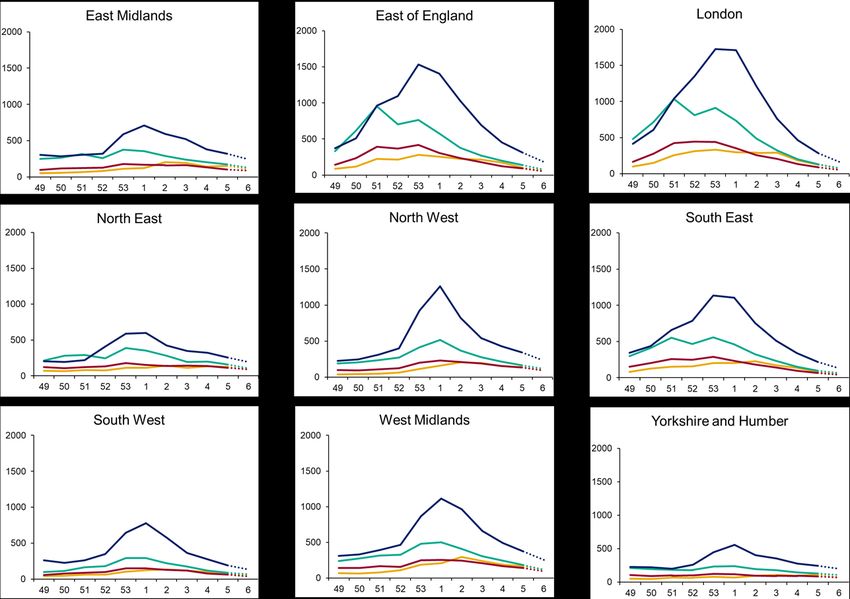
Respiratory Datamart system (England)

18 February 2021                    Return to main menu

Respiratory DataMart – Influenza subtypes

18 February 2021                                               Return to main menu
Respiratory DataMart – Respiratory syncytial virus (RSV)

18 February 2021                                                              Return to main menu
Respiratory DataMart – other respiratory viruses

                                                                      Return to main menu
18 February 2021
Community surveillance 18 February 2021 Return to main menu
COVID-19 clusters or outbreaks in educational settings

    Data Information
    • We report on new acute respiratory infection (ARI) incidents reported to Health Protection Teams (HPTs) and entered on
      HPZone in the previous reporting week in educational settings by locality
    • Individual case notes are reviewed by an epidemiologist and an assessment made about whether the criteria for a confirmed
      COVID-19 cluster or outbreak are met. See definitions below.
    • The incidents captured on HPZone represent a subset of all ongoing clusters and outbreaks in England. A variety of
      arrangements are in place with local authorities and other stakeholders supporting HPTs, however, data may not routinely be
      documented on HPZone. As a result, the number of outbreaks reported for some of the regions are underestimates

    Caveats
    • A national school helpline started operating on 17 September 2020 and a Universities helpline started operating on 7 October
      schools in England were closed for half-term during weeks 43 or/ and 44.
    • From Week 1 2021 the third national lockdown came into effect and schools were closed with the exception of vulnerable
      children and children of key workers. Early years settings have remained open.

    Definitions

     Cluster: two or more test-confirmed cases of COVID-19 among individuals associated with a specific non-residential setting with
    illness onset dates within a 14-day period (in the absence of detailed information about the type of contact between the cases).
     Outbreak: two or more test-confirmed cases of COVID-19 among individuals associated with a specific non-residential setting with
    illness onset dates within 14 days, and one of:
    • Identified direct exposure between at least 2 of the test-confirmed cases in that setting (for example under one metre face to
        face, or spending more than 15 minutes within 2 metres) during the infectious period of one of the cases.
    • When there is no sustained local community transmission - absence of an alternative source of infection outside the setting for
        the initially identified cases

18 February 2021                                                                                             Return to main menu
Number of COVID-19 confirmed clusters or outbreaks by type of
educational setting, England
300
250
Nursery
Combined
Number of ARI incidents
Primary school
200
Secondary school
Special Educational Needs (SEN) schools
College/University
150
100
50
0
36 38 40 42 44 46 48 50 52 1 3 5 7 9 11 13 15 17 19 21 23 25
Date of report week
18 February 2021 Return to main menuCumulative number of confirmed COVID-19 clusters or outbreaks by type of
educational setting and PHE Centre since week 36, England
Special
Primary Secondary Educational College
PHE Centres Nursery Combined Total
School School Needs (SEN) University
schools
East of England 8 (0) 16 (0) 40 (0) 0 (0) 9 (0) 13 (0) 86 (0)
East Midlands 88 (5) 152 (0) 104 (0) 0 (0) 51 (4) 22 (0) 417 (9)
London 100 (8) 332 (2) 354 (0) 1(0) 55 (0) 42 (1) 884 (11)
North East 1 (0) 18 (0) 24 (0) 0 (0) 9 (0) 6 (0) 58 (0)
North West 27 (1) 72 (1) 89 (1) 0 (0) 52 (0) 11 (0) 251 (3)
South East 132 (3) 265 (6) 304 (0) 1 (0) 108 (0) 35 (0) 845 (9)
South West 31 (2) 83 (0) 91 (0) 0 (0) 54 (2) 26 (0) 285 (4)
West Midlands 86 (11) 227 (5) 171 (1) 0 (0) 66 (4) 23 (0) 573 (21)
Yorkshire and Humber
81 (10) 174 (7) 119 (0) 0 (0) 62 (2) 25 (0) 461 (19)
Total 554 (40) 1339 (21) 1296 (2) 2 (0) 466 (12) 203 (1) 3860 (76)
*Number of outbreaks for Week 6 in brackets
18 February 2021 Return to main menuContacts by exposure/activity setting in week 6, England
(Data source: NHS Test and Trace)
Household
Household visitor
Other workplace
Unknown
Visiting friends/relatives
Education
Other activity
Working in healthcare
Leisure/community
Social care or home care
Shops
Travel
Health care
Prison / detention facility
Personal services
0 20000 40000 60000 80000 100000 120000 140000
Number of contacts
Note: categories have been grouped as follows: leisure / community includes eating out, attending events and celebrations,
exercising, worship, arts, entertainment or recreation, community activities and attending play groups or organised trips; other
workplace includes: retail, manufacturing or construction, hospitality, transport, emergency services or border force, food production
and agriculture, prison, financial services, civil service or local government, information and communication, military, critical national
infrastructure.
Personal services include hairdressers, barbers, tattooists and nail bars.
18 February 2021 Return to main menuEvents and activities reported by people testing positive, prior to symptom onset in
week 6, England
(Data source: NHS Test and Trace)
Shopping
Other (combined)
Activity event
Healthcare
Attending childcare educational setting Household event
Manufacturing or construction
Work or education
Other occupational sector
event
Other
Social care
Exercising
Retail sector
Warehouse or distribution
Living alone or with family
Teaching and education
Visiting a health or social care setting for non covid 19 reasons
Visiting friends or relatives
0 2000 4000 6000 8000 10000 12000 14000 16000 18000
Number of reports
Note: ‘Other’ includes a wide range of different activities and settings, each of which has small numbers of individuals, as well as activities which did not
fit any specific category and were added as Other by the case. This includes: all within ‘activities’: Arts, entertainment or recreation; Civil service or
government; Close contact services; Community and charity activities; Critical national infrastructure; Emergency services; Financial services; Food
production; Hospitality; Immigration border services; Information and communication; Military; Personal care; Prison; Private events and celebrations;
Public events and mass gathering; event within a shared household; Sport events; Supported living; Teaching and education; Transport; ‘Other
(combined)’ includes all exposure group types that have small counts such as “went to church”, “went to the zoo” within that event type.
18 February 2021 Return to main menuCommon locations reported by people testing positive in week 6, England
(Data source: NHS Test and Trace)
Setting All ages** %
Supermarket (visiting) 18 41.90%
Primary school (attending) 4 9.30%
Hospital (visiting and working) 2 4.70%
Nursery preschool (attending) 2 4.70%
Ambulance service (working) 1 2.30%
Bus (working) 1 2.30%
Department store (visiting) 1 2.30%
Fire service (working) 1 2.30%
Home (visiting) 1 2.30%
Hotel (home/shared) 1 2.30%
Manufacture engineering (working) 1 2.30%
Manufacture printing (working) 1 2.30%
Police (working) 1 2.30%
**Excludes 4 common exposures classed as ‘other’ at the third level of classification (these could be from several 2nd level categories such as Eating out,
Entertainment and day trips, Sport events etc). Also excludes 4 where no third level categorization was available (includes second level categories such as
Prison / detention facility, other occupational sector, information and communication). See appendix for more information.
The data is based on a revised definition for common exposures. Previously, >2 cases in the same location were counted as common exposures. The
revised definition further splits this into separate common exposures if the event’s settings are different. Additionally, the revised definition excludes
exposure events without a known event date. Furthermore, this data now only includes common exposures identified during the reporting week. This differs
from the previous version where a common exposure could be included in multiple reporting weeks depending on its exposure duration.
As a result of these differences, the data will not be comparable with previous versions.
18 February 2021 Return to main menuSurveillance in ‘educational-age’
cohorts
18 February 2021 Return to main menuMethodology and limitations
• Data source: SGSS Pillar 1 (NHS and PHE testing) and Pillar 2 (community testing) –
England
• Educational-age cohorts have been calculated using dates of birth that correspond to a
particular year group. School year groups run from 1 September to 31 of August of the
following calendar year.
• We include all cases regardless of whether or not they attended an educational setting
or whether or not the educational setting was open during the reporting period
• Data for the most recent week are provisional and likely to be an underestimate
• From early December a mass testing programme has been rolled out in Higher
Education Institutions using Lateral Flow Devices ahead of students returning home for
the Christmas break. This will impact testing trends and positivity data during this period.
18 February 2021 Return to main menuMethodology and limitations - Birth cohort – Year group
Birth cohort Year group
• The table aside represents the birth cohorts for 01/09/1998 to 31/08/1999 Uni Year 4
each year group 01/09/1999 to 31/08/2000 Uni Year 3
01/09/2000 to 31/08/2001 Uni Year 2
01/09/2001 to 31/08/2002 Uni Year 1
01/09/2002 to 31/08/2003 Year 13
01/09/2003 to 31/08/2004 Year 12
01/09/2004 to 31/08/2005 Year 11
01/09/2005 to 31/08/2006 Year 10
01/09/2006 to 31/08/2007 Year 9
01/09/2007 to 31/08/2008 Year 8
01/09/2008 to 31/08/2009 Year 7
01/09/2009 to 31/08/2010 Year 6
01/09/2010 to 31/08/2011 Year 5
01/09/2011 to 31/08/2012 Year 4
01/09/2012 to 31/08/2013 Year 3
01/09/2013 to 31/08/2014 Year 2
01/09/2014 to 31/08/2015 Year 1
01/09/2015 to 31/08/2016 Reception
01/09/2016 to 31/08/2017 Pre-school
01/09/2017 to 31/08/2018 Nursery
18 February 2021 Return to main menuWeekly number of laboratory confirmed COVID-19 cases in nursery/preschool,
primary, secondary and college/university age cohorts
18 February 2021 Return to main menuWeekly incidence of laboratory confirmed COVID-19 cases per 100,000 population
in nursery/preschool, primary school, secondary school and college/university age
cohorts
18 February 2021 Return to main menuWeekly incidence of laboratory confirmed COVID-19 cases per 100,000
population in educational age cohorts presented by Year group, from
nursery to Year 6, week 49 to 6
18 February 2021 Return to main menuWeekly incidence of laboratory confirmed COVID-19 cases per 100,000
population in educational age groups presented by secondary school year
groups (Year 7 to Year 13), week 49 to 6
18 February 2021 Return to main menuWeekly incidence of laboratory confirmed COVID-19 cases per 100,000
population in educational age cohorts corresponding to university/college
year groups, week 49 to 6
18 February 2021 Return to main menuWeekly incidence of laboratory confirmed COVID-19 cases per 100,000
population by educational age cohorts and PHE region, week 49 to 6
18 February 2021 Return to main menuWeekly number of new laboratory confirmed COVID-19 cases in educational
age cohorts presented by Year group, from nursery to Year 6, week 49 to 6
18 February 2021 Return to main menuWeekly number of new laboratory confirmed COVID-19 cases in educational
age cohorts presented by Year group, from nursery to Year 6
18 February 2021 Return to main menuWeekly number of new laboratory confirmed COVID-19 cases in educational
age groups presented by secondary school year groups (Year 7 to Year 13),
week 49 to 6
18 February 2021 Return to main menuWeekly number of new laboratory confirmed COVID-19 cases in educational
age groups presented by secondary school year groups (Year 7 to Year 13)
18 February 2021 Return to main menuWeekly number of new laboratory confirmed COVID-19 cases in
educational age cohorts corresponding to university/college year groups,
week 49 to 6
18 February 2021 Return to main menuWeekly number of new laboratory confirmed COVID-19 cases in educational
age cohorts corresponding to university/college year groups
18 February 2021 Return to main menuWeekly number of new laboratory confirmed COVID-19 cases by educational
age cohorts and PHE region, week 49 to 6
18 February 2021 Return to main menuWeekly positivity rates of confirmed COVID-19 cases in educational age cohorts
presented by Year group, from nursery to Year 6, week 49 to 6
18 February 2021 Return to main menuWeekly positivity rates of confirmed COVID-19 cases in educational age cohorts
presented by secondary school year group (Year 7 to Year 13), week 49 to 6
18 February 2021 Return to main menuWeekly positivity rates of confirmed COVID-19 cases in educational age cohorts
corresponding to university/college year groups, week 49 to 6
18 February 2021 Return to main menuWeekly positivity rates of confirmed COVID-19 cases, in nursery/preschool,
primary school, secondary school and college/University age cohorts
18 February 2021 Return to main menuWeekly rate of new COVID-19 tests performed per 100,000 population in
nursery/preschool, primary school, secondary school and college/University
age cohorts
*
* From early December a mass testing programme has been rolled out in Higher Education Institutions using
Lateral Flow Devices ahead of students returning home for the Christmas break. This will impact testing trends and
positivity data during this period.
18 February 2021 Return to main menuPrimary care surveillance 18 February 2021 Return to main menu
Overall SARS-CoV-2 positivity (%) (weekly) by PHE Region, England (RCGP)

                    60                                                                                                                         North

                                                                                                                                               Central

                                                                                                                                               South
                    50
                                                                                                                                               London

                    40
     % positivity

                    30

                    20

                    10

                    0
                         27 28 29 30 31 32 33 34 35 36 37 38 39 40 41 42 43 44 45 46 47 48 49 50 51 52 53 1 2 3 4 5 6 7 8 9 10 11 12 13 14 15 16 17 18 19 20
                                                                        Week number (based on onset date)

              For the most recent week, more samples are expected to be tested therefore the graph should be interpreted with caution.
              Positivity (%) is not calculated when the total number tested is less than 10

18 February 2021                                                                                                                      Return to main menu
Overall SARS-CoV-2 positivity (%) (weekly) by age group, England (RCGP)
60
0-4 5-14 15-44
50
45-64 65-74 75-84
40 85+ 65+
% positivity
30
20
10
0
27 28 29 30 31 32 33 34 35 36 37 38 39 40 41 42 43 44 45 46 47 48 49 50 51 52 53 1 2 3 4 5 6 7 8 9 10 11 12 13 14 15 16 17 18 19 20
Week number (based on onset date)
For the most recent week, more samples are expected to be tested therefore the graph should be interpreted with caution.
Positivity (%) is not calculated when the total number tested is less than 10
18 February 2021 Return to main menuSecondary Care surveillance 18 February 2021 Return to main menu
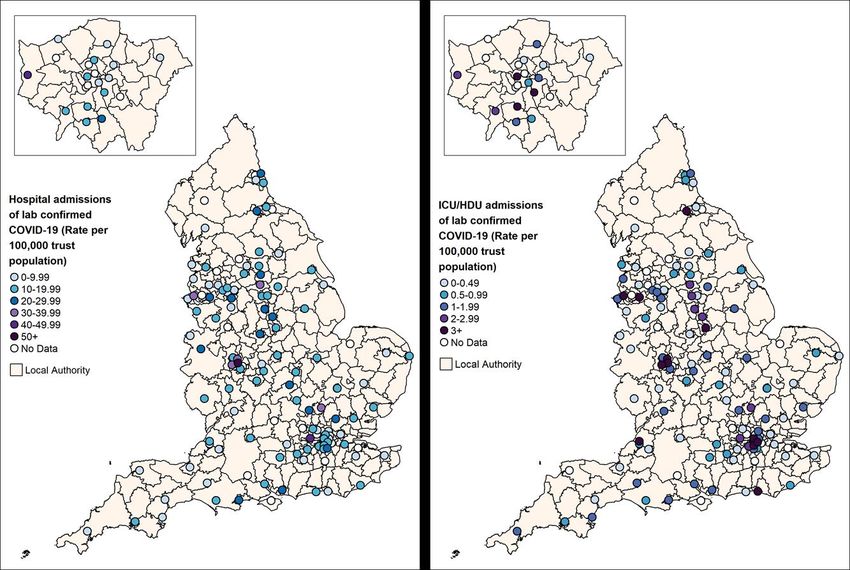
Weekly overall hospital and ICU/HDU admission rates per 100,000 of new
                           COVID-19 positive cases reported through SARI Watch, England since week 12

                                                  40.00                                                        COVID-19 hospital
                                                                                                               admission rate
                                                  35.00
                                                                                                               COVID-19 ICU/HDU
                                                                                                               admission rate
                   Admission rate (per 100,000)

                                                  30.00

                                                  25.00

                                                  20.00

                                                  15.00

                                                  10.00

                                                   5.00

                                                   0.00
                                                          121416182022242628303234363840424446485052 1 3 5 7 9 1113151719212325
                                                                                      Week number

18 February 2021                                                                                                        Return to main menu
Weekly admission rates for hospital and ICU/HDU laboratory confirmed
COVID-19 cases reported through SARI Watch, week 6
18 February 2021 Return to main menuAge/sex pyramid of new (a) hospital (lower level of care) (n=36,965) and (b)
ICU/HDU (n=15,979) COVID-19 cases reported through SARI Watch, England
(a) (b)
Male Female Male Female
80+ y 80+ y
70-79y 70-79y
60-69y 60-69y
50-59y 50-59y
Age group
Age group
40-49y 40-49y
30-39y 30-39y
20-29y 20-29y
10-19y 10-19y
5-9y 5-9yEthnic group of new hospitalisations (lower level of care) (n=35,638) and ICU/HDU
(n=14,800) COVID-19 cases reported through SARI Watch, England
83.5
White
67.0
8.5
Asian / Asian British
17.1
4.8
Black / African / Caribbean / Black British
8.3
0.8
Mixed / Multiple ethnic groups
1.5
2.3 Hospitalisations ICU/HDU
Other ethnic group
6.1
proportion of admitted cases (%)
This figure is based on individual patient level data which are provided to SARI Watch from a subset of NHS Acute Trusts,
therefore the data should be interpreted with caution as the distribution of age, sex and ethnic group may not be
representative of all hospitalised patients.
18 February 2021 Return to main menuWeekly COVID-19 hospitalisation rate per 100,000 trust catchment population by
age group and region, weeks 50 to 6
18 February 2021 Return to main menuHospital admission rate (excluding ICU/HDU) by ethnicity per 100,000 trust
catchment population
120.00
Per 100,000 Ethnicity-specific Trust Catchment Population
100.00
80.00
60.00
40.00
20.00
0.00
12 14 16 18 20 22 24 26 28 30 32 34 36 38 40 42 44 46 48 50 52 1 3 5
Week Number
White Asian Black Mixed Other
Caveat: Ethnicity was obtained through linkage to hospital activity data and determined by the ethnicity stated in the most recent record. There are several limitations with
this approach. Ethnicity is supposed to be self-reported by the patient in hospital records, but this may not always be the case. Patients may also report different ethnicities in
different episodes of care. The Other ethnic group may include people who do not self-identify with any of the more explicitly-defined ethnicity categories, or people who
have been assigned to the group by data reporters. In addition, people from certain ethnic backgrounds may be less likely to have complete records with which to complete
the linkage to hospital data. Previous analysis has shown higher population-based diagnoses and death rates in the Other ethnic group due to a mismatch between ethnicity
assigned in the population data and hospital records (see disparities report). However, further work is ongoing to improve the allocation of ethnicity to COVID-19 data.
18 February 2021 Return to main menuRate of admission to ICU/HDU by ethnicity, per 100,000 trust catchment
population
Per 100,000 Ethnicity-specific Trust Catchment Population 35.00
30.00
25.00
20.00
15.00
10.00
5.00
0.00
12 14 16 18 20 22 24 26 28 30 32 34 36 38 40 42 44 46 48 50 52 1 3 5
Week Number
White Asian Black Mixed Other
Caveat: Ethnicity was obtained through linkage to hospital activity data and determined by the ethnicity stated in the most recent record. There are several limitations with
this approach. Ethnicity is supposed to be self-reported by the patient in hospital records, but this may not always be the case. Patients may also report different ethnicities in
different episodes of care. The Other ethnic group may include people who do not self-identify with any of the more explicitly-defined ethnicity categories, or people who
have been assigned to the group by data reporters. In addition, people from certain ethnic backgrounds may be less likely to have complete records with which to complete
the linkage to hospital data. Previous analysis has shown higher population-based diagnoses and death rates in the Other ethnic group due to a mismatch between ethnicity
assigned in the population data and hospital records (see disparities report). However, further work is ongoing to improve the allocation of ethnicity to COVID-19 data.
18 February 2021 Return to main menuMortality surveillance 18 February 2021 Return to main menu
Number of deaths since week 10 by week of death and time since laboratory
                                 confirmation of COVID-19, England

                                 9000                               28 day definition (N = 101,932)
                                                                    60 day definition (N = 113,061)
                                 8000

                                 7000

                                 6000
              Number of deaths

                                 5000

                                 4000

                                 3000

                                 2000

                                 1000

                                   0
                                        10 12 14 16 18 20 22 24 26 28 30 32 34 36 38 40 42 44 46 48 50 52 1 3 5 7 9 11 13 15 17 19
                                                                                 Week of death

18 February 2021                                                                                                     Return to main menu
Cumulative mortality rate of COVID-19 cases per 100,000 population tested under
Pillar 1 and 2 since week 27 by (a) 28 day definition and (b) 60 day definition
(a) (b)
18 February 2021 Return to main menuAge-adjusted mortality rate** (per 100,000 population) in laboratory-
confirmed cases of COVID-19 by IMD quintile, from week 27 onwards, by
week using the 60 day definition
1000
900
800
Rate (Per 100,000 population)
700
600
500
400
300
200
100
0
27 28 29 30 31 32 33 34 35 36 37 38 39 40 41 42 43 44 45 46 47 48 49 50 51 52 53 01 02 03 04 05 06
Week of death
1 2 3 4 5
**Rates are time-adjusted: a weekly population denominator has been used to calculate the mortality rate
18 February 2021 Return to main menuCOVID-19 Vaccine Impact on
Surveillance Indicators
18 February 2021 Return to main menuCumulative number of confirmed COVID-19 cases since week 27, by age
group
300000
Vaccine rollout to
250000
Cumulative cases since week 27
80+ age group
200000
150000
100000
50000
0
27 29 31 33 35 37 39 41 43 45 47 49 51 53 2 4 6
Week
60 to 69 70 to 79 80+
18 February 2021 Return to main menuCumulative number of hospitalisations for lab confirmed COVID-19 since
week 41, by age group
45000
Cumulative hospital admissions since week 41
40000
35000
Vaccine rollout to
30000 80+ age group
25000
20000
15000
10000
5000
0
41 42 43 44 45 46 47 48 49 50 51 52 53 1 2 3 4 5 6
WeekCumulative number of ICU/HDU admissions for lab confirmed COVID-19
since week 41, by age group
3500
Cumulative ICU/HDU admissions since week 41
3000
2500
Vaccine rollout to
80+ age group
2000
1500
1000
500
0
41 42 43 44 45 46 47 48 49 50 51 52 53 1 2 3 4 5 6
WeekWeekly number of hospitalisations for lab confirmed COVID-19, by age
group
4500
4000
Weekly Hospital Admissions
3500 Vaccine rollout to
80+ age group
3000
2500
2000
1500
1000
500
0
41 42 43 44 45 46 47 48 49 50 51 52 53 1 2 3 4 5 6
WeekWeekly number of admissions to ICU/HDU for lab confirmed COVID-19,
by age group
400
350
Weekly ICU/HDU Admissions
300
Vaccine rollout to
250 80+ age group
200
150
100
50
0
41 42 43 44 45 46 47 48 49 50 51 52 53 1 2 3 4 5 6
WeekCumulative number of COVID-19 deaths since week 27 (28 day definition),
by age group
Cumulative deaths (28 day definition) since week
45000
40000 Vaccine rollout to
80+ age group
35000
30000
25000
27
20000
15000
10000
5000
0
27 29 31 33 35 37 39 41 43 45 47 49 51 53 2 4 6
Week
50 to 79 80+
18 February 2021 Return to main menuCo/secondary infections with COVID-
19
18 February 2021 Return to main menuCo/secondary infections with COVID-19
(data updated monthly)
• Caveat - a limited number of COVID-19 cases are tested for other respiratory viruses therefore data
could represent an underestimate of co/secondary infection cases. Due to the low number of cases
data is representative of January to November 2020 unless stated.
• Co/secondary infections refers to when a patient has an infection with more than one pathogen at the
same time (co-infection), or acquires another infection after contracting the first infection (secondary
infection).
• Numbers of co/secondary infection remain low across PHE surveillance systems except for patients
requiring Extra Corporeal Membrane Oxygenation (ECMO) which are those with the most severe
respiratory signs. Analysis of ECMO cases indicates co/secondary infections account for just less
than a third of respiratory infection cases.
• Preliminary data analysis from the first pandemic wave (health care associated infections,
Streptococcus pneumoniae, influenza, ECMO data) to end of September 2020 indicates that patients
requiring ECMO and those not requiring ECMO with co/secondary infection have increased risk of
mortality in comparison to patients without co/secondary infection.
Definitions agreed with DAs
18 February 2021 Return to main menuCo/secondary infections among Extra Corporeal Membrane Oxygenation
(ECMO) patients (patients with most severe clinical respiratory signs)
Based on cumulative data on ECMO activity from week 40 (week beginning 30 Sep 2020) to week 52
(week ending 27 December 2020), which includes data from the first and second waves of the pandemic.
COVID-19 cases from week 10 2020 (3 March 2020).
• 32% (133/418) of patients admitted to ECMO with a laboratory confirmed respiratory infection had a
co/secondary infection reported.
• 43% (16/37) of patients with influenza had co/secondary infections
• 32% (102/318) of patients with COVID-19 had co/secondary infections. Of these 102 cases, the most
frequent co/secondary infections in COVID-19 cases were Gram-negative bacilli and fungi,
accounting for 62% (63/102).
18 February 2021 Return to main menuCo/secondary infections among patients with Healthcare Associated Infections:
Blood stream and respiratory infections (bacterial and fungal, COVID-19 cases
up to November 4th 2020)
• 0.4% of COVID-19 patients had a bacterial/fungal infection at or within 28 days following their
COVID-19 diagnosis: 0.1% respiratory infection; 0.2% bloodstream infection.
• Most (66%) of co/secondary infections were categorised as secondary infections.
• Most frequent species identified from respiratory co/secondary infection isolates were
Staphylococcus aureus, followed by Haemophilus influenzae, Pseudomonas aeruginosa and
Klebsiella pneumonia.
• Most frequent species identified from blood co/secondary infection isolates were Escherichia coli,
followed by Staphylococcus aureus, Enterococcus faecium, and Klebsiella pneumoniae.
• Co-infections occur more frequently in the elderly (>70y 68% of co-infections).
18 February 2021 Return to main menuCo/secondary infection with respiratory viruses, vaccine preventable bacteria
and fungi
The UK moved out of influenza season in early 2020/21 when COVID-19 increase began in March 2020
Data contains results from two systems (Respiratory DataMart system and SGSS).
Mycology data contains results from Mycology reference laboratory data, Candidaemia is representative of deep infection.
Legionella, Mycoplasma and gastrointestinal infection data not included
18 February 2021 Return to main menuYou can also read