MI COVID response Data and modeling update - January 4, 2022 - State of ...
←
→
Page content transcription
If your browser does not render page correctly, please read the page content below
MI COVID response
Data and modeling update
January 4, 2022
Executive Summary
Michigan remains at High Transmission
Percent positivity (30.0%) is increasing for 2 weeks (last week: 21.1%)
Case rate (785.2 cases/million) is increasing for 1 week (468.5 cases/million prior week)
   In the last 7 days, Michigan reported the 11th most cases (last week’s rank: 15th highest) and the 20th highest case rate (last week: 26th highest)
   Cases among pediatric populations < 12 years have increased 24% since last week
Percent of inpatient beds occupied by individuals with COVID (19.6%) is increasing for 1 week (last week 18.4 %)
   In the last 7 days, Michigan reported the 7th highest inpatient bed utilization (last week: 4th highest) and 9th highest adult ICU bed utilization (7th
   highest last week)
   Daily pediatric hospital census have increased and are at a new high (double of where we were a week ago)
Death rate (6.8 deaths/million) is decreasing for one week (8.4 last week). There were 476 COVID deaths between Dec 21-Dec 27
   Michigan has the 10th most deaths (8th highest last week), and 23rd highest death rate (T17th highest last week) in the last 7 days
7-day average state testing rate is 5,166.7 tests/million/day. Daily diagnostic tests (PCR) is 51.4K per day, and the weekly average for PCR and
   antigen tests conducted in Michigan is 66.5K.
Over 14.0 million COVID-19 vaccine doses administered, 57.0% of the population is fully vaccinated (over 5.6 million people)
181,746 initial dose administrations in 5- to 11-year-olds as of 1/3

Year in Numbers
In 2021, nearly 1 in 10 Michiganders were reported with COVID-19, and more than 1 in 1,000 Michiganders died from COVID-19
Public Health responded with over 14.0 million COVID vaccines administrated, 4.6 million rapid antigen tests distributed, and $275 million allocated
  to local health departments to support COVID-19 efforts
Average mobility and encounter density are both above pre-pandemic baseline levels
Global, National and
Michigan Trends
Global and National Trends
                                                                                                                                 New COVID-19 Cases per 100,000 Reported to CDC in Region 5
                                                                                                                                 7-day moving avg. of new cases per 100K
                                                                                                                               140

                                                                                                                               120

                                                                                                                               100

                                                                                                                                80

                                                                                                                                60

                                                                                                                                40

                                                                                                                                20

                                                                                                                                  0
                                                                                                                                      1/1    3/1       5/1      7/1     9/1     11/1      1/1      3/1      5/1    7/1     9/1   11/1
                                                                                                                                            Illinois         Indiana        Michigan            Minnesota         Ohio       Wisconsin

   Globally, 290,236,007 cases and 5,445,274 deaths (Data* through 1/3)
   •    Globally, the highest number of cases ever reported on a single day on 12/30 (1.95 million); & cases in many countries are increasing rapidly with Omicron variant
   United States: Nearly all US jurisdictions have High or Substantial community transmission ¶
   •    The U.S. is at High transmission level (666.9 cases/100,000 in last 7 days)
   Midwest states maintain High transmission levels† and are increasing
   •    Illinois and Ohio have the highest case rates in Midwest; Michigan is 3rd highest in the Midwest; New York City and D.C. have highest case rates in U.S.
Source: * Johns Hopkins Coronavirus Resource Center; ¶ CDC COVID Data Tracker Weekly Review; † CDC COVID Data Tracker – CDC recently updated their methodology for reporting case rates

                                         National                                                                                              Public Health                              Other                          Science
Special Populations                                                            Spread                            Severity
                                        Comparison                                                                                                 Response                          Indicators                      Roundup
State Comparisons: Ohio and Indiana

                                      5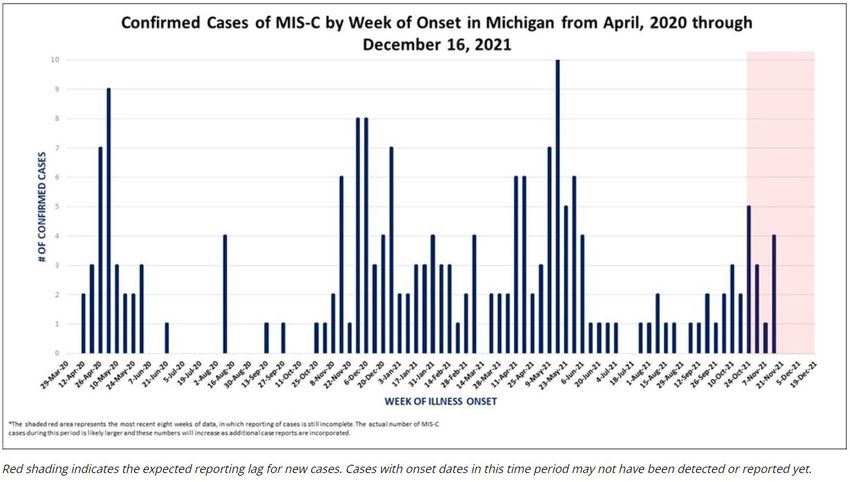
State Comparisons: Illinois and Minnesota

                                            6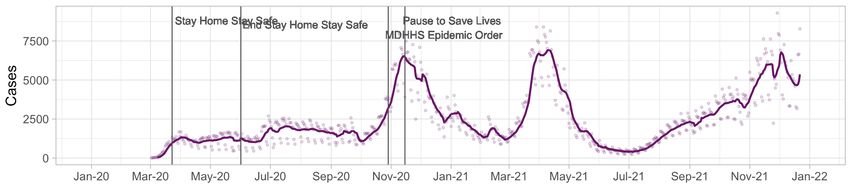
State Comparisons: Wisconsin and Michigan

                                            7
Key Messages: COVID-19 Transmission Metrics Are Increasing
     Michigan continues to be at High Transmission level
     •   All counties in Michigan are at High Transmission level
     •   CDC recommends all individuals, regardless of vaccination status, should mask in public indoor settings

     Statewide positivity is 30.0% (last week: 21.1%)
     •   Trend is increasing for 2 weeks

     Case rate is 785.2 cases/million (last week: 468.5 cases/million):
     • Trend is increasing exponentially for 1 week
     • Cases per million are increasing for all age groups and highest in those 20-39

     Cases and outbreaks saw decreases in school but increases the long-term care setting
     • Within the K-12 setting, the most cases and outbreaks continue to be in pre-kindergarten and elementary schools
     • Case counts in LTCF have more staff case count than residents case count, week over week

     Breakthrough
     • Approximately 2.0% of people who were fully vaccinated have been reported with a breakthrough infection
     • Unvaccinated persons in Michigan had 4.3 times the risk of testing positive for COVID-19 and 13.2 times the risk of dying from COVID-19
       compared to fully vaccinated persons; nationally risk of infection and death is lower for those who receive a booster dose

                         National                                                       Public Health              Other            Science
Special Populations                              Spread              Severity
                        Comparison                                                        Response             Indicators          Roundup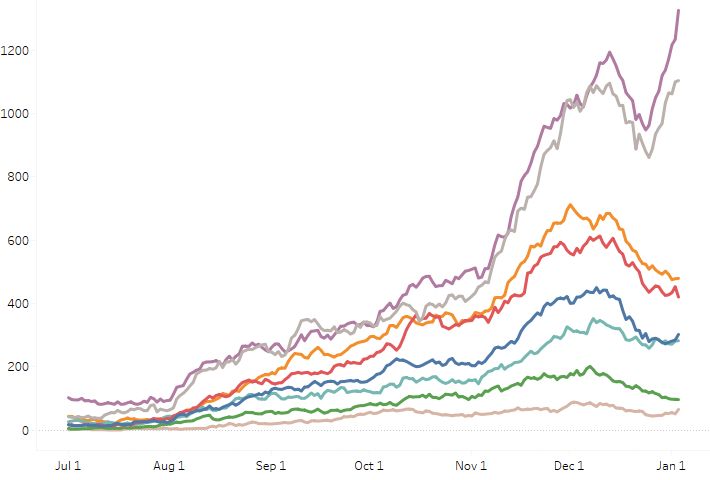
Michigan continuing to experience high
      daily case count during the pandemic

      Dashboard | CDC | MI Start Map for most recent data by
      reporting date

  •    All counties at High Transmission level
  •    Referrals sharply rose over New Year holiday weekend

                           National                                      Public Health     Other      Science
Special Populations                              Spread       Severity                                          9
                          Comparison                                      Response       Indicators   Roundup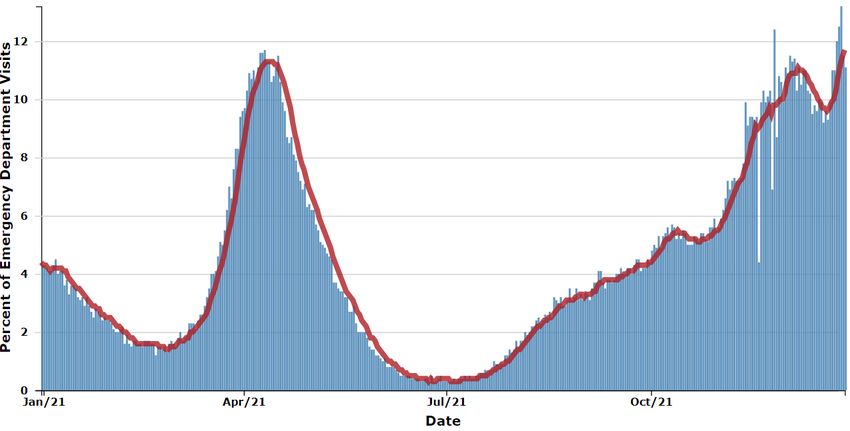
Confirmed and probable case indicators                                                              Risk levels
           Table Date: 1/3/2021 (7 days from date table was produced: 12/27/2021)                   Low    A    B      C      D      E

             Cases                                               Positivity

                       National                                               Public Health     Other                      Science
Special Populations                   Spread          Severity                                                                           10
                      Comparison                                               Response       Indicators                Roundup
Time Trends – Positivity, Case Rates, Hospitalizations, Deaths
➢ Most COVID-19 indicators are at 2021 highs, and burden remains high in MI
Daily Positive Test Rate Daily Inpatient Beds Occupied by COVID patients
Daily Case Rate Daily Deaths
Source: Michigan Disease Surveillance System and https://www.mistartmap.info/mism-indicators
National Public Health Other Science
Special Populations Spread Severity 11
Comparison Response Indicators RoundupTime Trends – Annual Comparison
• Case rates (by onset date) are the highest of the pandemic
• Current increases after holidays due to spread of the Delta and Omicron variants
7- day rolling average of Rates 2020 vs 2021
1200
Omicron (B.1.1.529) Wave
1000
800 Alpha (B.1.1.7) wave 2020 Holiday wave
600
400 Delta (B.1.617.2) wave
First wave
200
0
3/1 4/1 5/1 6/1 7/1 8/1 9/1 10/1 11/1 12/1 1/1 2/1
2020 2021
National Public Health Other Science
Special Populations Spread Severity 12
Comparison Response Indicators RoundupCase Rate Trends by Age Group
Daily new confirmed and probable cases per million by age group (7-day rolling average)
2000 0-9 30-39 60-69 2000
10-19 40-49 70-79
1750 20-29 50-59 80+ 1750
20-29
1500 1500 30-39
1250 1250 40-49
1000 1000 50-59
750 750
500 500
250 250
0 0
3/1 5/1 7/1 9/1 11/1 1/1 3/1 5/1 7/1 9/1 11/1 1/1 7/1 8/1 9/1 10/1 11/1 12/1 1/1
• Case rate trends for most age groups saw increases over the past week and are expected to increase further
• Case rates by onset date for all age groups are between 282 and 1,371 cases per million (through 12/27)
• Case counts and case rates are highest for 20-29-year-olds this week
Note: Case information sourced from MDHHS and reflects date of onset of symptoms
Source: MDHHS – Michigan Disease Surveillance System
National Public Health Other Science
Special Populations Spread Severity 13
Comparison Response Indicators RoundupNumber of Cases and Case Rates by Age Group, data as of Jan 3
Daily new confirmed and probable cases per million by age group (7-day rolling average)
Age Average† Average† One Week
Group daily cases Daily Case % Change (Δ #)* • Trend numbers and comparisons are
Rate being impacted by longer backfill times –
0-9 514.4 446.3 +17% (+76) the data in this table are comparing the
two time points from the most recent data
10-19 866.3 690.3 +42% (+255)
file
20-29 1,891.7 1,371.2 +101% (+951)
• Average daily number of cases (1,891.7) and
30-39 1,569.6 1,293.8 +77% (+682) average daily case rate (1,371.2 case/mil)
40-49 1,150.7 975.7 +69% (+472) are highest for those aged 20-29
50-59 956.1 708.1 +48% (+312) • Case rates changes for all age groups have
60-69 580.9 455.3 +29% (+131) increased between the weeks of Dec 20 and
Dec 27. These increases are continuing at an
70-79 260.6 339.8 +32% (+64)
exponential pace after December 27 for all
80+ 117.0 282.5 +19% (+18) age groups.
Total¶ 7,917.4 785.2 +60% (+2,959)
† Rolling 7-day average; ¶ Total may not reflect state due to missing age data
Note: Case information sourced from MDHHS and reflects date of onset of symptoms
Source: MDHHS – Michigan Disease Surveillance System
National Public Health Other Science
Special Populations Spread Severity 14
Comparison Response Indicators RoundupCase Rates by Reported Racial and Ethnic Group
Daily new confirmed and probable cases per million Daily new confirmed and probable cases per
(7 day rolling average) by race category million (7 day rolling average) by ethnicity category
American Indian/Alaska Native Black/African American Hispanic or Latino Not Hispanic or Latino
1200 1200
Asian/Pacific Islander White
Race Case Rate Race Case Rate
1000 1000 Hispanic/Latino 438.7
American Indian/ 319.6
Alaskan Native Non-Hispanic 449.2
800 Asian/Pacific Islander 333.2 800
Black/African American 1,002.8
600 White 382.2 600
400 400
200 200
0 0
7/1 8/1 9/1 10/1 11/1 12/1 1/1 7/1 8/1 9/1 10/1 11/1 12/1 1/1
Updates since last week:
• Cases per million are increasing for most reported racial and ethnic groups and are surging for Blacks/African Americans
• The high number of cases with missing race/ethnicity data, and those multiracial or other are also impacting the case rates shown here
• In the past 30 days, 30% (↑1%) of race data and 40% (↑1%) ethnicity data was either missing or reported as unknown
Note: Case information sourced from MDHHS and reflects date of death of confirmed and probable cases.
Source: MDHHS – Michigan Disease Surveillance System
National Public Health Other Science
Special Populations Spread Severity 15
Comparison Response Indicators RoundupIdentified COVID-19 Cases Caused by Variants of Concern (VOC) in
US and Michigan
SARS-CoV-2 Variants Circulating in the Variants of Concern in Michigan, Jan 3
United States, Dec 26 – Jan 1 (NOWCAST)
• CDC reclassifies variants as
epidemiology shifts
• Variants are downgraded when
there has been a significant and
Currently, CDC is reporting
sustained reduction in
rapid increase in prevalence
prevalence, or variant no longer
of B.1.1.529 (i.e., Omicron)
poses significant risk to public
over past 3 weeks
health
• Cumulative numbers of Delta
are no longer included in county
counts; solely counts of Omicron
cases are listed here
52 Omicron cases in Wayne County attributed to Detroit City
Variant MI Reported Cases # of Counties MDHHS VOC Sequenced Prev. ¶
B.1.617.2 (delta) 29,704 83 68.1%
Data last updated Jan 3, 2022
Source: MDSS B.1.1.529 (omicron) 289 18 31.9%
¶ Sequence specimens are from the most recent week by onset date which may change as more specimens are sent in
National Public Health Other Science
Special Populations Spread Severity
Comparison Response Indicators RoundupOverview of metrics for individuals < 12 and
K-12 school clusters and outbreaks, recent and ongoing, week ending Dec 29
     Number of reported outbreaks/clusters decreased since last week (412 to 365), with decreases in Pre K-Elementary (221 to 195), and High
     Schools (110 to 102), and Middle/Jr High (81 to 68). Administration (0 to 0) remained the same.
                                                                                                          Number of            Range of cases
     Region          Number of reported cases, #                         # Ongoing - Excluding New # New  outbreaks            per outbreak
       Region 1                                              1,140    10                                                                                                                                 65                               2-82
       Region 2n                           456       17                                                                                                                                                  44                               5-54
       Region 2s                       351       37                                                                                                                                                      46                               3-44
       Region 3                                                                                             2,842     14                                                                                119                              3-100
       Region 5                  71      15                                                                                                                                                              17                               3-17
       Region 6                       291       17                                                                                                                                                       43                               2-54
       Region 7                    177      0                                                                                                                                                            11                               3-51
       Region 8                          378     0                                                                                                                                                       20                               3-51
       Total                                                                                                  5,706                                                           110                       365                               2-99

                                                                                                                                                                                               Number of                            Range of cases
     Grade level                   Number of reported cases, #                                                                 # Ongoing - Excluding New                # New                  outbreaks                            per outbreak
     Pre-school - elem.                                          2,279                                 67                                                                                               195                               2-62
     Jr. high/middle school                          1,221               0                                                                                                                               68                               3-82
     High school                                                2,206                                43                                                                                                 102                              2-100
     Administrative                00                                                                                                                                                                     0                                 4
     Total                                                                                                        5,706                                                       110                       365                               2-99
     Many factors, including the lack of ability to conduct effective contact tracing in certain settings, may result in significa nt underreporting of outbreaks. This chart does not provide a complete picture of outbreaks in
     Michigan and the absence of identified outbreaks in a particular setting in no way provides evidence that, in fact, that sett ing is not having outbreaks. Week of 12/16 98% LHDs reporting due to technical difficulties.
     NOTE (10/4): MDHHS adopted the new CSTE school cluster and outbreak definition which impacts how transmissions within school -sponsored settings are reported to the health department

     Source: LHD Weekly Sitreps

                                        National                                                                                                           Public Health                                 Other                          Science
Special Populations                                                                Spread                                 Severity                                                                                                                18
                                       Comparison                                                                                                             Response                               Indicators                        Roundup
Long Term Care Facility
Focus
National Public Health Other Science
Special Populations Spread Severity 19
Comparison Response Indicators RoundupReported Outbreaks within Long Term Care Facilities: Adult Foster Care,
Homes for the Aged, and Skilled Nursing Cases
Number of AFC/HFAs with 3 or more Confirmed Number of SNFs with 3 or more Confirmed
Cases Cases
70 70
60 60
Number of Facilities
50
Number of Facilities
50
40 40
30 30
20 20
10 10
0 0
3/24 4/24 5/24 6/24 7/24 8/24 9/24 10/24 11/24 12/24 3/26 4/26 5/26 6/26 7/26 8/26 9/26 10/26 11/26 12/26
• The number of Long-Term Care Facilities reporting 3 or more cases within a single reporting period increased in both AFC/HFA (20) and SNF
(31) in most recent data
COVID-19 outbreaks within Long-Term Care Facilities are defined as three or more cases with an epidemiological linkage by place and time indicating a shared exposure outside of a household
(https://www.michigan.gov/coronavirus/0,9753,7-406-98163_98173_102057---,00.html and https://www.michigan.gov/coronavirus/0,9753,7-406-98163_98173-526911--,00.html)
The data is from w eekly reporting by facilities w ith bed occupancy of at least 13 beds.
National Public Health Other Science
Special Populations Spread Severity 20
Comparison Response Indicators RoundupReported Cases within Long Term Care Facilities: Adult Foster Care, Homes
for the Aged, and Skilled Nursing Cases for Residents and Staff
STATE OF MICHIGAN WEEKLY TOTAL CONFIRMED COVID-19 CASES IN STATE OF MICHIGAN WEEKLY TOTAL CONFIRMED COVID-19 CASES IN
AFC/HFA RESIDENTS AND STAFF SNF RESIDENTS AND STAFF
03/24/2021 TO 12/29/2021 03/26/2021 TO 12/31/2021
1000 1000
900 900
800 800
Number of Cases
Number of Cases
700 700
600 600
500 500
400 400
300 300
200 200
100 100
0 0
3/24 4/23 5/23 6/22 7/22 8/21 9/20 10/20 11/19 12/19 3/26 4/26 5/26 6/26 7/26 8/26 9/26 10/26 11/26 12/26
Weekly Total Confirmed Cases Resident Weekly Total Confirm Cases Staff Weekly Total Confirmed Cases Resident Weekly Total Confirm Cases Staff
• Case counts in residents and staff are increasing and have peaked to 971 cases in SNF staff and 471 cases in AFC/HFA staff
• Case counts in LTCF have maintained the typical pattern of more cases among staff than residents
The data is from w eekly reporting by facilities w ith bed occupancy of at least 13 beds.
National Public Health Other Science
Special Populations Spread Severity 21
Comparison Response Indicators RoundupBreakthrough Cases
National Public Health Other Science
Special Populations Spread Severity
Comparison Response Indicators RoundupCumulative COVID-19 Cases by Vaccination Status, Michigan, Jan 15 – Dec 3
Fully Vaccinated People (5,154,846)
Cases Hospitalization Deaths
Percent of Cases In People Not Percent of Hospitalizations In People Percent of Deaths In People Not
Fully Vaccinated Not Fully Vaccinated Fully Vaccinated
(711,227 / 835,960) (17,706 / 20,101) (8,733/ 10,216)
85.1% 88.1% 85.5%
711,227 17,706 8,733
Total Cases Not Fully Vaccinated Total Hospitalized Not Fully Vaccinated Total Deaths Not Fully Vaccinated
Total Breakthrough Cases Total Breakthrough Hospitalizations Total Breakthrough Deaths
124,733 2,395 1,483
2.420% 0.046% 0.029%
Percent of Fully Vaccinated People who Percent of Fully Vaccinated People Who Were Percent of Fully Vaccinated People Who Died of
Developed COVID-19 (124,733/ 5,154,846) Hospitalized for COVID-19 (2,395 / 5,154,846) COVID-19 (1,483 /5,154,846)
14.9% 11.9% 14.5%
Percent of Cases Who Were Fully Vaccinated Percent of Hospitalizations Who Were Fully Percent of Deaths Who Were Fully Vaccinated
(124,733 / 835,960) Vaccinated (2,395 / 20,101) (1,483 /10,216)
Total Cases: 835,960 Total Hospitalizations: 20,101 Total Deaths: 10,216
Michigan Disease Surveillance System may underestimate the frequency of COVID-19 hospitalizations:
- Case investigation and follow-up is more difficult for individuals who get hospitalized (e.g., they are too ill to speak to in vestigators, don’t answer their phone, or otherwise).
- These hospitalizations include individuals who are hospitalized for issues other than COVID19 (the same as breakthrough COVID -19).
- Individuals who get hospitalization will lag after infection and may occur after case investigation.
National Public Health Other Science
Special Populations Spread Severity
Comparison Response Indicators RoundupNational Age-Standardized Rates of COVID-19 Cases and Deaths by
`
Vaccination Status
Footnotes: Incidence rates were age-standardized using the 2000 U.S. Census standard population; and rates are not adjusted for time since vaccination, underlying conditions, or other demographic factors
besides age. | Incidence rate ratios for the past one month were calculated by dividing the average weekly incidence rates among unvaccinated people by that among fully vaccinated people.
National Public Health Other Science
Special Populations Spread Severity
Comparison Response Indicators RoundupMichigan Age-Standardized Rates of COVID-19 Cases and Deaths by
`
Vaccination Status
In October, unvaccinated persons had:
4.3 X AND 13.2 X
Risk of Testing Positive for COVID-19 Risk of Dying from COVID-19
compared to fully vaccinated persons
Footnotes: Incidence rates were age-standardized using the 2000 U.S. Census standard population; and rates are not adjusted for time since vaccination, underlying conditions, or other demographic factors
besides age. Incidence rate ratios for the past one month were calculated by dividing the average weekly incidence rates amon g unvaccinated people by that among fully vaccinated people.
National Public Health Other Science
Special Populations Spread Severity
Comparison Response Indicators RoundupRisk of becoming ill or dying much higher in unvaccinated individuals
Age-Adjusted Case and Death Rates per 100,000 People
In October 2021: by Vaccination Status, October 2021
Unvaccinated persons in Michigan had 4.3
times the risk of testing positive for COVID-19
compared to fully vaccinated persons
• 566.2 cases per 100,000 unvaccinated
persons compared to 130.9 cases per
100,000 fully vaccinated persons
Unvaccinated persons in Michigan had 13.2
times the risk of dying from COVID-19
compared to fully vaccinated persons
• 10.6 deaths per 100,000 unvaccinated
persons compared to 0.8 deaths per
100,000 fully vaccinated persons
Footnotes: Incidence rates were age-standardized using the 2000 U.S. Census standard population; and rates are not adjusted for time since vaccination, underlying conditions, or other demographic factors
besides age. Incidence rate ratios for the past one month were calculated by dividing the average weekly incidence rates amon g unvaccinated people by that among fully vaccinated people.
National Public Health Other Science
Special Populations Spread Severity
Comparison Response Indicators RoundupNational Age-Standardized Rates of COVID-19 Cases and Deaths by
`
Vaccination + Booster Status
Footnotes: Incidence rates were age-standardized using the 2000 U.S. Census standard population; and rates are not adjusted for time since vaccination, underlying conditions, or other demographic factors
besides age. | Incidence rate ratios for the past one month were calculated by dividing the average weekly incidence rates among unvaccinated people by that among fully vaccinated people.
National Public Health Other Science
Special Populations Spread Severity
Comparison Response Indicators RoundupKey Messages: Healthcare Capacity and COVID Severity
Emergency Department visits, Hospital Admissions, and Hospital Census trends for COVID are increasing
11.7% of ED visits are for COVID diagnosis (last week: 10.4%)
Hospital admissions for nearly all age groups are increasing over the past week
Hospital census has increased 11% since last week (vs. 6% decrease week prior)
Half of regions are seeing increasing trends in hospital census this week
▪ Regions 1, 2N, 2S and 8 show increasing trends over the past week
▪ Two preparedness regions (2N, 2S) have greater than 400/Million population hospitalized
Overall, volume of COVID-19 patients in intensive care has decreased 8% (vs. 12% decrease week prior)
▪ Three regions (1, 3, and 6) have overall adult ICU occupancy greater than 85%, with Regions 1 and 3 at or above
90% occupancy
▪ Pediatric hospitalizations have risen significantly; nearly doubling since last week and reaching a new pandemic high
Death rate is 6.8 daily deaths/million residents over last 7 days (Last week: 8.4 deaths/million)
Trends for daily average deaths are decreasing this week for most reported racial and ethnic groups
In the past week, American Indian/Alaskan Natives have the highest death rate (10.5 deaths/million) followed by Whites
(10.1 deaths/million)
In the past 30 days, the proportion of deaths among those over 60 is steady
National Public Health Other Science
Special Populations Spread Severity
Comparison Response Indicators RoundupMichigan Trends in Emergency Department (ED) Visits for
Diagnosed COVID-19
11.7%
• Trends for ED visits have increased to 11.7% since last week (last week: 10.4%)
• Over past week, those 25-39 years saw highest number of avg. daily ED CLI visits (14.5%), but those between 18-64 all above state average
Source: https://covid.cdc.gov/covid-data-tracker/#ed-visits; data extracted on 10/18/2021
National Public Health Other Science
Special Populations Spread Severity
Comparison Response Indicators RoundupAverage Hospital Admissions Are Increasing for all Age Groups
• Trends for daily average hospital admissions have increased 20% since last week (vs. 5% decrease prior week)
• Overall, many age groups saw increases this week following the holiday
• More than 70 daily hospital admissions was seen for each of the age groups of 50-59, 60-69, 70-79, and 80+
Source: CHECC & EM Resource
National Public Health Other Science
Special Populations Spread Severity 30
Comparison Response Indicators RoundupHospital Admissions and Admission Rates by Age Group
Daily new hospital admission per million by age group (7-day rolling average)
Age Average† daily Average† Daily One Week • Through Jan 3, there were an average of 486.6
Group number of hospital Hospital % Change (Δ #) hospital admissions per day due to COVID-19; an
admissions Admission Rate* increase from last week (+20%, +81)
0-11 18.4 13.2 +82% (+8) • Most age groups saw increases this week
12-17 5.1 6.8 +24% (+1) • The largest one-week percent increase was among
18-19 2.7 10.3 -5% (-Statewide Hospitalization Trends: Total COVID+ Census
Hospitalization Trends 3/1/2021 – 1/3/2022 The COVID+ census in hospitals has
Confirmed Positive & Persons Under Investigation (PUI) increased by 11% over the past week and is
now again over 4,000 patients.
4556
Confirmed Positive
Hospitalized COVID Positive Long Term
Trend (beginning March 2020)
4556
PUI
32Statewide Hospitalization Trends: Regional COVID+ Census
Growth has been focused in Regions 2S and 2N
Hospitalization Trends 6/1/2021 – 1/3/2022 although Regions 1 and 8 also show growth in the
Confirmed Positive by Region most recent days. Regions 3, 5, 6, and 7 show
decreasing trends this week.
Region 1
Region 2N
Region 2S
Regions 2N and 2S have greater than 400/Million
Region 3 Population hospitalized and Region 2S is over
Region 5
Region 6
500/Million population hospitalized.
Region 7
Region 8 Region COVID+ Hospitalizations COVID+
(% Δ from last week) Hospitalizations /
MM
Region 1 302 (4%) 279/M
Region 2N 1104 (18%) 499/M
Region 2S 1326 (26%) 595/M
Region 3 420 (-8%) 370/M
Region 5 282 (-2%) 296/M
Region 6 479 (-5%) 327/M
Region 7 96 (-17%) 192/M
Region 8 65 (44%) 209/M
33Statewide Hospitalization Trends: ICU COVID+ Census
Overall, the census of COVID+ patients in ICUs has
Hospitalization Trends 3/1/2021 – 1/3/2022
decreased 8% from last week. Census in ICUs has
Confirmed Positive in ICUs
decreased in all regions except for Regions 1 and 8.
Regions 1 and 3 have ICU occupancy greater than
85%. Regions 1, 2S, 3, and 6 have more than 30% of
ICU beds occupied by COVID patients.
Region Adult COVID+ in Adult ICU % of Adult ICU
ICU (% Δ from Occupancy beds COVID+
last week)
Region 1 68 (10%) 92% 34%
Region 2N 150 (-5%) 77% 27%
Region 2S 223 (-4%) 84% 32%
Confirmed Region 3 117 (-18%) 91% 36%
Positive in ICU Region 5 41 (0%) 80% 27%
Region 6 128 (-7%) 86% 45%
Region 7 33 (-43%) 81% 24%
Region 8 16 (7%) 71% 25%
34Statewide Hospitalization Trends: Pediatric COVID+ Census
Pediatric hospitalizations have risen significantly with
Hospitalization Trends 1/1/2021 – 1/3/2022
the COVID+ census nearly doubling since last week
Pediatric Hospitalizations, Confirmed
and reaching a new record for the pandemic.
The increase is predominantly in Region 2S where two
of the state’s largest Children’s hospitals are located.
Pediatric Hospitalizations by Region
(Nov 2021-Jan 2022)
35Multisystem Inflammatory Syndrome in Children (MIS-C)
Michigan Surveillance
• Higher community transmissions is followed by
higher incidence of MIS-C cases
• 196 cases identified in Michigan
• More than 60% of those children are elementary
and pre-school aged
• Black/African American children are
disproportionately impacted
• 70.4% children with MIS-C are treated in the ICU
Source: MDHHS and MIS-C Data and Reporting; Data through 12/16
National Public Health Other Science
Special Populations Spread Severity
Comparison Response Indicators RoundupAverage and total new deaths, by age group
Daily COVID-19 deaths in confirmed and probable cases per million by age group (7 day rolling average)
200
0-19 40-49 70-79
20-29 50-59 80+
30-39 60-69 Total
150
100
50
0
3/1 4/1 5/1 6/1 7/1 8/1 9/1 10/1 11/1 12/1 1/1 2/1 3/1 4/1 5/1 6/1 7/1 8/1 9/1 10/1 11/1 12/1 1/1
• Through 12/27, the 7-day avg. death rate is 40 daily deaths per million people for those over the age of 80
• Deaths rates have decreased over the last week for all age groups except 20-29- and 30–39-year-olds
Note: Death information sourced from MDHHS and reflects date of death of confirmed and probable cases.
Source: MDHHS – Michigan Disease Surveillance System (MDSS)
National Public Health Other Science
Special Populations Spread Severity 37
Comparison Response Indicators RoundupAverage and total new deaths, by age group
Daily COVID-19 deaths in confirmed and probable Total COVID-19 deaths in confirmed and probable
cases per million by age group (7 day rolling average) cases by age group (past 30 days, ending 12/27/2021)
100 0-19 40-49 70-79 • 22% of deaths below age sixty 957
20-29 50-59 80+
30-39 60-69 Total
75 758
709
50
432
25
166
75
1-5 20
0
7/1 8/1 9/1 10/1 11/1 12/1 1/1 0-19 20-29 30-39 40-49 50-59 60-69 70-79 80+
• Through 12/27, the 7-day avg. death rate is more than 40 daily deaths per million people for those over the age of 80
• In the past 30 days, the proportion of deaths among those over 60 is steady
Note: Death information sourced from MDHHS and reflects date of death of confirmed and probable cases.
Source: MDHHS – Michigan Disease Surveillance System (MDSS)
National Public Health Other Science
Special Populations Spread Severity 38
Comparison Response Indicators Roundup30-day rolling average daily deaths per million people by race and
ethnicity
Average daily deaths per million people by race Average daily deaths per million people by
American Indian/Alaska Native Black/African American ethnicity
Asian/Pacific Islander White
15 15 Hispanic or Latino Not Hispanic or Latino
12 12
9 9
6 6
3 3
0 0
7/1 8/1 9/1 10/1 11/1 12/1 1/1 7/1 8/1 9/1 10/1 11/1 12/1 1/1
• Deaths are lagging indicator of other metrics
• Trends for daily average deaths are decreasing for all reported races and ethnicities except Asian/Pacific Islanders
• Currently, American Indian/Alaskan Native have the highest death rate (10.5 deaths/million) followed by Whites (10.1 deaths/million)
Note: Death information sourced from MDHHS and reflects date of death of confirmed and probable cases.
Source: MDHHS – Michigan Disease Surveillance System
National Public Health Other Science
Special Populations Spread Severity 39
Comparison Response Indicators Roundup• `
Key Messages: Public Health Response
COVID-19 Vaccination
• 4,445 first doses administered each day (7-day rolling average)
• Over 5.6 million people (57.0% of the population) in the state are fully vaccinated
COVID-19 Boosters
• Over 2.3 million people have received an additional/booster dose in Michigan
• More than 67.9% of fully vaccinated Michiganders over the age of 65+ have been administered a booster dose
Pediatric Vaccination
• Interactive dashboard now includes pediatrics vaccination doses (live updates effective 11/5)
• 181,746 initial dose and 129,575 second dose administrations in 5- to 11-year-olds as of 1/3/22
Mask Protections in K-12 Schools
• 35% (184/533) of K-12 school districts have mandatory mask policies
• School districts with mandatory mask policies cover 53% (667,005/1,252,808) of K-12 students
• 14% of K-12 school districts have rescinded their mask policies
National Public Health Other Science
Special Populations Spread Severity
Comparison Response Indicators Roundup5.6 Million Michiganders fully vaccinated and 57.0% of total population fully
vaccinated Vaccination Coverage in Michigan as of 1/4/2021
Age Group % At Least % Fully % Boosted** Number Fully
Vaccination Coverage One Dose Vaccinated Vaccinated
Over 5.6 million people in the state are fully Total Population 63.7% 57.0% 42.6% 5,690,977
vaccinated* ≥ 5 years 67.5% 60.4% N/A 5,690,926
86.4% of people aged 65 and older have ≥ 12 years 71.9% 64.7% N/A 5,562,054
completed the series*
≥ 18 years 74.1% 66.8% 46.0% 5,235,740
63.7% of total population initiated*
≥ 65 years 94.6% 86.4% 67.9% 1,525,841
**Percentage of the fully vaccinated population
Booster Coverage
67.9% of fully vaccinated people aged 65 and
older have received a booster dose
42.6% of Michiganders in the state who are fully
vaccinated have received their booster dose
Source: *CDC COVID Data Tracker > Vaccinations in the US, ¶ MCIR COVID-19 Vaccine Dashboard
National Public Health Other Science
Special Populations Spread Severity
Comparison Response Indicators RoundupMI School Districts and Mask Policy as of Jan 3, 2023
Yes – Any masking policy in some subset of school grades
No – No mask policies (includes unknown)
NUMBER OF SCHOOL DISTRICTS NUMBER OF STUDENTS* IN SCHOOL NUMBER OF SCHOOL
WITH MASK POLICIES IN K-12 DISTRICTS WITH MASK POLICIES DISTRICTS WITH MASK POLICY
SETTINGS REVERSAL
600
500
Yes, 184 400
No,
585,803 Yes, 300
667,005 200
No, 349 100
0
Mask Policy Present No Mask Policy Mask Policy Rescinded
• 35% (184/533) of K-12 school districts have mandatory mask policies
• School districts with mandatory mask policies cover 53% (667,005/1,252,808) of K-12 students*
• Not all K-12 grades or students may be covered by mask policies; examples include policies for those through K-6, or only during higher levels of
community transmission
• 14% of K-12 school districts have rescinded their mask policies
* Student size based on school enrollment numbers; Buses and public transportation are federally required to enforce mask mandates
Source: Executive Office of Governor School District Mask Policy Database
National Public Health Other Science
Special Populations Spread Severity
Comparison Response Indicators Roundup• `
Key Messages: Science Round Up
Year End Review: Epidemic Summary
• Nearly 1 in every 10 Michiganders were reported with COVID-19 in 2021
• More than 1 in every 1,000 Michiganders died from COVID-19 in 2021
Year End Review: Public Health Response Summary
• Over 13.6 million COVID vaccines administrated
• 6.2 million with at least one dose
• 4.6 million rapid antigen tests distributed
• $275 million went to local health departments to support COVID-19 efforts
Michigan Mobility Update
• Average mobility and encounter density are both above pre-pandemic baseline levels and plateaued or
increasing
National Public Health Other Science
Special Populations Spread Severity
Comparison Response Indicators RoundupYear in Review – Pandemic in Numbers
Data 1/1/2021 through 12/20/2021
• Nearly 1 in every 10 Michiganders were reported with COVID-19 in 2021
• More than 1 (1.3) in every 10 people aged 30-39 reported COVID-19 infection in 2021
• 4.6 times more children 0-9 were reported infected with COVID-19 in 2021 compared to 2020, the
highest relative increase of any age group
• Enough cases in 2021 to fill the Big House 8 times
• Nearly 1 in every 100 Michiganders has been admitted to the hospital for COVID-19 in 2021
• One hospital admission every 7 minutes for COVID-19
• More than 1 in every 1,000 Michiganders died from COVID-19 in 2021
• 4.7 times more children 0-19 died from COVID-19 in 2021 compared to 2020, the highest relative
increase of any age group
• More than 1 in every 100 Michiganders over 80 years old died from COVID-19 in 2021
Source: Michigan Disease Surveillance System (MDSS); these number include confirmed and probable
National Public Health Other Science
Special Populations Spread Severity
Comparison Response Indicators RoundupYear in Review – Public Health Response in Numbers
Case Investigation and Contact Tracing Vaccination
Cases (Cumulative) • Over 14.0 million COVID vaccines
administrated
• 917,000 interview attempted
• 6.2 million with at least one dose
• 663,000 interview completed
• 5.6 million fully vaccinated
• 243,000 cases with contacts elicited
• Over 2.1 million booster doses
Contacts
administered
• 592,000 contacts
• 3.613 mobile vaccine events in 2021 with
• 351,000 contacts successfully reached 30,351 vaccines administered
Testing Funding
• 4.6 million rapid antigen tests distributed
o 2.6 million to schools and for school-based Total of $275 million went to local health
and sports-based testing departments to support COVID-19 efforts
o 554K to Corrections through fiscal year 2022.
o 913K to Long Term Care Facilities
• 5,731 testing events and 323K tests at points
of entry, community, and neighborhood sites
• MI Backpack Over the Counter Test Project
o 118 schools and 120,000 at home tests
Source: Michigan Disease Surveillance System (MDSS); these number include confirmed and probable
National Public Health Other Science
Special Populations Spread Severity
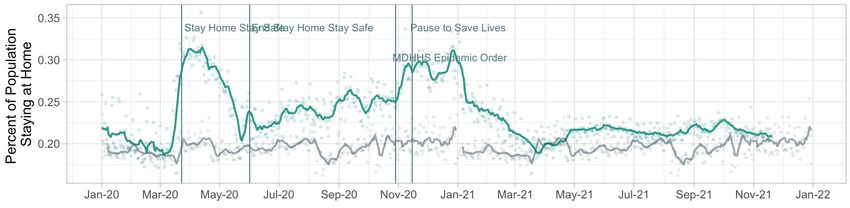
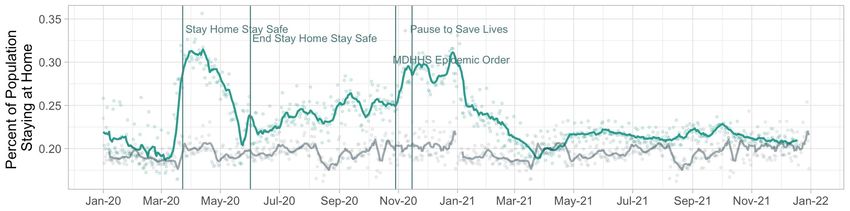
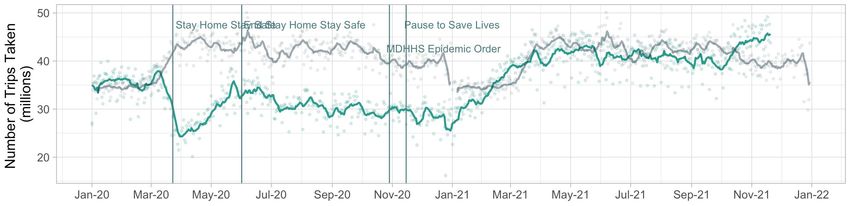
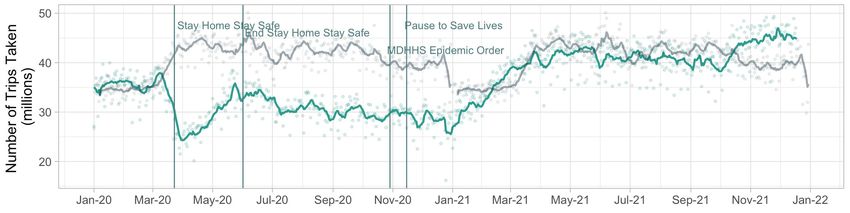
Comparison Response Indicators RoundupHow many people are staying at home in Michigan?
2020 - 2021
2019
• % Stay-at-home
levels and number
of trips taken/day
are at or near 2019
levels
• Most recent data is
12/18/21 (data as of
12/27/21)
Data Source: Bureau of
Transportation StatisticsChange in average mobility
Unacast mobility
patterns in MI
• Average mobility and
encounter density are both
above pre-pandemic Change in non-essential visits
baseline levels and
plateaued or increasing
• Number of non-essential
visits is decreasing
• Cases shown as bars at top of
each chart
• Non-essential visit data is Difference in encounter density
currently incomplete (only
through November)
Unacast social distancing data as of
12/29/21. Dots and solid black line show
metrics and 7-day average data. Grey line
and shaded region shows the 7-day average
using more recent, less stable data (4-day
lookback vs. 26-day lookback).You can also read