Method Validation Reports on Rules Proposals for the International Rules for Seed Testing 2021 Edition
←
→
Page content transcription
If your browser does not render page correctly, please read the page content below
International Seed Testing Association
   Secretariat, Zürichstrasse 50, CH-8303 Bassersdorf, Switzerland
   Phone: +41 44 838 60 00 Fax: +41 44 838 60 01
   Email: ista.office@ista.ch - http://www.seedtest.org

                                                                       Document OGM20-06

Method Validation Reports
on Rules Proposals for the
International Rules for Seed
Testing
2021 Edition

ISTA Validation study for moisture content test of Carica papaya L.
to support C.9.5                                                            2

Validation of temperatures used in germination test of Brassica napus to
support C.5.1                                                            11

Validation study to support a modification to the evaluation criteria for normal
seedlings of Helianthus annuus L. to support C.5.4.                          22

OGM Document                                                            Page 1 /36
Approved by ECOM Decision 20007
ISTA Validation study for moisture content test of

                                  Carica papaya L.
Yang W.J., Chen I.C., Kuo B.J.

Summary
The objective of this validation test is to introduce a moisture content determination method
for Carica papaya L. into Chapter 9 of ISTA Rules. The experiment was carried out by 10
ISTA accredited laboratories and 1 seed company (Known-You Seed co., LTD) using 2 seed
lots (A and B) with 2 moisture levels (L and H). The Statistical analysis showed that the
moisture content determined by both ground seed and whole seed methods have comparable
variance and are not significantly different, which suggested that both methods are
acceptable for moisture determination in papaya seeds. In addition, as both methods show
high repeatability and reproducibility in moisture determination and all participating
laboratories had high repeatability, the accuracy of the validation study is reliable. The
proportion of results with a difference of 0.3% or greater between the test results for ground
seed and whole seed were 54.5%, 81.8%, 81.8% and 90.9% for AL, AH, BL, and BH seeds
respectively.
The standard deviations obtained for ground seeds were larger than those obtained when the
whole seed method was used. We suggest that this is because C. papaya seeds are very oily
and after grinding particles tend to stick together and are then retained in the grinding mill. We
therefore recommend that the whole seed method is the most appropriate method for C.
papaya.

Test organizers:
Wen-Ju Yang, Department of Horticulture and Landscape Architecture, National Taiwan
University, Taipei, Taiwan, E-mail: wendy@ntu.edu.tw
I-Cheng Chen, Taiwan Seed and Seedling Improvement and Propagation Station, Taichung,
Taiwan, E-mail: ICChen@tss.gov.tw

Relevant ISTA Technical Committee:
Moisture Committee
ISTA reviewers appointed by the ISTA Moisture Committee:
Sergio Pasquini
Laura Bowden
Statistical reviewer appointed by the ISTA Secretariat:
Jean-Louis Laffont

OGM Document
Approved by ECOM Decision 20007                                                          Page 2 /36
Introduction
Papaya is an important tropical fruit crop, and the seeds classified as tree/shrub species.
Rules for moisture testing in ISTA relevant to papaya seeds have not yet been developed.
Papaya seeds have been classified into the category of tree and shrub species (ISTA rule
Table 9A Part 2). The seeds of papaya have intermediate storage behaviour, and the
moisture content of papaya seeds is higher than 65% after removing the sarcotesta at
harvest. Such high moisture content prevents grinding. Commercially, papaya seed moisture
content is dried to approximately 10 %. As a result, the texture of the papaya seed coat
becomes loose and brittle after drying, which means that it becomes impossible to meet the
standards required for coarse grinding. The ground seed does meet the fine grinding
standard; however, due to the high oil content of the seeds (approximately 30%) the ground
particles tend to stick to and are retained within the grinder. In addition, the oil content of dry
papaya seeds is approximately 30% which might influence the quality of grinding (Syed et al.,
2011). For the reasons mentioned above, papaya seeds probably belong to the group of
seeds for which the grinding method should not be applied. However, testing the necessity for
grinding is compulsory for introducing Carica papaya L. into the ISTA rules. This validation
study therefore tests the necessity for fine grinding against the whole seed method.

Material and methods
Seed material
Two lots (A and B) of Carica papaya L. seeds were obtained from fruits of ‘Tainung no. 2’, and
the moisture content was 67% to 70% at harvest. For each seed lot two moisture levels were
assessed, high level (10%-12%) and low level (5%-7%). Each seed lot was placed in a
dehumidifier at 40°C to decrease the moisture content. For each seed lot, a total of 1800g of
seeds were used, which was then split into two sub lots for each moisture level. At the end of
the moisture adjustment each sub lot was further subsampled into 45 smaller packets and
placed into sealed foil bags (11*19 cm). Among the 45 packets, 10 were for homogeneity
testing, 33 for the participating labs, and 2 for after-all check.
     A. 2 seed lots x 2 moisture x 10 packets = 40 for verification of moisture homogeneity
     B. 2 seed lots x 11 labs x 2 moistures x 3 (whole seed, grinding and 1 extra) = 132 for
           distributing to the participating labs
     C. 2 seed lots x 2 moisture x 2 packets = 8 for after-all check

The homogeneity of the seed lots was assessed by determining the moisture of 10 randomly
selected packets for each seed lot at each moisture level. Only the whole seed method was
used to determine the moisture content.

OGM Document
Approved by ECOM Decision 20007                                                          Page 3 /36
Participating laboratories
Samples were sent to 11 laboratories as listed in Table 1. All laboratories returned data sheets
by the end of 2018 with the exception of the laboratory in Zambia (ZM01) due to a delivery
problem.
Table 1. The participants of the validation test.
Participant Country
Gerarda de Boer The Netherlands
Baymolo Goma Zambia
Axel Göeritz Germany
Craig McGill New Zealand
Laura Bowden United Kingdom
Céline Herbert France
Papassorn Wattanakulpakin Thailand
Tapanee Attamangkune Thailand
Junaidi Indonesia
Greg Lozano/Czarina Mae Philippines
Realubit
Yu-Ling Li Separate Custom Territory of
Taiwan
Wen Ju Yang/TSIPS Separate Custom Territory of
Taiwan
Testing the necessity for grinding
The whole seed method was compared with the reference method, fine grinding method. Total
time of grinding must not exceed 2 min. The moisture contents of whole seeds and ground
seeds was determined by low constant temperature at 103°C for 17 hours. Comparative test
participants were asked to check that their grinding mill and oven met the qualifications of ISTA
rules 9.1.4.1 and 9.1.4.2. Since the moisture content in this study was less than 12% and the
thousand seed weight of C. papaya is less than 200g, the tolerance between two replicates is
0.3% according to ISTA rules Table 9B.
Statistical analysis of the results
The moisture data submitted by the participating laboratories was analysed to assess the
repeatability and reproducibility of the method. Statistical analyses were supported by Bo-Jein
Kuo, PhD -- member of the ISTA Statistics Committee.
Results
Moisture content determined for confirmation of homogeneity
The moisture content was determined using whole seeds. The average moisture contents of
Lot A seeds were 6.5±0.05% and 11.6±0.08% for the low (AL) and high (AH) seeds
respectively, and the largest differences between samples was within the tolerance range of
OGM Document
Approved by ECOM Decision 20007 Page 4 /360.3% (Table 1). Therefore, the homogeneity of Lot A seeds was confirmed. Lot B seeds were also confirmed to be homogeneous. The average moisture contents of Lot B seeds were 6.1±0.05% and 10.6±0.07 % for the low (BL) and high (BH) seeds, respectively. The difference between the low and high moisture levels were 5.2% and 4.5% for lot A and B seeds, respectively. A t test showed the high and low moisture levels to be significantly different (p
Table 2 T-test for difference between means of each moisture level of both seed lots obtained
by ground seed and whole seed methods.
 Seed        Method                Mean Variance           t-test    p value
  AL         Ground                 7.04    0.09            1.86        0.08
              seed
            Whole seed              6.84        0.04
   AH        Ground                11.68        0.15      -0.94         0.36
              seed
            Whole seed             11.80        0.03
   BL        Ground                 6.45        0.06        2.11        0.05
              seed
            Whole seed              6.26        0.03
   BH        Ground                10.49        0.12      -1.05         0.31
              seed
            Whole seed             10.61        0.03

Table 3 T-test for difference between means of the pooled data obtained by ground seed and
whole seed methods.
 Method                  Mean          Variance        t-test       p value
 Ground seed             8.92            5.14           0.08         0.94
 Whole seed              8.88            5.81
Note: The variances determined by ground seed and whole seed methods were not
significant different by F-test.

Table 4 Paired sample t-test for difference of moisture content determined between ground
seed and whole seed methods. Each laboratory contained 4 pairs of data, and the 11
laboratories generated 44 pairs in total.
                            df              Mean        t-test        p value
 Difference                 43              0.038        0.87          0.39

Tables 5 and 6 summarize the results of both seed lots. In the whole seed method, the
standard deviation was within the tolerance range (0.3%) and the BoxPlot graph showed no
outliers in either seed lot (Figure 1). The standard deviation obtained by grinding method was
larger than by whole seed method and only the standard deviation of BL seeds was smaller
than tolerance range. In addition, the only outlier was also determined by grinding method.
These data revealed that moisture content obtained by grinding method was not as stable as
for the whole seed method.
     The proportion of results with a difference of 0.3% or greater between the ground seed
and whole seed methods were 54.5%, 81.8%, 81.8% and 90.9% for AL, AH, BL, and BH
seeds respectively (Tables 5 and 6).

OGM Document
Approved by ECOM Decision 20007                                                    Page 6 /36
Figure 1 BoxPlot of the tested data. The moisture content was determined by low constant
temperature oven method. Each moisture level using whole (WS) and finely ground (G)
seeds.
OGM Document
Approved by ECOM Decision 20007 Page 7 /36Table 5 The moisture content of Lot A seeds determined by low constant temperature oven method. Each moisture level using whole and fine grinded seeds.
Data presented was the average of the duplicate working sample. The bold numbers represent results where the difference between whole and
finely ground seeds was out of tolerance (> 0.3%).
Lab
Seed Lot A TW01 Mean±s.d.
Treatment 1 2 3 4 5 6 7 8 9 10
Moisture (%) (AF) (%)
Whole seed 6.8 7.3 6.8 7.0 7.0 6.7 6.8 6.7 6.9 6.5 6.6 6.8±0.22
Low (AL)
Ground seed 7.2 7.2 6.5 7.0 7.5 7.1 7.4 6.7 7.1 6.7 7.0 7.0±0.30
Whole seed 11.8 12.1 11.7 11.9 12.0 11.7 11.9 11.7 11.9 11.5 11.7 11.8±0.17
High (AH)
Ground seed 11.5 11.8 11.8 11.7 12.5 11.0 11.9 11.8 11.8 11.2 11.5 11.7±0.30
TW01(AF) was the result of afterward test.
Table 6 The moisture content of Lot B seeds determined by low constant temperature oven method. Each moisture level using whole and fine grinded seeds.
Data presented was the average of the duplicate working sample. The bold numbers represent results where the difference between whole and
finely ground seeds was out of tolerance (> 0.3%).
Lab
Seed Lot B TW01 Mean±s.d.
Treatment 1 2 3 4 5 6 7 8 9 10
Moisture (%) (AF) (%)
Whole seed 6.3 6.6 6.1 6.4 6.5 6.0 6.3 6.0 6.4 6.0 6.2 6.3±0.21
Low (BL)
Ground seed 6.7 6.8 6.0 6.3 6.6 6.5 6.5 6.3 6.6 6.2 6.4 6.5±0.23
Whole seed 10.7 10.7 10.5 10.8 10.9 10.5 10.6 10.4 10.7 10.3 10.5 10.6±0.18
High (BH)
Ground seed 10.7 10.8 10.2 10.7 10.9 9.8 10.5 10.5 10.6 10.0 10.5 10.5±0.34
TW01(AF) was the result of afterward test.
OGM Document
Approved by ECOM Decision 20007 Page 8 /36Analysis of the Repeatability and Reproducibility of the methods
Table 7 contains the estimates of variance composition, repeatability and reproducibility standard-
deviations for each method. The estimates were calculated by using Linear Mixed model. The results
indicated that the repeatability and reproducibility was very high in both methods. Table 8 gives the
repeatability estimates for each laboratory. The results also revealed that repeatability and reproducibility
was higher when the moisture content was determined by the whole seed method.
Table 7 Estimates of the repeatability and reproducibility standard-deviations by using ground seed and
whole seed methods.
Method Random Variance % of Repeatability Reproducibility
Effect Composition Total standard- standard-
deviation deviation
Lab 0.0535 49
Ground
Lab*Sample 0.0473 43 0.0901 0.3300
seed
Residual 0.0081 7
Lab 0.0302 86
Whole
Lab*Sample 0.0026 7 0.0502 0.1880
seed
Residual 0.0025 7
Table 8 Estimate of the repeatability standard-deviation for each laboratory by using ground seed and whole
seed methods.
Repeatability standard-deviation
Laboratory
Ground Seed Whole Seed
01 0.1066 0.0357
02 0.0881 0.0414
03 0.0902 0.0803
04 0.0385 0.0490
05 0.0863 0.0464
06 0.0524 0.0356
07 0.0993 0.0247
08 0.1053 0.0539
09 0.0933 0.0518
10 0.0928 0.0599
11 0.1096 0.0522
Discussion and recommendations
The results of this validation study demonstrate that moisture contents determined by the ground seed and
whole seed methods were not significantly different. The results show that there is no need to grind papaya
seeds prior to moisture determination. Since both methods show high repeatability and reproducibility in
moisture determination and all participating laboratories have high repeatability (Tables 7 and 8), the
accuracy of the validation study is reliable.
The moisture content of papaya seeds is higher than 65% at harvest, and the moisture content of
commercially sold papaya seed is approximately 10%. The drying process causes the seed coat to become
loose and brittle, which prevents coarse grinding as particles fail to meet the standards for coarse grinding
(ISTA Rule 9.1.5.4). Therefore only fine grinding was tested against the whole seed method in this study.
The statistical analysis showed that both ground seed and whole seed methods for moisture content
obtained comparable variance, suggesting that both methods are acceptable for moisture determination in
papaya seeds. However, the difference of the paired data within tolerance range (0.3%) was 54.5%, 81.8%,
81.8% and 90.9% (Tables 5 and 6). Low moisture level seeds of Lot A did not exceed 75%. The two
methods could not be treated as identical methods.
The oil content of dry papaya seeds is approximately 30% (Syed et al, 2011), which might influence the
quality of grinding (Nijȅnstein, 2008). In the current test, we observed that following grinding particles
remained stuck to the grinder surface. This might explain why the variance obtained when using ground
seeds is larger. In addition, the only outlier observed was obtained by the ground seed method (Figure 1).
The results suggested that the whole seed method is much more stable than the ground seed method.
OGM Document Page 9 /36
Approved by ECOM Decision 20007Acknowledgements This work was supported by Seed Testing Laboratory of TSIPS (Taiwan Seed Improvement and Propagation Station), who provided the seed used in the validation study. We also thank the participating laboratories, test plan reviewers, and ISTA Secretariat. References Syed, H.M, S P Kunte, B.A. Jadhav, and R. V. Salve, 2011. Extraction and characterization of papaya seed oil. Elixir Agriculture 37A 4102-1405. Nijȅnstein Harry. 2008. Grinding in ISTA moisture testing. OGM Document Page 10 /36 Approved by ECOM Decision 20007
Validation of temperatures used in germination test of Brassica
                            napus
Ruojing Wang and Julie Lu
Seed Science and Technology Section, Canadian Food Inspection Agency, 301- 421 Downey Road,
Saskatoon, S7N 4L8 SK, Canada

Summary
An ISTA validation study on the germination temperatures for Brassica napus was carried out to provide
scientific data and evidence for rule proposals and harmonization. Eight ISTA-accredited laboratories in five
countries participated in the study. Six seed lots varying in varieties, spring and winter types, and
germination levels were used for the study. The germination tested at two alternating temperatures:
1525°C (Canadian M&P, AOSA Rules) and 2030°C (ISTA Rules & AOSA Rules), and two constant
temperatures: 25°C (Canadian M&P) and 20°C (ISTA Rules). The germination conducted either on top of
papers or between papers with 8 hr light during the high-temperature phase without dormancy break
treatments. Counts of normal and abnormal seedlings and ungerminated seeds were collected according to
ISTA rules at 7 days. The data were analyzed using statistical programs of SAS, ISTAgermMV, and z-scores
to compare the germination results in four temperatures. The study showed the largest variation source was
among laboratories excluding seed lot, which was a designed factor. It was significantly different on
ungerminated seeds among temperatures. The percentages of ungerminated seeds were lower at
1525°C and 20°C. The testing repeatability and reproducibility at 20°C and 1525°C had a lower
standard deviation, therefore better performance. The Z-scores, the variation of the germination results from
means, at 20°C and 1525°C were lower in the percentages of normal seedlings, abnormal seedlings,
and ungerminated seeds. Testing results at 20°C and 1525°C also had higher accuracy for normal
seedlings and ungerminated seeds. In summary, the data supported that the tests at 20°C and 1525°C
result in higher normal seedlings and lower ungerminated seeds. More importantly, these two temperature
regimes will enhance testing reproducibility among labs and the harmonization among testing rules.

Introduction
Seed germination and seedling development is influenced by the environmental factors such as seed-bed,
besides internal factors, e.g., seed quality under the test. Temperature, moisture and air exchange (i.e., O2)
are the main external factors that will determine seed germination and seedling development. Different
species and cultivars will respond to germination temperatures differently, that is, base temperatures and
optimum temperatures are characteristics of a given species or cultivar (Kamkar et al., 2012; Gilbertson et
al., 2014; Andreucci et al., 2016; Derakhshan et al., 2018). In a germination test, when moisture is adequate,
both the rate and percentage of germination of viable seeds are controlled by germination temperature
(Kamkar et al., 2012; Derakhshan et al., 2018). And alternating temperature could reduce dormancy or
enhance germination (Qiu et al., 2006).
The testing rules, such as ISTA (International Seed Testing Association) International Seed Testing Rules,
aim to achieve testing uniformity; i.e., reproducible and repeatable results will be generated from different
labs or analysts for the same seed lots. Seed testing using standardized methods facilitates seed trade
domestically and internationally, as well as being used for seed certification and regulatory enforcement.
With a comparison of current seed testing rules or methods described by ISTA, AOSA and Canadian M&P,
all three testing rules provide different environment conditions for germination test of canola, Brassica napus
var. napus. The different rules specify two alternating temperatures: 1525°C (Canadian M&P, AOSA
Rules) and 2030°C (ISTA Rules & AOSA Rules), and two constant temperatures: 25°C (Canadian M&P)
and 20°C (ISTA Rules).
The objectives of this validation study on the four germination temperatures in Brassica napus was: 1) to
provide data as supporting evidence for proposals of testing rule amendment in Brassica napus; 2) to
promote testing rule harmonization; and 3)to ensure the accuracy and equivalency of the germination
methods .

Materials and Methods
Testing samples selection and preparation
Multiple seed lots with significantly different quality were used to evaluate the temperature impact. Six seed
lots in six varieties of B. napus (rapeseed) were sourced from Canada and Germany, including both spring
and winter type. Three levels of germination ranged from 80-95% were selected based on pre-tests. The low

OGM Document                                                                                Page 11 /36
Approved by ECOM Decision 20007
germination level was about 80-85%, the medium level was about 86-90%, and the high level was about 91-
95%.
Each selected seed lot was mixed and divided according to ISTA procedures into approximately 5 g sample
quantity. The total 56 samples were prepared, including samples for homogeneity test (10), extra samples
(10) for potential retest requests and testing samples for 4 temperatures with eight participating labs (36).
Prepared samples were randomly assigned through Microsoft Excel function for homogeneity test, four
temperatures and participating laboratories. The tolerance was calculated using ISTA PT program.
Testing methods
Four temperatures including two alternating temperatures, 2030oC and 1525oC and two constant
temperatures 20oC and 25oC were compared for germination following ISTA rule for seedling evaluation.
From our pre-test and multiple-laboratory referee study, we found the variation among laboratories was
larger than the variation among temperatures. As TP and BP are two substrata allowed in the three testing
rules for canola and each participant has their own preference during routine test. With a request, we
allowed TP or BP to be used to accommodate their available substrate, which was a modification from the
testing plan. To minimize testing variation, the method for conducting the validation study was standardized
(Table 1).
Table 1. Germination method of the validation study of temperature comparison in B. napus
Temperature Number of Substrate First Final Breaking Light
(°C) seeds x count (d) count (d) dormancy
rep
2030 100 x 4 TP/BP 5 7 None Light 8 hr/dark 16
hr
1525 100 x4 TP/BP 5 7 None Light 8 hr/dark 16
hr
20 100 x4 TP/BP 5 7 None Light 8 hr/dark 16
hr
25 100 x4 TP/BP 5 7 None Light 8 hr/dark 16
hr
Participating laboratories
Participating laboratories in the validation study were confirmed that met the following qualification:
• ISTA accredited laboratories with the accreditation scope of the germination in Brassica napus.
• Expressed willingness and accept the obligation to conduct the tests required and to provide data
for the validation study.
• Have the skilled personnel, appropriate facilities and equipment recommended for performing the
test.
Eight laboratories from multiple locations in Canada, USA, France, Sweden, and Scotland participated in the
validation study. The participating laboratories tested samples between February 1 and March 30, 2019
following the provided instruction.
Data analysis
A standard data collecting sheet was provided to each participant in order to obtain the same information in
the same format. All participants submitted data with normal, abnormal, dead seeds and ungerminated
seeds, except for lab 4 which submitted data for normal seedlings only. Since “ungerminated (fresh) seeds”
were reported as “0” for all submitted data, here all data presented as sum of dead and fresh as
“ungerminated seeds”. The data received from participants was checked and the sum of the normal and
abnormal seedlings and ungerminated seeds should be 100 percent; if not, the percentages were calculated.
Tolerance of difference among the four replicates for each test was checked using the R package
ISTAgermMV and only one test in 20< =>30°C out of 192 tests was out of tolerance. This one test was not
removed as this was an additional indication of poor repeatability/reproducibility of the method. The outliers
were detected using Hampel’s method to identify xi as an outlier if Xi -X > 5.2 MAD, where MAD = median,
but not removed for final analysis, because they were true data from each participant and they were within
tolerance.
OGM Document Page 12 /36
Approved by ECOM Decision 20007Significant difference of the four germination temperatures in normal seedlings, abnormal seedlings and ungerminated seeds was evaluated using Generalized Linear Model (GLM) in SAS software at 95% confidence level, with seed lot and temperature as fixed effects and laboratory and replicate as random effects. Analysis of Variance (ANOVA) was generated to detect the variation sources. Data of normal and abnormal seedlings and ungerminated seeds were analyzed using softwere ISTAgermMV in R package following statistical tools “Inter laboratory tests using ISO 5725-2” developed by ISTA statistical committee. Comparison of means among germination temperatures and means among germination temperatures interacted with seed lots were generated. Repeatability and reproducibility were calculated with ISTAgermMV program, where, Repeatability quantifies the average variability of results within a laboratory, and Reproducibility quantifies the average variability among laboratories. Testing result variation in each participating laboratory was also analyzed using z-scores, which compare the distance of the participants’ results from the overall sample mean of all participants under each temperature for each seed lot. Accuracy is a combination of trueness or bias and precision using z-scores. Average accuracy of the eight participating laboratories over the six seed lots was used to indicate testing accuracy under each temperature. The calculation formula for accuracy was submitted in data analysis sheets. Results Variation sources on the testing results of the percentage of normal seedlings, abnormal seedlings and ungerminated seeds The analysis of variance on the percentage of normal seedlings, abnormal seedlings and ungerminated seeds showed the lab is the biggest variation source for normal and abnormal seedlings(Table 2 and 3). And the temperature was the biggest source significantly (p=0.0094) impacted on the percentage of ungerminated seeds, excluding the designed factor of seed lots (Table 4). Table 2. Analysis of variance (ANOVA) on the percentage of normal seedlings in four germination temperatures and six seed lots among eight testing laboratories. Source DF Type III SS Mean Square F Value Pr > F temp 3 455.61 151.87 2.48 0.0889 lot 5 8155.84 1631.17 21.16
Source              DF         Type III SS       Mean Square          F Value           Pr > F
   temp                 3           151.83             50.60               1.36            0.2857
   lot                  5           834.34             166.87              2.90            0.0298
   temp*lot            15           143.47              9.56               0.69            0.7923
   lab                  6          5550.61             925.10             11.46
Figure 1. Box plots of normal seedlings, abnormal seedlings and ungerminated seeds as affected by
germination temperatures.

Temperature affected normal seedlings, abnormal seedlings, and ungerminated seeds interacting with seed
lots (Figure 2). Alternating temperatures had lower ungerminated seeds. For seed lot 6 with the lowest
germination percentage among the six seed lots, 15 25oC produced the highest normal seedlings, and
the least ungerminated seeds, while 25oC had the opposite results. Germination results were generally
consistently superior at temperatures of 15 25oC and 20oC across the six seed lots. The germination
results had consistently larger variation in 20 30oC among seed lots.

OGM Document                                                                           Page 15 /36
Approved by ECOM Decision 20007
Figure 2. Box plots of normal seedlings, abnormal seedlings, and ungerminated seeds as affected by
germination temperatures and seed lots.

Testing uniformity among participating laboratories as affected by the germination temperature

The testing uniformity of participating laboratories was assessed with repeatability, which is an indicator for
variation within a lab; and reproducibility, which is an indicator for variation among labs. The statistical
values of repeatability and reproducibility were calculated using ISTAgermMV.
The repeatability was acceptable for all four temperatures, as the dispersion factors of repeatability on
normal and abnormal seedlings and ungerminated seeds were all around 1.00. (Table 5). However, the
standard deviation of repeatability is consistently lower in 15 25oC , better performance with in a lab.
The standard deviation of reproducibility among laboratories with all data sets was much lower in 1525°C
and 20°C than the other two temperatures for normal seedlings, abnormal seedlings, and ungerminated
seeds. Other standard deviations of 15 25oC and 20oC under lab and under lot*lab were also all
consistently lower than the other two temperatures (Table 5).
Table 5. Comparison of repeatability and reproducibility results of percentages of normal seedlings,
abnormal seedlings, and ungerminated seeds among four germination temperatures over six seed lots

OGM Document                                                                                Page 16 /36
Approved by ECOM Decision 20007
*Please note there are missing data from one lab for abnormal seedlings and ungerminated seeds.
                             Repeatability     Dispersion    Reproducibility    Lab      Lot x Lab
 Temperature       Mean           SD             factor            SD            SD         SD
                                            Normal seedlings
 1525°C           91           2.58             0.91              3.69           1.99         1.73
 20  30°C         90           3.13             1.03              6.71           4.79         3.50
 20°C                91           2.67             0.95              4.15           2.28         2.21
 25°C                90           2.51             0.83              5.17           3.89         2.31
                                           Abnormal seedlings
 1525°C            7           2.30             0.91              3.62           2.13         1.82
 20  30°C          7           2.69             1.02              5.61           4.10         2.74
 20°C                 6           2.20             0.92              3.55           2.15         1.77
 25°C                 7           2.37             0.93              4.90           3.63         2.28
                                          Ungerminated seeds
 1525°C            2           1.56             1.04              1.86           0.37         0.94
 20  30°C          3           1.80             0.99              2.67           1.31         1.48
 20°C                 3           1.85             1.13              1.97           0.49         0.46
 25°C                 4           1.96             1.02              2.59           1.40         0.95

Figure 3. *Statistical values of repeatability and reproducibility of normal seedlings, abnormal seedlings, and
ungerminated seeds in each of the four germination temperatures.

*Please note the value was calculated using ISTAGermMV developed by ISTA Statistical committee, the
smaller the value was, the better the performance of the temperatures would be.
Among four temperatures in Figure 3, the statistical values of reproducibility were the highest at 2030oC
for normal and abnormal seedlings and ungerminated seeds, the least reproducible temperature for the
germination. The statistical values of 15 25oC and 20oC were lower among four temperatures, i.e., higher
repeatability and reproducibility.
Testing result variation among participating laboratories was also analyzed using z-scores, the distance from
the means of each lot, under four germination temperatures. Usually the variation of testing results within
one standardized deviation, z-score =1, is an acceptable tolerance. Figure 4.1 -3 showed the least variation
among participating labs in % normal and abnormal seedlings at 20oC and in %ungerminated seeds at 15oC
 25oC.

OGM Document                                                                                Page 17 /36
Approved by ECOM Decision 20007
o
2 20 C 2 25oC
1 1
Z-scores
Z-scores
0 0
-1 -1
-2 -2
Lab1 Lab2 Lab3 Lab4 Lab5 Lab6 Lab7 Lab8 Lab 1 Lab 2 Lab 3 Lab 4 Lab 5 Lab 6 Lab 7 Lab 8
Lot 1
Lot 2
Lot 3
Lot 4
Lot 5
Lot 6
2
1525oC 2 2030oC
1 1
Z-scores
Z-scores
0 0
-1 -1
-2 -2
Lab 1 Lab 2 Lab 3 Lab 4 Lab 5 Lab 6 Lab 7 Lab 8 Lab 1 Lab 2 Lab 3 Lab 4 Lab 5 Lab 6 Lab 7 Lab 8
Figure 4.1. Laboratory Z-scores, the variation of each lab from the means, measured for % normal
seedlings under each temperature with six seed lots.
o
2 20 C 2 25oC
1 1
Z-scores
Z-scores
0 0
-1 -1
-2 -2
Lab1 Lab2 Lab3 Lab4 Lab5 Lab6 Lab7 Lab8 Lab1 Lab2 Lab3 Lab4 Lab5 Lab6 Lab7 Lab8
Lot 1
Lot 2
Lot 3
Lot 4
Lot 5
Lot 6
2
1525oC 2
2030oC
1 1
Z-scores
Z-scores
0 0
-1 -1
-2 -2
Lab1 Lab2 Lab3 Lab4 Lab5 Lab6 Lab7 Lab8 Lab1 Lab2 Lab3 Lab4 Lab5 Lab6 Lab7 Lab8
Figure 4.2. Laboratory Z-scores, the variation of each lab from the means, measured for % abnormal
seedlings under each temperature with six seed lots
OGM Document Page 18 /36
Approved by ECOM Decision 20007o
2 20 C 2
o
25 C
1 1
Z-scores
Z-scores
0 0
-1 -1
-2 -2
Lab1 Lab2 Lab3 Lab5 Lab6 Lab7 Lab8 Lab 1 Lab 2 Lab 3 Lab 5 Lab 6 Lab 7 Lab 8
Lot 1
Lot 2
Lot 3
Lot 4
Lot 5
Lot 6
2 1525oC 2 2030oC
1 1
Z-scores
Z-scores
0 0
-1 -1
-2 -2
Lab 1 Lab 2 Lab 3 Lab 5 Lab 6 Lab 7 Lab 8 Lab 1 Lab 2 Lab 3 Lab 5 Lab 6 Lab 7 Lab 8
Figure 4.3. Laboratory Z-scores, the variation of each lab from the means, measured for %ungerminated
seeds under each temperature with six seed lots.
Testing Accuracy:
The average accuracy values among the participants showed that 20°C and 1525°C had the higher
accuracy for the evaluation of normal seedlings, and 20°C had the highest accuracy for abnormal seedlings,
and 20°C and 1525°C had much higher accuracy for ungerminated seeds (Figure 5).
0.85
20oC
0.80 25oC
15-25oC
20-30oC
0.75
0.70
Accuracy
0.65
0.60
0.55
0.50
Normal Abnormal Ungerminated
Temperature oC
Figure 5. Average accuracy* among four temperatures measured for percentages of normal, abnormal
seedlings and ungerminated seeds with six seed lots.
*Note: The smaller the value is, the higher the accuracy will be.
Conclusions and recommendations
The study showed the largest variation source was among laboratories, excluding seed lots as a designed
factor. The percentage of normal seedlings tended to be higher at 20°C and 1525°C, although no
significant difference was detected among the four temperatures. It was significantly different on
ungerminated seeds among temperatures, and the percentage of ungerminated seeds was lower at
1525°C and 20°C. The testing repeatability and reproducibility at 20°C and 1525°C had much low
standard deviations than the other two temperatures. Z-score showed that 20°C and 1525°C had less
variation from means on the percentages of normal seedlings, abnormal seedlings and ungerminated seeds
among seed lots and laboratories. These two germination temperatures also had higher accuracy for the
evaluation of seedlings and ungerminated seeds. To promote harmonization among testing rules, we
recommend ISTA and AOSA revise testing temperatures for B. napus as 20°C and 1525°C, which will
result in higher normal seedlings and lower ungerminated seeds. More importantly, these two temperature
OGM Document Page 19 /36
Approved by ECOM Decision 20007regimes will enhance testing repeatability within a lab, reproducibility among labs, and the harmonization
among testing rules, which will ensure the accuracy and equivalency of the germination methods.
Acknowledgements
Organizers sincerely thank ISTA germination committee for approval of the project, testing plan reviewers,
Simon Goertz and Zita Ripka for their suggestions and comments, eight participating laboratories for their
data contribution, and ISTA Statistical committee, especially Jean-Louise Laffont for data advice and
software.
References:
1. Andreucci, M.P., Moot, D.J., Black, A.D. and Sedcole, R. (2016). A comparison of cardinal
temperatures estimated by linear and nonlinear models for germination and bulb growth of forage
brassicas. European Journal of Agronomy, 81, 52-63.
2. Association of Seed Analysts (AOSA) Rules for testing seeds, (2019), AOSA
3. Canadian Methods and Procedures for Testing Seed, (2019), Canadian Food Inspection Agency.
4. Derakhshan, A., Bakhshandeh, A., Siadat, S.A., Moradi-Telavat, M-R. and Andarzian, S.B. (2018).
Quantifying the germination response of spring canola (Brassica napus L.) to temperature. Industrial
Crops & Products, 122, 195-201.
5. Gilberston, P.K., Berti, M.T. and Johnson, B.L. (2014). Borage cardinal germination temperatures
and seed development. Industrial Crops and Products, 59, 202-209.
6. International Rules for Seed Testing, (2019), International Seed Testing Association (ISTA)
7. ISTA Method Validation for Seed Testing (V.1.0), (2006), ISTA
8. Kamkar, B., Al-Aladhmadi, M.J., Mahdavi-Damghani, A. and Villalobos, F.J., (2012). Quantification of
the cardinal temperatures and thermal time requirement of opium poppy (Papaver somniferum L.)
seeds to germinate using non-liner regression models. Industrial Crops and Products, 35, 192-198.
9. Qiu, J., Bai, Y., Coulman, B., and Romo, J.T. (2006). Using thermal time models to predict seedling
emergence of orchardgrass (Dactylis glomerata L.) under alternating temperature regimes. Seed
Science Research 16, 261–271.
OGM Document Page 20 /36
Approved by ECOM Decision 20007Appendix 1. ISTA Proposal
CURRENT VERSION: Table 5A Part 1. Detailed methods for germination tests: Agriculture and
Vegetable seeds
Species Substrate Temperature* First Final Recommendation Additional Additional
(°C) count count s for breaking directions advice
(d) (d) dormancy
1 2 3 4 5 6 7 8
Brassica BP; TP 2030; 20 5 7 KNO3 ; Prechill - -
napus
PROPOSED REVISION: Table 5A Part 1. Detailed methods for germination tests: Agriculture and
Vegetable seeds
Species Substrate Temperature* First Final Recommendations Additional Additional
(°C) count count for breaking directions advice
(d) (d) dormancy
1 2 3 4 5 6 7 8
Brassica BP; TP 2030; 20 5 7 KNO3 ; Prechill - -
napus var. 15 25
napus
OGM Document Page 21 /36
Approved by ECOM Decision 20007Validation study to support a modification to the evaluation
criteria for normal seedlings of Helianthus annuus L.
Takayuki Okuda
Takii & Company, Limited, C.P.O.BOX7 Kyoto, Japan (takayuki-okuda@takii.co.jp)
Summary
The objective of this validation study is to modify the root criteria of Helianthus seedling evaluation.
The validation study showed no significant differences between seedlings with no defect and with defective
primary root with well-developed secondary roots, in latter growth traits such as height of plant, total leaf
number, diameter of disk and diameter of flower. A slight difference for only one variety was observed in
days to flower.
The results of this validation study indicate that secondary roots of Helianthus may compensate for the
damage of the primary root and support the modification for the seedling evaluation criteria of Helianthus
root system from “A-2-1-1-1: the primary root is essential” to “A-2-1-1-2: the primary root may be replaced by
secondary roots”.
Introduction
It is prescribed in the ISTA rule that germination substrates of Helianthus annuus are BP, TPS, S and O. In
the germination test of Helianthus annuus, abnormal seedlings with damage to the primary root but with
sufficiently well-developed secondary roots are often found, especially in the paper towel test. While on the
other hand, few abnormal seedlings are found in the usable plant test. It might be considered that the
seedlings with a defective primary root but with well-developed secondary roots can grow sufficiently.
Preliminary experiments conducted in Takii’s laboratory in autumn 2017 and spring 2018 confirmed that the
seedlings for which the primary root cut off artificially, but with well-developed secondary roots, grow as well
as the intact seedlings. However, this study was not sufficient evidence to modify the criteria as the number
of seedlings initially tested was low.
The Germination Committee members recommended to conduct an additional test with a higher number of
seedlings tested compared to the preliminary experiment, and with seedlings which have naturally defective
primary root, instead of artificially creating the defect. Indeed, a seedling with naturally defective primary root
might not have the same physiological capacities as normal seedlings with artificial damaged do. Also, four
different types of Sunflower seeds, including edible ones, were tested during the validation study. This
additional test was therefore carried out in order to provide sufficient evidence to support the proposed
change of group regarding the root criteria of Helianthus annuus seedlings.
Material and methods
Seed material
Four samples of Helianthus annuus were used in this study. Two of them (1 and 2) are ornamental varieties
which are edible, and another two (3 and 4) are oil sunflower varieties.
Lot Variety name Type Production
year
1 Sunrich fresh Orange Cut flower variety 2016
2 Good smile Bedding and pot variety; Dwarf 2011
type
3 Green manure Oleic variety 2017
sunflower
4 Kids smile Mid-oleic variety; Dwarf type 2016
Methods
Ten replicates of 100 seed samples per each variety were germinated at 20⇔30℃ (16 h / 8 h respectively)
using paper towel. Seven days after sowing, normal seedlings and seedlings with defective primary root
were selected as follows:
Normal seedling: 16 seedlings
Primary root defected with well-developed secondary root: 8 seedlings
OGM Document Page 22 /36
Approved by ECOM Decision 20007Primary root defected with poorly-developed secondary root: 8 seedlings
For samples of Lots 1 and 3, the seedlings were planted on big planter (inner dimension; 65cm x 35cm x
25cm) with sterilized field soil. For samples of Lots 2 and 4 (dwarf types), the seedlings were planted in pots
(diameter; 15cm) with field soil. When fully bloomed, basic traits such as height of plant, total leaf number,
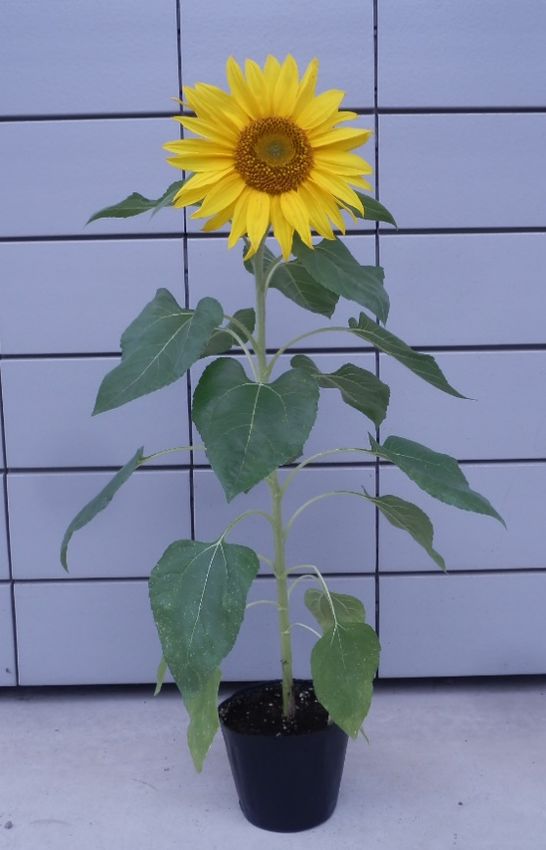
days to flower, diameter of disk, and diameter of flower were recorded or measured individually (Figure 1).
Height of plant
Diameter of disk Diameter of flower
Figure 1. Measurement basis of height of plant, diameter of disk and diameter of flower (Kids smile).
Outline of cultivation
Sowing day: 2018-08-22
Planting day: 2018-08-29
Research finished: 2018-11-13
After planting, plants were cultivated in the greenhouse. Cultural environment was as follows:
Figure 2. Temperature during test period
OGM Document Page 23 /36
Approved by ECOM Decision 20007Figure 3. Day length during test period Figure 4. Period of days to flower per varieties Statistical analysis Measured data was checked to see whether the traits measured showed a significant difference between normal seedlings and seedlings which primary root defected with well-developed secondary roots, and between normal seedlings and seedlings which primary root defected with poorly-developed secondary roots. The analysis was performed by the ISTA Statistics Committee. 1. Data exploration with side-by-side box plots • Plant height (cm): OGM Document Page 24 /36 Approved by ECOM Decision 20007
*Remark
   Normal:      Normal seedling
   Defect group 1: Primary root defected with well-developed secondary root
   Defect group 2: Primary root defected with poorly-developed secondary root

OGM Document                                                                    Page 25 /36
Approved by ECOM Decision 20007
•   Total leaf number:

OGM Document                      Page 26 /36
Approved by ECOM Decision 20007
•   Days to flower:

OGM Document                      Page 27 /36
Approved by ECOM Decision 20007
•   Diameter of disk (cm):

OGM Document                      Page 28 /36
Approved by ECOM Decision 20007
•   Diameter of flower (cm):

The box plots don’t reveal any particular problems with the data. The ISTA Statistics committee note that the
variation within varieties is different across varieties.

OGM Document                                                                               Page 29 /36
Approved by ECOM Decision 20007
2. Statistical model

The following linear model has been fitted to each trait:
                                                yijk = µ + α i + β j + (αβ )ij + eijk
in which:
.   yijk    is the value of the trait for Category i (Normal, Defect gp 1, Defect gp 2) observed in plant k from
Variety j.
. μ is the intercept.
.   αi     is the fixed effect of Category i.

.   βj     is the fixed effect of Variety j.

.   (αβ )ij   is the interaction effect between Category i and Variety j.

.   eijk   are the residuals. As the box plots exhibit different variations across varieties, a heteroscedastic model
is considered (residual variances are assumed to be different for each variety):
                                                     ei1k ~ i.i.d. N (0, σ Variety 1 )
                                                                            2

                                                     ei2k ~ i.i.d. N (0, σ Variety 2 )
                                                                            2

                                                     ei3k ~ i.i.d. N (0, σ Variety 3 )
                                                                            2

                                                     ei4k ~ i.i.d. N (0, σ Variety 4 )
                                                                            2

This model has been fitted with SAS.

3. Results

Residual variance estimates, ANOVA tables and Least Square Means are provided below.
For all the traits, the Variety effect is highly significant.
The Category effect and its interaction with Variety are not significant for Plant Height, Diameter of Disk and
Diameter of Flower.
For Total Leaf number, the Category effect is significant overall (Defect group 2 significantly different from
Normal).
For Days to Flower, Defect group 1 and 2 are significantly different from Normal for Variety Kids smile, and
Defect group 2 is significantly different from Normal for Variety Sunrich Fresh Orange.

OGM Document                                                                                       Page 30 /36
Approved by ECOM Decision 20007
Plant height (cm) Residual variance estimates Variety Variance Good smile 3.89 Green manure sunflower 35.34 Kids smile 35.56 Sunrich fresh Orange 84.31 Tests of fixed effects Effect Num DF Den DF F Value Pr > F Variety 3 116 3693.80
Total leaf number

Residual variance estimates
Variety                           Variance
Good smile                             3.21
Green manure sunflower                 9.70
Kids smile                             2.18
Sunrich fresh Orange                   3.83

Tests of fixed effects
Effect                             Num DF         Den DF                F Value      Pr > F
Variety                                 3           116                 133.53
Days to flower

Residual variance estimates
Variety                           Variance
Good smile                             7.15
Green manure sunflower              19.08
Kids smile                          26.12
Sunrich fresh Orange                15.71

Tests of fixed effects
Effect                             Num DF         Den DF                 F Value                 Pr > F
Variety                                 3           116                  137.42
Disk diameter (cm)

Residual variance estimates
Variety                           Variance
Good smile                             0.38
Green manure sunflower                 0.53
Kids smile                             0.87
Sunrich fresh Orange                   0.90

Tests of fixed effects
Effect                             Num DF         Den DF                 F Value     Pr > F
Variety                                 3           116                  127.84
Flower diameter (cm)

Residual variance estimates
Variety                           Variance
Good smile                             0.83
Green manure sunflower                 1.67
Kids smile                             4.33
Sunrich fresh Orange                   3.23

Tests of fixed effects
Effect                             Num DF         Den DF                 F Value     Pr > F
Variety                                 3           116                  463.00
Conclusions
The seedlings with a defective primary root and with non-sufficiently developed secondary roots have the
tendency to an early flowering and a decreased number of leaves compared to normal seedlings.
As to variety Kids smile, defect group 1; primary root defected with well-developed secondary root is
significantly different from normal seedlings for days to flower. However except for this variety and this trait,
all other characteristics measured show no significant difference between normal seedlings and seedlings
with defective primary root but with well-developed secondary roots.
The results of this validation study indicate that secondary roots of Helianthus may compensate for the
damage of the primary root and support the modification for the seedling evaluation criteria of Helianthus
root system from “A-2-1-1-1: the primary root is essential” to “A-2-1-1-2: the primary root may be replaced by
secondary roots”.

OGM Document                                                                                  Page 36 /36
Approved by ECOM Decision 20007
You can also read