Mitochondrial-Related Transcriptome Feature Correlates with Prognosis, Vascular Invasion, Tumor Microenvironment, and Treatment Response in ...
←
→
Page content transcription
If your browser does not render page correctly, please read the page content below
Hindawi
Oxidative Medicine and Cellular Longevity
Volume 2022, Article ID 1592905, 28 pages
https://doi.org/10.1155/2022/1592905

Research Article
Mitochondrial-Related Transcriptome Feature Correlates with
Prognosis, Vascular Invasion, Tumor Microenvironment, and
Treatment Response in Hepatocellular Carcinoma

          Yizhou Wang ,1 Feihong Song ,2 Xiaofeng Zhang ,1 and Cheng Yang                                            2

          1
              Fourth Department of Hepatic Surgery, Third Affiliated Hospital of Second Military Medical University, Shanghai 200438, China
          2
              Department of Special Treatment, Third Affiliated Hospital of Second Military Medical University, Shanghai 200438, China

          Correspondence should be addressed to Xiaofeng Zhang; zhangxfw@aliyun.com and Cheng Yang; yangcheng200712_1@163.com

          Yizhou Wang and Feihong Song contributed equally to this work.

          Received 8 November 2021; Accepted 30 March 2022; Published 30 April 2022

          Academic Editor: Junmin Zhang

          Copyright © 2022 Yizhou Wang et al. This is an open access article distributed under the Creative Commons Attribution License,
          which permits unrestricted use, distribution, and reproduction in any medium, provided the original work is properly cited.

          Background. Hepatocellular carcinoma (HCC) is the most common subtype of primary liver cancer, which was highly correlated
          with metabolic dysfunction. Nevertheless, the association between nuclear mitochondrial-related transcriptome and HCC
          remained unclear. Materials and Methods. A total of 147 nuclear mitochondrial-related genes (NMRGs) were downloaded
          from the MITOMAP: A Human Mitochondrial Genome Database. The training dataset was downloaded from The Cancer
          Genome Atlas (TCGA), while validation datasets were retrieved from the International Cancer Genome Consortium (ICGC)
          and Gene Expression Omnibus (GEO). The univariate and multivariate, and least absolute shrinkage and selection operator
          (LASSO) Cox regression analyses were applied to construct a NMRG signature, and the value of area under receiver operating
          characteristic curve (AUC) was utilized to assess the signature and nomogram. Then, data from the Genomics of Drug
          Sensitivity in Cancer (GDSC) were used for the evaluation of chemotherapy response in HCC. Results. Functional enrichment
          of differentially expressed genes (DEGs) between HCC and paired normal tissue samples demonstrated that mitochondrial
          dysfunction was significantly associated with HCC development. Survival analysis showed a total of 35 NMRGs were
          significantly correlated with overall survival (OS) of HCC, and the LASSO Cox regression analysis further identified a 25-
          NMRG signature and corresponding prognosis score based on their transcriptional profiling. HCC patients were divided into
          high- and low-risk groups according to the median prognosis score, and high-risk patients had significantly worse OS (median
          OS: 27.50 vs. 83.18 months, P < 0:0001). The AUC values for OS at 1, 3, and 5 years were 0.79, 0.77, and 0.77, respectively.
          The prognostic capacity of NMRG signature was verified in the GSE14520 dataset and ICGC-HCC cohort. Besides, the NMRG
          signature outperformed each NMRG and clinical features in prognosis prediction and could also differentiate whether patients
          presented with vascular invasions (VIs) or not. Subsequently, a prognostic nomogram (C-index: 0.753, 95% CI: 0.703~0.804)
          by the integration of age, tumor metastasis, and NMRG prognosis score was constructed with the AUC values for OS at 1, 3,
          and 5 years were 0.82, 0.81, and 0.82, respectively. Notably, significant enrichment of regulatory and follicular helper T cells in
          high-risk group indicated the potential treatment of immune checkpoint inhibitors for these patients. Interestingly, the NMRG
          signature could also identify the potential responders of sorafenib or transcatheter arterial chemoembolization (TACE)
          treatment. Additionally, HCC patients in high-risk group appeared to be more sensitive to cisplatin, vorinostat, and
          methotrexate, reversely, patients in low-risk group had significantly higher sensitivity to paclitaxel and bleomycin instead.
          Conclusions. In summary, the development of NMRG signature provided a more comprehensive understanding of
          mitochondrial dysfunction in HCC, helped predict prognosis and tumor microenvironment, and provided potential targeted
          therapies for HCC patients with different NMRG prognosis scores.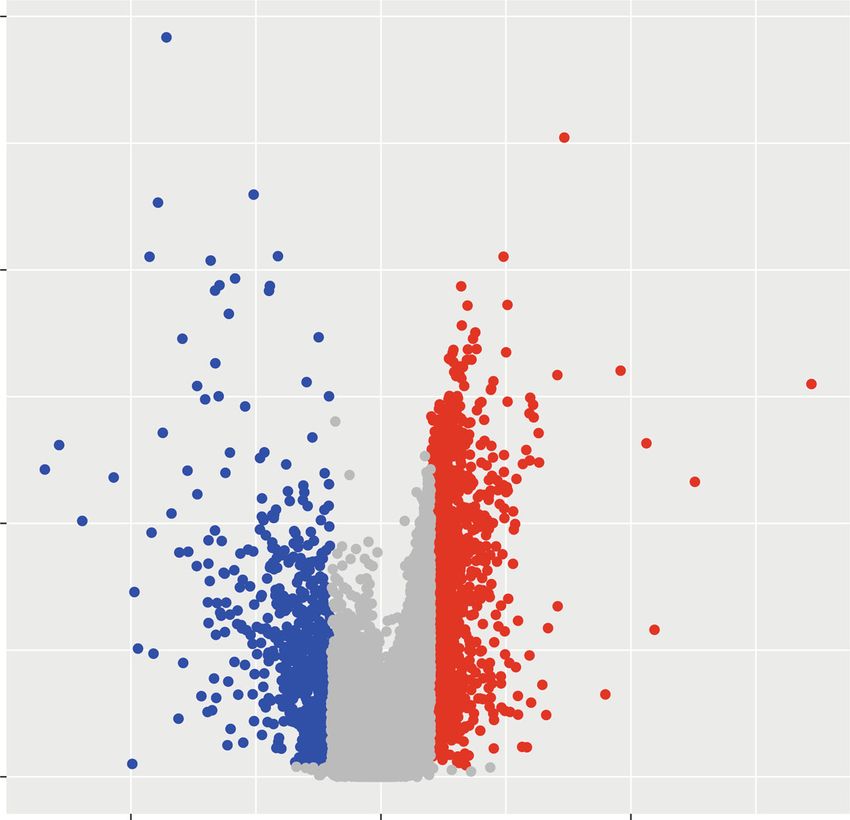
2                                                                                                      Oxidative Medicine and Cellular Longevity

                   GEPIA2 Database: 369 HCC tissues vs 50 paired normal tissues

               2, 207 DEGs identified                        Functional dysfunctions of mitochondria
                                                            EGs
                                             rial related D
                                       ochond
                                147 Mit
                                                                        Training cohort
                   Univariate cox regression analysis                                             TCGA-LIHC cohort: 365 HCC patients

                            35 NMRGs associated with OS

                     LASSO cox regression analysis                          Multivariate cox regression analysis

                                                                         ients
                                                                  Coeffic
                                                                       Validation cohorts
                Identification of a 25-NMRGs signature                                         ICGC-HCC cohort & GSE14520

                 Stratify patients into high- and low- risk groups                      Macro-VI Group VS Micro-VI Group VS None-VI Group

        Kaplan-Meier curves                           Prognostic nomogram                        Prognosis score        Kaplan-meier curves
                       +                                   +
                  ROC curves                          Functional enrichment
                      +                                    +
         Clinical association                         Tumor microenvironment
                                                           +
                                                      Target therapy

Figure 1: The flow-process diagram for the construction of the NMRG signature and exploration of clinicopathological association and
potential targeted therapy.

1. Introduction                                                                   recurrence and poor performance status [6]. However, the
                                                                                  limitation in the detection of VI hinders its application as
Globally, primary liver cancer is one of the most aggressive                      a robust biomarker for determining the clinical outcomes
and difficult-to-treat malignant cancers, with a 5-year sur-                        of HCC patients. Therefore, novel prognostic models and
vival rate of less than 21% [1]. Hepatocellular carcinoma                         better prognostic molecular markers are urgently required
(HCC) comprises the most common type of primary liver                             to improve the HCC management and accurately predict
cancer, accounting for 90% of all liver cancer cases [2].                         clinical outcomes of HCC, especially for the AFP-negative
Besides, patients with HCC were often diagnosed in                                HCC.
advanced stage owing to no apparent symptoms in early                                 The liver and mitochondria are the two centers of
stage, probably leading to the poor survival. With the                            metabolism at the whole organism and cellular levels,
approval of sorafenib, lenvatinib, and other immunotherapy                        respectively. Emerging evidences clearly suggested that
regimens for advanced HCC patients, the survival of metas-                        mitochondrial dysfunction or maladaptation contributed to
tatic or unresectable HCC patients has been improved in                           the detrimental effects on hepatocyte bioenergetics, reactive
these years, but the therapeutic outcomes are still largely                       oxygen species (ROS) homeostasis, endoplasmic reticulum
unsatisfactory [3, 5]. As is known, alpha-fetoprotein (AFP)                       (ER) stress, inflammation, and cell death [7–9]. The liver
is the most widely used serum biomarker for the HCC detec-                        mitochondria have unique features because the liver plays
tion and treatment evaluation; however, it is not a robust                        a central role in the regulation of a variety of metabolic func-
and specific biomarker for HCC [4]. In addition, vascular                          tions including maintaining the homeostasis of carbohy-
invasion (VI), as a critical risk factor, is the main herald of                   drate, lipid, amino acid, and protein. Previous studies have
HCC recurrence though for HCC patients receiving surgical                         revealed critical roles of mitochondrial genes in the carcino-
resection [5]. Vascular invasion could be divided into two                        genesis and development of HCC. For example, mitochon-
subtypes, macroscopic vascular invasion and microscopic                           drial trans-2-enoyl-CoA reductase (MECR) had been
vascular invasion, both were highly associated with tumor                         identified as an oncogene which was significantly
Oxidative Medicine and Cellular Longevity 3
Table 1: Clinicopathological features of 365 HCC patients from the In this study, we initially analyzed the transcriptome
TCGA. profiling of 147 NMRGs and the corresponding clinical data
of patients with HCC from TCGA and then identified 35
Variables Number NMRGs having significant influence on the survival of
Total 365 HCC patients by the univariate Cox regression analysis. Sub-
Age Median (range) 61 [16, 90] sequently, we used the least absolute contraction and selec-
Gender Male 246 tion operator (LASSO) regression analysis and finally
Female 119 developed a novel 25-NMRG prognosis signature. Besides,
Alcohol consumption Yes 115
the prediction efficacy of the established NMRG prognosis
signature was verified in the validation datasets, including
No 250
ICGC-HCC cohort from the ICGC and GSE14520 from
AFP Median (range) 15 [14, 203540] ng/mL the GEO. Based on the NMRG signature, a nomogram was
VI Non-VI 211 further constructed to predict the prognosis of HCC. More-
Micro-VI 94 over, the good AUC values demonstrated the reliable and
Macro-VI 17 stable predicting ability of the prognosis signature and
Clinical stage Stage I 170 nomogram. The functional differentiation, tumor microen-
Stage II 84 vironment, and treatment response of precision therapy
between high- and low-risk groups were further investigated
Stage III 83
to promote the precision medicine for HCC patients. The
Stage IV 4 study design was mainly exhibited in a work flowchart
NA 24 (Figure 1).
Histological grading G1 55
G2 175 2. Materials and Methods
G3 118
2.1. Data Collection. The gene expression data and the clin-
G4 12 ical information of 365 HCC patients were collected from
NA 15 the Liver Hepatocellular Carcinoma (TCGA-LIHC) cohort
T stage T1 180 from TCGA which was regarded as the training dataset
T2 91 (Table 1), while the ICGC-HCC (namely, LIRI-JP) cohort
T3 78 with 260 patients and GSE14520 with 242 patients from
T4 13 the GEO were defined as two independent validation data-
sets. A comprehensive list of NMRGs was downloaded from
NA 3
the MITOMAP: A Human Mitochondrial Genome Database
N stage N0 248 (https://www.mitomap.org/MITOMAP, last updated date:
N1 4 January 15th, 2021), which comprised a total of 147 NMRGs.
NA 113
M stage M0 263 2.2. The Analysis of Differentially Expressed Genes in HCC.
The transcriptome data analysis between 369 HCC tumor
M1 3
tissues and 50 adjacent paired normal tissues was conducted
NA 99 online in the GEPIA (http://gepia2.cancer-pku.cn) for the
Hepatitis_B Yes 102 identification of the differentially expressed genes
No 263 (DEGs, ∣log 2 − fold change ðFCÞ ∣ >1, Q − value < 0:01)
Hepatitis_C Yes 56 between the HCC samples and normal samples. The visual-
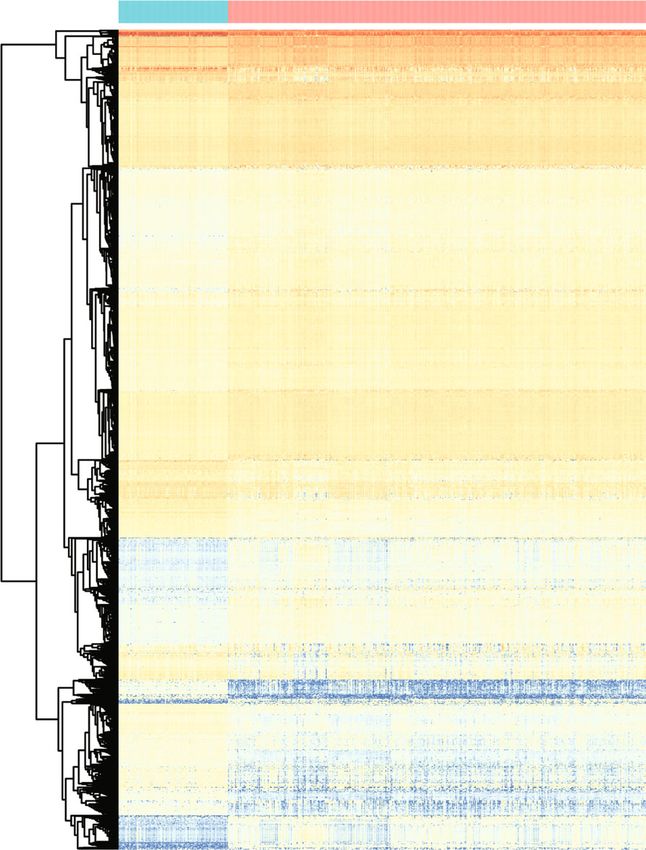
No 309 ization of the volcano plot and heatmap was performed
HCC: hepatocellular carcinoma; VI: vascular invasion; NA: not applicable.
using the “ggplot” package.
2.3. Signature Construction Based on Nuclear Mitochondrial-
Related Genes. The univariate Cox regression was used to
overexpressed in HCC cell lines [10]. Likewise, overexpres- identify OS-associated NMRGs. Next, the LASSO regression
sion of mitofusin1 (MFN1) in HCC cells promoted mito- model was selected to minimize the overfitting and identify
chondrial fusion and inhibited cell proliferation, invasion, the most significant survival-associated NMRGs in HCC
and migration via modulating metabolic shift from aerobic via the “glmnet” package. Meanwhile, the multivariate Cox
glycolysis to oxidative phosphorylation [11]. In addition, it regression analysis was then used to determine the corre-
has been proved that upregulation of aspartyl-tRNA synthe- sponding coefficients. The following formula based on a
tase (DARS2) promoted hepatocarcinogenesis through the combination of coefficient and gene expression was used to
MAPK/NFAT5 pathway [12]. However, most of these stud- calculate the prognosis score:
ies focused on a single gene instead of the integrated cluster
of mitochondrial-related genes. Therefore, it will be of more n
value to evaluate the role of all the mitochondrial-related Prognosis score = 〠 Genei ∗ coef i, ð1Þ
genes in the prognosis of HCC. i=1
4                                  Oxidative Medicine and Cellular Longevity

                                        Group
                                           15

                                           10

                                           5

                                           0

                                           –5

                                           –5

    Group
       N
       T
                    (a)

            Figure 2: Continued.
Oxidative Medicine and Cellular Longevity 5
150
100
–Log10 (adjp)
50
0
–5 0 5
Log2 (fold change)
(b)
qvalue
Mitochondrial inner membrane
ATP metabolic process
Mitochondrial protein complex
Electron transport chain
Respiratory electron transport chain
Inner mitochondrial membrane protein complex 0.03
ATP synthesis coupled electron transport
Electron transfer activity
Mitochondrial ATP synthesis coupled electron transport
Mitochondrial respirasome
Protein localization to mitochondrion
Establishment of protein localization to mitochondrion
Mitochondrial respiratory chain complex assembly 0.02
DNA–dependent ATPase activity
ATP–dependent chromatin remodeling
Protein targeting to mitochondrion
Establishment of protein localization to mitochodrial membrane
Mitochondrial respiratory chain complex I
Mitochondrial respiratory chain complex I assembly
Mitochondrial electron transport, NADH to ubiquinone
Protein insertion into mitochondrial membrane 0.01
Aeribic electron transport chain
Outer mitochondrial membrane protein complex
Mitochondrial electron tansport, cytochrome c to oxygen
Proton–transporting ATPase activity, rotational mechanism
ATPase activity, coupled to transmembrane
Movement of ions, rotational mechanism
Proton–transporting V–type ATPase complex
Mitochondrial respiratory chain complexIV
20 60
40 80
(c)
Figure 2: Mitochondrial dysfunction potentially promoted the hepatocarcinogenesis. (a) Transcriptional profiling of HCC and adjacent
paired normal tissues. (b) Differentially expressed genes (DEGs) between HCC and adjacent paired normal tissues. Red dots represented
significant upregulation and blue dots represented significant downregulation of DEGs in HCC tissues. (c) Identification of biological
functions via the GO pathway enrichment analysis.6 Oxidative Medicine and Cellular Longevity
⁎
MRPL3 HR: 8.62 (2.12 − 34.98)
⁎
LARS HR: 7.48 (2.11 − 26.48)
⁎
LRPPRC HR: 6.34 (1.68 − 23.92)
⁎
PDSS1 HR: 4.89 (2.17 − 11.01)
⁎
GARS HR: 4.38 (1.70 − 11.26)
⁎
TRMT10C HR: 4.05 (1.22 − 13.49)
⁎
HARS2 HR: 3.95 (1.11 − 14.04)
⁎
PARS2 HR: 3.85 (1.44 − 10.25)
⁎
C12orf65 HR: 3.73 (1.05 − 13.27) 34 34 33 32 29 25 21 19 15 11 2
⁎
DLP1 HR: 3.61 (1.15 − 11.30)
⁎
HSPD1 HR: 3.57 (1.29 − 9.84)
⁎
MGME1 HR: 3.14 (1.03 − 9.56)
⁎
ATAD3 HR: 3.02 (1.39 − 6.57) 0.65
⁎
HR: 2.69 (1.19 − 6.09)
Survival related NMRGs
CARS2
⁎
MPV17 HR: 2.67 (1.43 − 4.96)
⁎
DARS2 HR: 2.50 (1.1 − 5.65)
C−index
⁎
TRMU HR: 2.11 (1.03 − 4.29) 0.60
⁎
UQCRQ HR: 0.5 (0.27 − 0.93)
⁎
CABC1 HR: 0.5 (0.27 − 0.93)
⁎
FRDA HR:0.48 (0.23 − 1.00)
⁎
COQ9 HR: 0.47 (0.22 − 0.99)
⁎ 0.55
COQ4 HR: 0.37 (0.16 − 0.85)
⁎
DNAJC19 HR: 0.36 (0.13 − 0.96)
⁎
ANT1 HR: 0.36 (0.17 − 0.74)
⁎
COQ6 HR: 0.34 (0.13 − 0.88)
⁎
COQ5 HR: 0.34 (0.12 − 0.99) −7 −6 −5 −4 −3 −2
⁎
SPG7 HR: 0.32 (0.11 − 0.92)
⁎
TK2 HR: 0.31 (0.12 − 0.75)
NDUFV2 ⁎ Log (λ)
HR: 0.28 (0.11 − 0.70)
⁎
COX15 HR: 0.21 (0.06 − 0.82)
⁎
VARS2 HR: 0.21 (0.07 − 0.60)
⁎
ISCU HR: 0.19 (0.06 − 0.62)
⁎
COQ7 HR: 0.15 (0.04 − 0.55)
⁎
NDUFAF1 HR: 0.12 (0.05 − 0.30)
⁎
MTFMT HR: 0.11 (0.03 − 0.42)
0.1 1.0 10.0
Hazard ratio
(a) (b)
1.00 +++ 1.0
+++
+ ++++++++++++
+
++ ++++
++ ++++
++++++++ 0.8
0.75 ++ ++
Survival probability
+++ +++++++
+
+++++ ++
++ ++
+++++++++
++ +++++ 0.6
Sensitivity
+++
0.50 ++++++ +
++++
++++++ ++ 0.4
+ +++ +
0.25 +
+++ ++
0.2
p < 0.0001
0.00 0.0
0 30 60 90 120
0.0 0.2 0.4 0.6 0.8 1.0
Time
Specificity
Prognosis_score
1 year OS, AUC = 0.79
+ Low
3 years OS, AUC = 0.77
+ High
5 years OS, AUC = 0.77
(c) (d)
Figure 3: Continued.Oxidative Medicine and Cellular Longevity 7
1.0
1.00
+++ ++++++++++++
+++ ++++++++++++++++++
+++++ ++++ 0.8
+++ +++++++
++++
0.75 +++++++++++
Survival probability
++ 0.6
Sensitivity
+
++
+++
0.50
++ + + 0.4
0.25
p < 0.0001 0.2
0.00 0.0
0 20 40 60 80 0.0 0.2 0.4 0.6 0.8 1.0
Time Specificity
Prognosis_score 1 year OS, AUC = 0.78
+ Low 2 years OS, AUC = 0.74
+ High 3 years OS, AUC = 0.78
(e) (f)
1.0
1.00 ++
++ +
++ + + 0.8
+
0.75 + ++ ++
Survival probability
+++++++++++++
+ + + +++++
++++ + 0.6
Sensitivity
+ +
+ ++++
0.50 ++++++++++++++
0.4
0.25
p = 0.012 0.2
0.00 0.0
0 20 40 60 0.0 0.2 0.4 0.6 0.8 1.0
Time Specificity
Prognosis_score
1 year OS, AUC = 0.61
+ Low
3 years OS, AUC = 0.56
+ High
5 years OS, AUC = 0.58
(g) (h)
Figure 3: Construction and validation of the nuclear mitochondrial-related gene (NMRG) signature. (a) Univariate Cox regression analysis
for selection of NMRGs correlated with overall survival of HCC patients. (b) LASSO Cox regression analysis determined a total of 25
NMRGs as the optimal combination for the NMRG signature construction. The Kaplan-Meier curves for HCC patients in high- and
low-risk groups, from the TCGA cohort (c), from the ICGC-HCC cohort (e), and from the GSE14520 dataset (g). The ROC curves for
OS at 1, 3, and 5 years in TCGA cohort (d), in ICGC-HCC cohort (f), and in GSE14520 dataset (h).
where n, Genei, and coefi represent the number of genes 2.4. Establishment of a Novel Prognostic Nomogram for HCC.
involved in the signature, the level of gene expression, and Several predominant prognostic factors in clinic including
the coefficient value, respectively. age, gender, AFP, vascular invasion, histological grading,
To stratify patients into low- and high-risk groups, a clinical stages, TNM stages, alcohol consumption, and hepa-
median value of prognosis score was set for the cutoff value. titis status, together with prognosis score of NMRGs signa-
The Kaplan-Meier survival curve analysis was conducted by ture were investigated via the univariate and multivariate
using the “survival” and “survminer” packages, and log-rank Cox regression analyses using the “rms” and “survival” pack-
test was performed to evaluate the survival rates between the ages, to find the independent prognostic factors. Next, we
low- and high-risk groups. The AUC values were calculated established a prognostic nomogram based on the indepen-
via using the “timeROC” package. dent prognostic factors.8 Oxidative Medicine and Cellular Longevity
p = 0.21 p = 1.00
75 0.9
Age 0.6
50
0.3
25
0.0
High Low High Low
Group Gender
High Female
Low Male
(a) (b)
p = 0.57 p < 0.01
0.9 100000
AFP
0.6 1000
0.3
10
0.0
High Low High Low
Alcohol_consumption Group
No High
Yes Low
(c) (d)
p = 0.05 p < 0.01
0.9 0.9
0.6 0.6
0.3 0.3
0.0 0.0
High Low High Low
Stage I Stage IV G1 G4
Stage II NA G2 NA
Stage III G3
(e) (f)
p = 0.15 p = 0.62
0.9 0.9
0.6 0.6
0.3 0.3
0.0 0.0
High Low High Low
T_stage N_stage
T1 T4 N0
T2 NA N1
T3 NA
(g) (h)
Figure 4: Continued.Oxidative Medicine and Cellular Longevity 9
p = 0.12 p = 0.82
0.9 0.9
0.6 0.6
0.3 0.3
0.0 0.0
High Low High Low
M_stage Hepatitis_B
M0 No
M1 Yes
NA
(i) (j)
p = 0.25
0.9
0.6
0.3
0.0
High Low
Hepatitis_C
No
Yes
(k)
Figure 4: Association analysis between the NMRG signature and clinical features. (a) The boxplots showed the distribution of age at
diagnosis between the high- and low-risk groups. (b) The percentage-staked bar plots for gender distribution between the high- and low-
risk groups. (c) The percentage-staked bar plots for the distribution of alcohol consumption between the high- and low-risk groups. (d)
The boxplots showed the distribution of AFP concentration between the high- and low-risk groups. The percentage-staked bar plots for
the distribution of neoplasm cancer stages (e), histological grading (f), T stages (g), N stages (h), M stages (i), Hepatitis_B status (j), and
Hepatitis_C status (k) between the high- and low-risk groups.
2.5. Functional Enrichment Analysis. The GO (Gene Ontol- tumor infiltrated cells. Then, a heatmap of gene signature
ogy) enrichment analysis was performed to determine sig- expression profiles denoting the activities of angiogenesis
nificantly enriched GO terms for the differentially and immune further clarified the differentiation of tumor
expressed genes between normal and tumor tissue samples. microenvironment between the high- and low-risk groups
In order to investigate any changes in biological functions [15]. Finally, the CIBERSORT algorithm analysis was
and related pathways between the high- and low-risk groups, employed to explore 22 types of tumor-infiltrating immune
HALLMARK gene set (including 50 gene sets from Molecu- cells.
lar Signature Database, https://www.gsea-msigdb.org/gsea/
msigdb/, [13]) enrichment analysis (GSEA), and KEGG 2.7. The Evaluation of Precision Treatment and
(Kyoto Encyclopedia of Genes and Genomes) pathway Chemotherapy Response. The GSE104580 dataset, including
enrichment analysis were performed. GSEA normalized the the transcriptomic data of 147 HCC patients (81 responders
Enrichment Score for each gene set to account for the varia- vs. 66 nonresponders) treated with TACE treatment, was
tion in gene set sizes, yielding a normalized enrichment enrolled in the present study to explore the predictive ability
score (NES). Enrichment analysis was performed by the of novel prognosis score in the treatment response. Besides,
“clusterprofiler” package and visualized using the “ggplot2”. GSE109211 dataset, including a total of 67 HCC patient
The differentially expressed genes were defined with ∣log2 samples treated with sorafenib (21 responders vs. 46 nonre-
− fold change ðFCÞ ∣ >1, P < 0:05 in the functional enrich- sponders) from the phase III STORM clinical trial
ment analysis. (NCT00692770), was investigated to evaluate the capacity
of prognosis score to predict sorafenib efficacy [16]. Mean-
2.6. Tumor Microenvironment Analysis in HCC. The stro- while, the cell line data from the Genomics of Drug Sensitiv-
mal, immune, and ESTIMATE scores were calculated using ity in Cancer (GDSC, https://www.cancerrxgene.org/) were
ESTIMATE [14], which could illustrate the properties of downloaded to predict the treatment response of10 Oxidative Medicine and Cellular Longevity
p < 0.01 p = 0.0062
5
0.9
Prognosis_score
4
0.6
3
0.3
0.0 2
High Low
1
Vascular_invasion
None VI
Macro None
Vascular_invasion
Micro NA
None
VI
(a) (b)
p = 0.0058 1.00 +
+++
6 ++
++++
++++++
p = 0.041 +++++++++++
p = 0.062 ++++++++++
Prognosis_score
0.75 +++++++++++
+++++
Survival probability
++++++ ++++++
4 ++++++
++
+
++ +++++++
++++++++
0.50 ++++
+
2 ++
+++
0.25
p = 0.40
None Micro Macro
Vascular_invasion 0.00
None 0 30 60 90 120
Micro
Time
Macro
+ Micro-VI group
+ None-VI group
(c) (d)
1.00 +
+++ 1.00 +
+++++++ ++
+++
++
++++++
+++ ++++
++++
0.75 +++++++ 0.75 ++++++++
++++ +
Survival probability
Survival probability
++++++++ ++++++
++++
++ ++
+
+++++++
+
+ +++ + + + ++++ ++
++
0.50 ++++ 0.50 + +++ +
+
++
+ +++
0.25 0.25 +
p = 0.024 p = 0.16
0.00 0.00
0 30 60 90 120 0 25 50 75 100
Time Time
+ Micro-VI group + Micro-VI group
+ None-VI group + None-VI group
(e) (f)
Figure 5: The application of the NMRGs signature in the groups with vascular invasions (VIs) or not. (a) The percentage-staked bar plots
for the distribution of VIs between high- and low- risk groups. (b) Comparison of prognosis score between groups with VIs or not. (c)
Comparison of prognosis score between groups with macro-VIs, micro-VIs, and without VIs. The Kaplan-Meier curves for HCC
patients between micro-VI and none-VI groups (d). (e) Green and purple lines represent macro-VI group and none-VI group,
respectively. (f) Green and purple lines represent macro-VI group and micro-VI group, respectively.Oxidative Medicine and Cellular Longevity 11
Macro-VI Group Micro-VI Group
1.00 1.00 + +
+++
+ + + + + +++
+++++++
+++ +
0.75 0.75 +++++ +
++++ + ++
Survival probability
Survival probability
+++ + + + ++ + ++
0.50 0.50
+ + + ++
0.25 + + 0.25
p = 0.037 p = 0.15
0.00 0.00
0 10 20 30 40 50 0 25 50 75 100
Time Time
+ Low risk group + Low risk group
+ High risk group + High risk group
(a) (b)
Figure 6: Comparison of overall survival between high- and low-risk HCC patients in the groups with macro-VIs or micro-VIs. The
Kaplan-Meier curves between high- and low-risk HCC patients in the macro-VI group (a) and micro-VI group (b).
Table 2: Hazard ratios for the NMRG signature and clinical dance index, time-dependent ROC, and calibration were also
features via the multivariate Cox regression analysis. important indicators used to assess the nomogram. P < 0:05
Index Hazard ratio 95% CI P value was considered statistically significant.
Prognosis score 4.65 2.59-8.34 1, Q − value
T stage 1.08 0.1-11.61 0.61 < 0:01, Supplementary Table 1), and it was demonstrated
that there were 1,482 genes significantly upregulated and
N stage 0.43 0.04-4.48 0.48
725 genes significantly downregulated in the HCC tumor
M stage 14.53 1.31-160.62 0.03
samples (Figures 2(a), 2(b)). In addition, biological
Hepatitis_B 0.69 0.31-1.54 0.36 functions and involved pathways of these identified 2,207
Hepatitis_C 1.41 0.49-4.08 0.52 DEGs were analyzed by GO enrichment analysis, revealing
Vascular invasion 1.43 0.68-3.01 0.34 that the DEGs were abundantly enriched in the pathways
CI: confidence interval. Bold for “significant” in statistical analysis. related to cell metabolisms, including mitochondrial inner
membrane, ATP-dependent chromatin remodeling, and
mitochondrial electron transport, NADH to ubiquinone
chemotherapeutic regimens between high- and low-risk pathways (Figure 2(c)), indicating that mitochondrial
groups, and the chemical drugs utilized in HCC, such as cis- dysfunction was closely related to the carcinogenesis and
platin, paclitaxel, and gemcitabine, for HCC patients were development of HCC.
investigated. The index of half-maximal inhibitory concen-
tration (IC50) was used for the response evaluation. 3.2. Construction of a Novel Nuclear Mitochondrial-Related
Gene Prognosis Signature for HCC. Univariate Cox regres-
2.8. Statistical Analysis. All statistical analyses were con- sion analysis was performed to analyze the correlation
ducted with the R package (v. 3.4.3, https://rstudio.com/). between the transcriptional expression level of 147 NMRGs
Fisher’s test was executed for the comparison of categorical and the overall survival (OS) of HCC patients from the
variables. The Kaplan-Meier curve analysis by using the TCGA cohort. It was found that the elevated expression of
log-rank test was used to evaluate the statistical significance 17 NMRGs was significantly correlated with the poorer
of the survival rates between different risk groups. Concor- prognosis of HCC patients, whereas the overexpression of12 Oxidative Medicine and Cellular Longevity
ROC for 1 year OS ROC for 3 years OS
1.0 1.0
0.8 0.8
0.6 0.6
Sensitivity
Sensitivity
0.4 0.4
0.2 0.2
0.0 0.0
0.0 0.2 0.4 0.6 0.8 1.0 0.0 0.2 0.4 0.6 0.8 1.0
Specificity Specificity
Prognosis score AUC = 0.79 Prognosis score AUC = 0.77
Vascular invasion AUC = 0.55 Vascular invasion AUC = 0.55
AFP AUC = 0.60 AFP AUC = 0.61
Histologic grade AUC = 0.51 Histologic grade AUC = 0.51
Gender AUC = 0.52 Gender AUC = 0.48
Alcohol consumption AUC = 0.48 Alcohol consumption AUC = 0.49
T stage AUC = 0.67 T stage AUC = 0.66
N stage AUC = 0.51 N stage AUC = 0.52
M stage AUC = 0.51 M stage AUC = 0.53
Hepatitis B AUC = 0.41 Hepatitis B AUC = 0.36
Hepatitis C AUC = 0.49 Hepatitis C AUC = 0.53
(a) (b)
ROC for 5 years OS 0 10 20 30 40 50 60 70 80 90 100
Points
1.0
Prognosis score
0.5 1 1.5 2 2.5 3 3.5 4 4.5 5 5.5 6
0.8 Age
10 40 70 M1
M stage
0.6 M0
Sensitivity
Total points
0 10 20 30 40 50 60 70 80 90 100
0.4 1 year OS
0.9 0.7 0.5 0.3 0.1
3 years OS
0.2 0.9 0.7 0.5 0.3 0.1
5 years OS
0.9 0.7 0.5 0.3 0.1
0.0
0.0 0.2 0.4 0.6 0.8 1.0
Specificity
Prognosis score AUC = 0.77
Vascular invasion AUC = 0.52
AFP AUC = 0.62
Histologic grade AUC = 0.56
Gender AUC = 0.48
Alcohol consumption AUC = 0.54
T stage AUC = 0.65
N stage AUC = 0.52
M stage AUC = 0.52
Hepatitis B AUC = 0.39
Hepatitis C AUC = 0.54
(c) (d)
1.0 1.0
0.8 0.8
Actual survival
0.6 0.6
Sensitivity
0.4 0.4
0.2 0.2
0.0 0.0
0.0 0.2 0.4 0.6 0.8 1.0 0.0 0.2 0.4 0.6 0.8 1.0
Predicted survival Specificity
1 year OS 1 year OS, AUC = 0.82
3 years OS 3 years OS, AUC = 0.81
5 years OS 5 years OS, AUC = 0.82
(e) (f)
Figure 7: Construction of a novel nomogram for HCC patients based on the NMRG signature. The ROC curves of a variety of clinical features
for overall survival (OS) at 1 (a), 3 (b), and 5 years (c). (d) The NMRG-based nomogram was constructed to predict the OS of HCC patients. (e)
The calibration plots for the evaluation of predicted OS at 1, 3, and 5 years. (f) The ROC curves of the nomogram for OS at 1, 3, and 5 years in the
analysis of TCGA-HCC cohort.Oxidative Medicine and Cellular Longevity 13
Altered in 162 (89.01%) of 182 samples in high-risk group.
1147
NA
p = 0.34 0 83
1000 0
TP53 46%
TTN 29%
CTNNB1 21% NA
MUC16 17%
LRP1B 12%
CSMD3
Mutation_count
12%
100 FAT3 11%
MT−ND5 11%
RYR2 11%
ARID1A 10%
OBSCN 10%
ABCA13 10%
DNAH7 10%
ALB 9%
10 FRAS1 9%
MUC4 9%
APOB 9%
CACNA1E 9%
HSPG2 8%
SPTA1 8%
High Low
Missense_mutation In_frame_ins
Group
Frame_shift_del In_frame_del
a High Nonsense_mutation Translation_start_site
a Low
Splice_site Multi_hit
Frame_shift_ins
(a) (b)
CTNNB1
Altered in 155 (86.59%) of 179 samples in low-risk group. 0.30
1276
TTN
0 57
Low-risk group
0
CTNNB1 32% 0.20
TTN 27%
TP53 15%
ALB 13% TP53
PCLO 12% PCLO
APOB 12% 0.10
MUC16
MUC16 12% MT−ND5
XIRP2
MT−ND5 10% ARID2 RYR2
XIRP2 9% FBN1
MT−CO3
CSMD3
LRP1B
CACNA1E 8% MAGEL2
FRAS1
RYR1 8% ANK2
FAT3
USH2A 8% 0.00
DNAH17
MCTP2
AHNAK2 8%
ARID2 8%
KMT2D 8% 0.00 0.10 0.20 0.30 0.40 0.50
RYR2 8%
BAP1 7% High-risk group
COL11A1 7%
HMCN1 7%
Fisher’s test
OBSCN 7%
ns
Missense_mutation Nonsense_mutation P < 0.05
Frame_shift_del Splice_site ABS (Log OR)
Frame_shift_ins In_Frame_ins 0.25 0.75
In_frame_del Multi_hit 0.50 1.00
(c) (d)
Figure 8: Continued.14 Oxidative Medicine and Cellular Longevity
0.30 CTNNB1
Altered in 46 (12.33%) of 373 samples.
1276
0.10
Low-risk group
0 15
AXIN1 0
APC ATR
0.03 RECQL4
BRCA2
PTEN ATR 4%
BRCA1
ATM
DEPDC5 TSC2
BRCA2 3%
MTOR
0.01
ATM 2%
AMER1
0.01 0.03 0.10
BRCA1 2%
High-risk group
RECQL4 2%
Fisher’s test
ns
Group
P < 0.05
ABS (LogOR) Pathway Missense_mutation In_frame_del
0.20 DDR Splice_site Frame_shift_del
0.40 PI3K Frame_shift_ins Multi_hit
0.60 WNT
Group
High
Low
(e) (f)
Altered in 57 (15.28%) of 373 samples.
1155
0 13
0
PIK3CA 3%
TSC2 3%
PTEN 3%
MTOR 3%
TSC1 2%
DEPDC5 2%
Group
Missense_mutation Frame_shift_ins
Frame_shift_del In_frame_del
Nonsense_mutation Multi_hit
Splice_site
Group
High
Low
(g)
Figure 8: Continued.Oxidative Medicine and Cellular Longevity 15
Altered in 133 (35.66%) of 373 samples.
1276
0 97
0
CTNNB1 26%
AXIN1 6%
APC 3%
WIF1 2%
AMER1 2%
Group
Missense_mutation Nonsense_mutation
Splice_site Frame_shift_ins
Frame_shift_del Multi_hit
In_Frame_del
Group
High
Low
(h)
Figure 8: The analysis of genomic alterations between the high- and low-risk groups. (a) The boxplots showed the mutation counts between
the high- and low-risk groups. The genomic profiling of the top 20 most frequently altered genes in the high-risk group (b) and in the low-
risk group (c). (d) Genomic alteration enrichment of altered genes between the high- and low-risk groups. (e) Genomic alteration
enrichment of altered signaling pathways between the high- and low-risk groups. The genomic profiles of altered events in DDR (f),
PI3K (g), and WNT signaling pathways (h).
other 18 NMRGs significantly contributed to the improved OS: 48.02 months vs. unreached, P < 0:0001, Figure 3(e)).
survival (P < 0:05, Figure 3(a)). These 35 OS-related NMRGs The AUC values for predicting OS at the 1-, 2-, and 3-year
were then enrolled in the LASSO Cox regression analysis, timepoints were 0.78, 0.74, and 0.78, respectively
finally constructing a NMRG prognosis signature for HCC (Figure 3(f)). Furthermore, the NMRG signature was veri-
patients based on the transcriptional profiling of selected fied in another independent dataset of GSE14520 from the
25 NMRGs (NDUFV2, NDUFAF1, COX15, LRPPRC, GEO database. It could be also observed that patients in
MPV17, CARS2, DARS2, GARS, HARS2, LARS, PARS2, high-risk group had significantly worse OS (median OS:
VARS2, MTFMT, TRMT10C, TRMU, C12ORF65, MRPL3, unreached vs. unreached, P = 0:012, Figure 3(g)). The AUC
FRDA, ISCU, COQ6, COQ7, PDSS1, CABC1, SPG7, and values for predicting OS at 1, 3, and 5 years were 0.61,
ATAD3), with the optimal value of λ ðλ = 0:0106127Þ 0.56, and 0.58, respectively (Figure 3(h)).
(Figure 3(b)). This novel prognosis score was calculated by
multiplying the gene expression of each gene and its corre-
3.4. Comparison of Clinicopathological Features between the
sponding coefficient (Supplementary Table 2), which was
High- and Low-Risk Groups. The differences of clinicopath-
obtained by the multivariate Cox regression analysis.
ological features of patients from the high- and low-risk
groups, in the TCGA cohort, were subsequently analyzed.
3.3. Survival Analysis and Validation of the NMRG
The age at diagnosis of patients in the high-risk group did
Signature. According to the median prognosis score value,
not differ with that in the low-risk group (median age: 60
365 HCC patients were divided into high-risk group and
[18, 85] vs. 63 [16, 90] months, P = 0:21, Figure 4(a)). Mean-
low-risk group. The analysis of the Kaplan-Meier curve
while, there was no statistically significant difference in gen-
showed that patients in high-risk group had significantly
der between these two groups (P > 0:05, Figure 4(b)).
worse OS (median OS: 27.50 vs. 83.18 months, P < 0:0001,
Besides, no significant difference of the alcohol consumption
Figure 3(c)). Time-dependent ROC analysis was used to
level was found between the high- and low-risk groups,
evaluate the prognostic evaluation ability of the NMRG sig-
either (P = 0:57, Figure 4(c)). As for the level of AFP, it dem-
nature (Figure 3(d)), and the AUC values at 1, 3, and 5 years
onstrated that patients in high-risk group had the signifi-
for predicting OS were 0.79, 0.77, and 0.77, respectively. Fur-
cantly higher level of AFP (median level: 28 vs. 7 ng/mL,
thermore, two independent cohorts were retrieved to vali-
P < 0:01, Figure 4(d)). Moreover, there were more patients
date the NMRG signature. The Kaplan-Meier curve ̲
analysis demonstrated that patients in high-risk group, from from the high-risk group having advanced neoplasm cancer
the ICGC cohort, had the significantly worse OS (median stages (45.35% vs. 54.44% in stage I, 23.84% vs. 25.44% in16 Oxidative Medicine and Cellular Longevity
HALLMARK_E2F_TARGETS
HALLMARK_G2M_CHECKPOINT
HALLMARK_MYC_TARGETS_V1
HALLMARK_MITOTIC_SPINDLE
HALLMARK_MYC_TARGETS_V2
HALLMARK_MTORC1_SIGNALING
HALLMARK_DNA_REPAIR
HALLMARK_UNFOLDED_PROTEIN_RESPONSE
HALLMARK_SPERMATOGENESIS
HALLMARK_UV_RESPONSE_UP
HALLMARK_MYOGENESIS
HALLMARK_UV_RESPONSE_DN
HALLMARK_ANDROGEN_RESPONSE
HALLMARK_COMPLEMENT
HALLMARK_INTERFERON_GAMMA_RESPONSE
HALLMARK_INTERFERON_ALPHA_RESPONSE
HALLMARK_HEME_METABOLISM
HALLMARK_PEROXISOME
HALLMARK_OXIDATIVE_PHOSPHORYLATION
HALLMARK_COAGULATION
HALLMARK_ADIPOGENESIS
HALLMARK_FATTY_ACID_METABOLISM
HALLMARK_XENOBIOTIC_METABOLISM
HALLMARK_BILE_ACID_METABOLISM
−4 −2 0 2
NES
(a)
Figure 9: Continued.Oxidative Medicine and Cellular Longevity 17
p-value
0.005 0.010 0.015
KEGG_CELL_CYCLE
KEGG_DNA_REPLICATION
KEGG_SPLICEOSOME
KEGG_MISMATCH_REPAIR
KEGG_HOMOLOGOUS_RECOMBINATION
KEGG_PATHOGENIC_ESCHERICHIA_COLI_INFECTION
KEGG_NON_HOMOLOGOUS_END_JOINING
KEGG_RNA_DEGRADATION
KEGG_OOCYTE_MEIOSIS
KEGG_PYRIMIDINE_METABOLISM
KEGG_BASE_EXCISION_REPAIR
KEGG_PROGESTERONE_MEDIATED_OOCYTE_MATURATION
KEGG_BLADDER_CANCER
KEGG_AMINOACYL_TRNA_BIOSYNTHESIS
KEGG_NOD_LIKE_RECEPTOR_SIGNALING_PATHWAY
KEGG_UBIQUITIN_MEDIATED_PROTEOLYSIS
KEGG_FC_GAMMA_R_MEDIATED_PHAGOCYTOSIS
KEGG_PURINE_METABOLISM
KEGG_REGULATION_OF_ACTIN_CYTOSKELETON
KEGG_PATHWAYS_IN_CANCER
KEGG_ALZHEIMERS_DISEASE
KEGG_ABC_TRANSPORTERS
KEGG_RENIN_ANGIOTENSIN_SYSTEM
KEGG_PENTOSE_AND_GLUCURONATE_INTERCONVERSIONS
KEGG_PHENYLALANINE_METABOLISM
KEGG_GLYOXYLATE_AND_DICARBOXYLATE_METABOLISM
KEGG_BIOSYNTHESIS_OF_UNSATURATED_FATTY_ACIDS
KEGG_GLYCEROLIPID_METABOLISM
KEGG_LYSINE_DEGRADATION
KEGG_GLYCOLYSIS_GLUCONEOGENESIS
KEGG_OXIDATIVE_PHOSPHORYLATION
KEGG_PORPHYRIN_AND_CHLOROPHYLL_METABOLISM
KEGG_PARKINSONS_DISEASE
KEGG_ALANINE_ASPARTATE_AND_GLUTAMATE_METABOLISM
KEGG_ADIPOCYTOKINE_SIGNALING_PATHWAY
KEGG_ARACHIDONIC_ACID_METABOLISM
KEGG_ASCORBATE_AND_ALDARATE_METABOLISM
KEGG_STARCH_AND_SUCROSE_METABOLISM
KEGG_CITRATE_CYCLE_TCA_CYCLE
KEGG_LIMONENE_AND_PINENE_DEGRADATION
KEGG_PYRUVATE_METABOLISM
KEGG_DRUG_METABOLISM_OTHER_ENZYMES
KEGG_HISTIDINE_METABOLISM
KEGG_ARGININE_AND_PROLINE_METABOLISM
KEGG_LINOLEIC_ACID_METABOLISM
KEGG_TYROSINE_METABOLISM
KEGG_BETA_ALANINE_METABOLISM
KEGG_STEROID_HORMONE_BIOSYNTHESIS
KEGG_PPAR_SIGNALING_PATHWAY
KEGG_PRIMARY_BILE_ACID_BIOSYNTHESIS
KEGG_BUTANOATE_METABOLISM
KEGG_PROPANOATE_METABOLISM
KEGG_TRYPTOPHAN_METABOLISM
KEGG_METABOLISM_OF_XENOBIOTICS_BY_CYTOCHROME_P450
KEGG_GLYCINE_SERINE_AND_THREONINE_METABOLISM
KEGG_PEROXISOME
KEGG_VALINE_LEUCINE_AND_ISOLEUCINE_DEGRADATION
KEGG_RETINOL_METABOLISM
KEGG_DRUG_METABOLISM_CYTOCHROME_P450
KEGG_FATTY_ACID_METABOLISM
KEGG_COMPLEMENT_AND_COAGULATION_CASCADES
−2 0 2
NES
(b)
Figure 9: Functional enrichment analysis between the high- and low-risk groups. The HALLMARK gene set enrichment analysis (a) and
the KEGG pathway enrichment analysis (b). P < 0:05 was considered statistically significant.
stage II, 30.23% vs. 18.34% in stage III, and 0.58% vs. 1.78% Figure 4(f)). However, no statistically significant difference
in stage IV, P = 0:05, Figure 4(e)) and higher histological in the tumor stage, lymph node invasion, and metastasis
grading (G1: 7.18% vs. 23.46%, G2: 44.75% vs. 52.51%, G3: (TNM stage) was observed between these two groups
43.09% vs. 22.34%, and G4: 4.97% vs. 1.68%, P < 0:01, (P > 0:05, Figures 4(g)–4(i)). Finally, it was found that there18 Oxidative Medicine and Cellular Longevity
ns ns ns
2000
Value
0
−2000
Stromal_score Immune_score ESTIMATE_score
Group
High
Low
(a)
Figure 10: Continued.Oxidative Medicine and Cellular Longevity 19
M_stage
N_stage 2
T_stage
Group
VEGFA
KDR
ESM1
PECAM1
FLT1
ANGPTL4
1
CD34
CD8A
CD27
IFNG
GZMA
GZMB
PRF1
EOMES
CXCL9 0
CXCL10
CXCL11
CD274
CTLA4
FOXP3
TIGIT
IDO1
PSMB8
PSMB9 −1
TAP1
TAP2
CXCL1
CXCL2
CXCL3
CXCL8
IL6
PTGS2
−2
M_stage N_stage T_stage Group
M0 N0 T1 High
M1 N1 T2 Low
T3
T4
Pathway
Angiogenesis
Immune_and_antigen_presentation
Myeloid_inflammation
(b)
Figure 10: Continued.20 Oxidative Medicine and Cellular Longevity
⁎ ⁎ ns ns ns ns ns ⁎⁎ ⁎⁎⁎⁎ ns ⁎ ⁎ ⁎⁎ ⁎⁎⁎⁎ ⁎⁎ ns ns ns ns ns ns ⁎⁎
0.6
0.4
Value
0.2
0.0
8+
ve
e
a
g
d
s)
elta
ing
d
te
M0
M1
M2
g
d
ted
g
hil
hil
ry
r
v
sm
tin
stin
tin
a te
a te
a te
lpe
nai
reg
ocy
mo
nai
op
op
CD
i va
est
d
res
res
age
ge
age
pla
v
tiv
tiv
e
l re
T
sin
utr
n
4+
i
me
ma
h
ell
r
act
act
a
y(
Mo
ell
l ac
l ac
ph
ph
ph
ry
l
ell
lar
ell
cel
cel
Eo
Ne
Bc
CD
gam
Tc
tor
ell
mo
ry
ell
st c
cro
cro
cro
Bc
licu
cel
cel
NK
tic
Bc
mo
st c
ula
ell
me
Ma
Ma
Ma
Ma
ell
NK
tic
fol
dri
me
Tc
reg
Ma
Tc
dri
4+
den
ell
4+
ell
den
Tc
CD
id
Tc
CD
elo
id
ell
elo
ell
My
Tc
My
Tc
Group
High
Low
(c)
Figure 10: Comparison of tumor microenvironment (TME) between the high- and low-risk groups. (a) The statistical analyses of the
stromal score, immune score, and ESTIMATE score between the high- and low-risk groups. (b) Heatmap demonstrated the expression
of genes related to angiogenesis (purple), immune and antigen presentation (blue), and myeloid inflammation (brown). (c) The analysis
of 22 immune infiltrated cells between high- and low-risk groups. ∗∗∗∗ P < 0:0001, ∗∗∗ P < 0:001, ∗∗ P < 0:01, ∗ P < 0:05.
was no significant difference in the ratio of patients infected group: 37.75 vs. 81.67 months, P = 0:011; none-VI group:
with hepatitis B, nor with hepatitis C between the high- and 55.35 vs. 83.51 months, P = 0:0018, Supplementary
low-risk groups (P > 0:05, Figures 4(j) and 4(k)). Figure 1A-1B). Of note, in macro-VI group, patients with
high prognosis score exhibited extremely poorer OS (15.77
3.5. Association between NMRG Prognosis Signature and VIs. vs. 48.95 months, P = 0:037, Figure 6(a)). Similarly, patients
In the TCGA cohort, there were 111 patients presented with in micro-VI group having high prognosis score also had
VIs (17 patients with macrovascular invasions and 94 worse OS, however, with no statistically significant
patients with microvascular invasions), and 211 patients difference (45.89 vs. 81.67 months, P = 0:15, Figure 6(b)),
did not present with VIs. Further investigation for histopa- mainly owing to the limited patient number.
thological subtypes found that more HCC patients with
VIs were included in the high-risk group (macro-VI: 8.05% 3.6. Establishment of a Prognostic Nomogram. The multivar-
vs. 2.47%, micro-VI: 33.56% vs. 24.69%, and none-VI: iate Cox regression analysis exhibited that the prognosis
58.39% vs. 72.84%, P < 0:01, Figure 5(a)). Remarkably, it score was an independent prognostic indicator for OS in
was revealed that patients with VIs had the significantly HCC patients from the TCGA cohort (Table 2) and the
higher prognosis score, compared to those without VIs ROC curve analysis revealed that the NMRG signature had
(Figure 5(b)), while patients with macrovascular invasions the highest sensitivity and specificity in predicting the OS
had the highest prognosis score (Figure 5(c)). The survival of HCC patients, compared with clinic-related features,
analysis demonstrated that patients with macro-VI pheno- including AFP, VI, histological grading, and TNM clinical
type had significantly worse OS than those without VIs stages (Figures 7(a)–7(c)). Meanwhile, the NMRG signature
(median OS macro-VI vs. none-VI: 48.95 vs. 70.01 also had better sensitivity and specificity than each single
months, P = 0:024), while there was no significant differ- NMRG alone in the prognosis prediction (Supplementary
ence in the OS between patients with micro-VI and none- Figure 2A-2C). Subsequently, we combined three
VI, neither between patients with micro-VI and macro-VI independent prognostic indexes, including the age, tumor
(Figures 5(d)–5(f)). Nevertheless, it was shown that HCC metastasis status, and prognosis score to construct a
patients having high prognosis score had worse OS, regard- nomogram to predict the OS of HCC patients
less of whether presenting with VI or not (median OS in VI (Figure 7(d)). Each patient had an integrated scoreOxidative Medicine and Cellular Longevity 21
Treatment: Sorafenib Treatment: TACE
p = 0.0066 p = 2.1e−07
7.50 12.00
Prognosis_score
Prognosis_score 5.00 10.00
8.00
2.50
6.00
0.00
4.00
Responder Non−responder Non-responder Responder
Responders Responders
Outcome: responder Outcome: responder
Outcome: non−responder Outcome: non-responder
(a) (b)
Treatment: Paclitaxel
p < 0.0001
−2.40
Treatment: Cisplatin
p < 0.0001
4.00
IC50
−2.80
3.60
IC50
−3.20
3.20
2.80
High Low High Low
Group Group
High-risk group High-risk group
Low-risk group
Low-risk group
(c) (d)
Figure 11: Continued.22 Oxidative Medicine and Cellular Longevity
Treatment: Doxorubicin
Treatment: Gemcitabine p < 0.0001
p < 0.0001 −1.50 Treatment: Methotrexate
−1.00 2.00 p < 0.0001
−1.75
−2.00 1.00
IC50
IC50
IC50
−2.00
−3.00
0.00
−2.25
−4.00
−1.00
High Low High Low High Low
Group Group Group
High-risk group High-risk group High-risk group
Low-risk group Low-risk group Low-risk group
(e) (f) (g)
Treatment: Vorinostat
Treatment: Bleomycin p < 0.0001
Treatment: Vinblastine
p < 0.0001
p < 0.05
2.40
−4.00
2.00 2.00
−4.10
IC50
IC50
IC50
1.60 −4.20
1.00
−4.30
1.20
−4.40
High Low High Low High Low
Group Group Group
high-risk group High-risk group High-risk group
Low-risk group Low-risk group Low-risk group
(h) (i) (j)
Figure 11: The evaluation of treatment responses by the novel prognosis score based on NMRG signature. (a) The treatment response
prediction of the sorafenib therapy in the GSE109211 dataset. (b) The treatment response prediction of the transcatheter arterial
chemoembolization (TACE) therapy in the GSE104580 dataset. (c–j) The boxplots of the evaluated IC50 for commonly used
chemodrugs between the high- and low-risk groups by the analysis of cell line data from the GDSC database. ∗∗∗∗ P < 0:0001, ∗ P < 0:05.
according to the prognostic parameters, and the higher the P < 0:05, Supplementary Tables 3–4), whereas a higher
total score indicated a worse outcome. The calibration prevalence of CTNNB1 was presented in the low-risk
chart showed that the OS probability predicted by the group (frequency: 32% vs. 21%, P < 0:05, Supplementary
nomogram approximated the actual OS probability very Tables 3–4). Then, the altered events of patients between
well (Figure 7(e)). The C-index of the nomogram was the high- and low-risk groups were compared (genes were
0.753 (95% CI, 0.703~0.804), and the AUC values of the excluded if their alteration event count less than 5 times
nomogram were 0.82, 0.81, and 0.82 at the 1-, 3-, and 5- happened simultaneously in both groups), demonstrating
year timepoints, respectively (Figure 7(f)). that the prevalence of a total of 61 genes was significantly
different between the high- and low-risk groups (P < 0:05,
3.7. Genomic Feature Associated with the NMRG Signature. Supplementary Table 5). The result showed that 24 altered
Statistical analysis displayed that there was no significant genes, including CTNNB1, FBN1, and MT-CO3, were
difference of the mutation count between the high- and significantly prevalent in the low-risk group (P < 0:05,
low-risk groups (P = 0:34, Figure 8(a)), but mutation profiles Figure 8(d), Supplementary Table 5), whereas 37 altered
revealed that the most frequently altered genes between the genes, for instance, TP53, LRP1B, and FAT3, were
high- and low-risk groups were distinct (Figures 8(b) and significantly prevalent in the high-risk group (P < 0:05,
8(c)). HCC patients in the high-risk group had a signifi- Figure 8(d), Supplementary Table 5). Subsequently,
cantly higher prevalence of TP53 (frequency: 46% vs. 15%, genomic alterations of the known cancer-related signalingOxidative Medicine and Cellular Longevity 23
pathways, such as DNA Damage Repair (DDR), which might be highly correlated with the response of
Phosphatidylinositol-3-Kinase (PI3K), and WNT signaling sorafenib therapy. Moreover, gene set enrichment analysis
pathway, were further investigated. Of note, it was found revealed that the upregulated pathways of xenobiotic
that WNT signaling-related gene CTNNB1 was more metabolism, oxidative phosphorylation, apoptosis, and
frequently altered in the low-risk group (P < 0:05, coagulation (by HALLMARK, Supplementary Figure 5C),
Figure 8(e)), but TSC2 and MTOR associated with PI3K ribosome and glycine, serine and threonine metabolism (by
signaling pathway were significantly enriched in the high- KEGG, Supplementary Figure 5D), besides, the
risk group (P < 0:05, Figure 8(e)). The genomic alteration downregulated pathways of KRAS signaling_DN (by
profiles describing the altered events in DDR, PI3K, and HALLMARK, Supplementary Figure 5E) and olfactory
WNT signaling pathways were exhibited in Figures 8(f)–8(h). transduction (by KEGG, Supplementary Figure 5F) were
enriched, which was associated with treatment response of
3.8. Identification of Differential Biological Functions. Fur- sorafenib.
ther analysis of DEGs revealed a total of 599 genes were sig-
nificantly upregulated and 487 genes were downregulated in 3.11. Treatment Response Prediction of TACE Therapy and
low-risk groups (Supplementary Figure 3). Based on the Chemotherapy. Another independent cohort (GSE104580
identified DEGs, the differential molecular mechanisms dataset) of 147 HCC patients who received the treatment
between two groups were further elucidated via of TACE was further employed in the present study. Of
HALLMARK gene set and KEGG pathway enrichment note, it was found that HCC patients responding to TACE
analyses. The HALLMARK gene set enrichment analysis therapy had markedly lower prognosis score (P < 0:0001,
showed the significant enrichment of E2F targets, G2M Figure 11(b)), further showing the robust capacity of progno-
checkpoint, and Myc targets. (Figure 9(a)), while the sis score to predict treatment response. In addition, cell line
KEGG pathway enrichment analysis exhibited a significant data from the GDSC database were employed to predict the
abundance of cell cycle, DNA replication, and spliceosome IC50 of commonly used chemodrugs for HCC patients from
(Figure 9(b)). In addition, both HALLMARK gene set TCGA cohort, wherein six chemodrugs (cisplatin, gemcita-
enrichment analysis and KEGG pathway enrichment bine, doxorubicin, methotrexate, vorinostat, and vinblastine)
analysis showed that the metabolism-related pathways were exhibited significantly lower IC50 in the high-risk group,
significantly enriched, especially for fatty acid metabolism indicating that those patients seemed to be more sensitive
(Figures 9(a) and 9(b)). to the chemotherapeutic regimens containing these drugs
(Figures 11(c)–11(j)). Conversely, the significantly lower
3.9. Correlation between the NMRG Signature and Tumor estimated IC50 values in the low-risk group demonstrated
Microenvironment. Notably, the stromal score, immune that patients with lower prognosis score could benefit more
score, and ESTIMATE score were nearly equivalent between from paclitaxel and bleomycin (Figures 11(d) and 11(h)).
the high- and low-risk groups (Figure 10(a)). The gene Subsequently, the chemodrug efficacy under VI stratifica-
expression profiles of angiogenesis, immune and antigen tion (macro-VI, micro-VI, or non-VI) was further evaluated.
presentation, and myeloid inflammation signatures between The sensitivities to those investigated drugs were nearly equiv-
the high- and low-risk groups demonstrated that there were alent between micro-VI and non-VI groups (Supplementary
no distinct differences in these tumor microenvironment- Figure 6). However, four chemodrugs (including cisplatin,
related pathways (Figure 10(b)). The CIBERSORT algorithm gemcitabine, vorinostat, and methotrexate) had significantly
analysis revealed that B cell memory, T cell follicular helper, lower IC50 in the macro-VI group (Supplementary
regulatory T cells (Tregs), activated NK cells, macrophage Figure 6), while patients from micro-VI or non-VI group
M0, and neutrophils were significantly enriched in the high- seemed to be more sensitive to paclitaxel (Supplementary
risk group (P < 0:05, Figure 10(c)). Besides, the low-risk group Figure 6). Furthermore, among patients presented with the
had a significant abundance of naive B cells, resting NK cells, non-VI or micro-VI phenotype, lower estimated IC50 values
monocyte, and macrophage M1 (P < 0:05, Figure 10(c)). of cisplatin, vorinostat, and methotrexate were observed in
the high-risk group, whereas the low-risk group had lower
3.10. The Signaling Pathways Potentially Targeted by estimated IC50 values of paclitaxel and bleomycin instead
Sorafenib Therapy. An independent cohort (GSE109211), (Supplementary Figure 7 & 8). Besides, among non-VI
including 67 HCC patients treated with sorafenib, was uti- patients, the lower IC50 values of gemcitabine, doxorubicin,
lized to evaluate the efficacy of sorafenib therapy in and vinblastine were further found in the high-risk group
NMRG-risk groups. Notably, HCC patients who responded (Supplementary Figure 7). Owing to the limited number of
to sorafenib had significantly lower prognosis score macro-VI patients (N = 17), there was no significant
(P = 0:0066, Figure 11(a)). Subsequently, the specific signal- difference observed in the IC50 values of nearly all
ing pathways potentially targeted by sorafenib were further investigated chemodrugs between the high- and low-risk
investigated. The DEG analysis showed a total of 1399 genes groups, except bleomycin (Supplementary Figure 9).
significantly upregulated and 1547 genes downregulated in
the responders (Supplementary Figure 4). By the statistical 4. Discussion
analysis, the overlapping gene cluster between the low-risk
and responder groups included 519 upregulated genes and A robust prognostic predictor for HCC patients is urgently
457 downregulated genes (Supplementary Figure 5A-5B), needed due to the heterogeneous outcomes of HCC patients24 Oxidative Medicine and Cellular Longevity
and the difficulties in the management and treatment strat- with metabolic diseases or neurological disorders [35–42].
egy selection. Evidences from preclinical research supported Further studies are merited to give deep insights on how
mitochondrial dysfunction as a key factor in the pathogene- they involve in the development of HCC and whether they
sis of metabolic liver disease and cancer, which further sug- could be targeted for treatment. In the present study, com-
gested the development of targeting treatments for prehensive transcriptomic profiling of NMRGs offered a
mitochondrial genes as an attractive strategy to suppress deep insight for the role of mitochondria in HCC.
the HCC progression [17]. In the current study, functional Clinical association analysis demonstrated that the high
enrichment analysis of DEGs between HCC tumors and prognosis score could discriminate HCC patients with
normal tissue samples revealed that mitochondrial dysfunc- inferior outcomes. Furthermore, some known biomarkers
tion was pivotal in the development of HCC, and aberrant such as AFP and des-carboxy prothrombin had very low
expression of 35 NMRGs exerted notable influences on the sensitivity in detecting the HCC invasiveness [43]. VI, as
prognosis of HCC. By the optimal combination, a 25- an aggressive histopathological subtype of HCC, accounts
NMRG signature based on their transcriptional profiling for nearly 25% ~50% of HCC [5, 44]. In the present study
was eventually constructed with the good performance in the prognosis score of NMRG signature had the ability to
predicting prognosis and differentiating patients with or differentiate HCC patients presented with or without VIs,
without VIs in HCC. The clinical association analysis also especially for patients with macro-VIs. In addition, the
showed that higher NMRG prognosis score was positively higher NMRG signature prognosis score indicated the
correlated with advanced stages and tumor progression, poorer OS of HCC patients no matter whether patients
which could help improve the management of patients with presented with macro-VIs, micro-VIs, or not. In short,
HCC and provide decision-making guidance on the treat- the novel constructed NMRG signature, which was not
ment selection. Moreover, the NMRG signature had rela- only a prognostic biomarker but also a VI predictor, would
tively better sensitivity and specificity as an independent help clinicians and/or physicians better manage the HCC
prognostic predictor compared to the traditionally clinico- patients.
pathological features. The NMRG signature-based prognos- In addition to the enriched pathways of cell cycle and
tic nomogram was finally constructed, with better AUC DDR which were of importance to carcinogenesis and pro-
values and great potential to be applied to clinical practices. gression of tumor [45, 46], it could be conspicuously found
A pan-cancer study by Yuan et al. revealed that the coex- that fatty acid metabolism was the top-ranked enriched
pression networks of mitochondrial genes and their related pathway. The recent study revealed that RIPK3, playing an
nuclear genes were distinct across 13 cancer types, and in important role in necroptosis, could regulate fatty acid
HCC the coexpression of mitochondrial genes was highly metabolism including fatty acid oxidation in hepatocarcino-
correlated with cancer-related signaling pathways, such as genesis [47], and the abnormal regulation of fatty acid oxida-
PI3K [18]. Besides, the enriched pathways were further tion causing the large amount of ROS promoted HCC cell
found to be implicated with cell cycle, such as E2F targets, migration and invasion [48]. Therefore, the elimination of
G2/M checkpoint, MYC targets, mitotic spindle, and DDR- ROS via antioxidant drugs [49] and/or the blockade of fatty
related pathways in multiple cancer types [18], consistent acid metabolism [47] could, as an effective treatment strat-
with the results of functional enrichment of DEGs between egy, suppress the HCC progression to improve the HCC
the high- and low-risk groups in the present study. As prognosis, simultaneously regulating the cell cycle and/or
reported previously, some certain mitochondrial-related DDR-related pathway via CDK inhibitors [50]. Moreover,
genes have been proved to be strongly associated with prog- the accumulation of ROS could induce tumor-associated
nosis in certain cancer types. For example, NDUFV2, known macrophage M2 polarization in the tumor microenviron-
as NADH ubiquinone oxidoreductase core subunit V2, ment of HCC [47], which would enhance the progression
might act as a prognostic factor in uveal melanoma [19]. of HCC [51]. Thus, the regulation of mitochondrial respira-
The aberrant expression of NADH dehydrogenase 1 alpha tion or ROS level, as a treatment strategy for HCC, also
subcomplex assembly factor 1 (NDUFAF1) caused mito- could restrain the immunosuppressive activities of tumor-
chondrial respiration deficiency, which was correlated with associated macrophages and improve the tumor microenvi-
the carcinogenesis of primary pancreatic cancer [20]. Some ronment. In the present study, the high-risk group had the
other NMRGs, such as LRPPRC [21], DARS2 [12], GARS higher fraction of B cell memory, T cell follicular helper,
[22], ATAD3 [23], TRMU [24], and PDSS1 [25] had been and regulatory T cells (Tregs). These tumor-infiltrating lym-
identified to be correlated with the carcinogenesis and pro- phocytes (TILs) were suggested to be related to the response
gression in HCC. Moreover, the aberrant expression of of immune checkpoints such as PD-1 and PD-L1 [25, 52], so
COX15 [26], LARS [27], PARS2 [28], MRPL3 [29], ISCU that the efficacy of PD-1/PD-L1 inhibitors may be differed
[30], COQ7 [31], SPG7 [32], TRMT10C [33], and COQ6 between high- and low-risk patients. Meanwhile, in patients
[34] were found to have certain influence on the tumor inva- from the high-risk group there was a significantly higher
sions in many other cancer types. However, in the present abundance of Tregs indicating the suppressive immunother-
study, it was the first time that the expressions of these apy in HCC as reported before [53], while tivozanib [54] and
NMRGs, including HARS2, MPV17, MTFMT, C12ORF65, cystathionine β-synthase [55] could decrease Tregs infiltra-
FRDA, CARS2, VARS2, and CABC1, were found to have tion. Therefore, the combined treatment of immune check-
influence on the progression of HCC patients. Although point inhibitors, such as PD-1/PD-L1 inhibitors, with the
some of them had already been identified to be associated antioxidant drugs and tivozanib or cystathionine β-synthaseYou can also read