Flood risk and financial stability: Evidence from a stress test for the Netherlands - No. 730 / November 2021
←
→
Page content transcription
If your browser does not render page correctly, please read the page content below
No. 730 / November 2021

Flood risk and financial stability: Evidence
from a stress test for the Netherlands

Francesco Caloia and David-Jan Jansen
Flood risk and financial stability: Evidence from a stress test for the Netherlands

Francesco Caloia and David-Jan Jansen*

* Views expressed are those of the authors and do not necessarily reflect official positions
of De Nederlandsche Bank.

                                                                De Nederlandsche Bank NV
Working Paper No. 730                                           P.O. Box 98
                                                                1000 AB AMSTERDAM
                                                                The Netherlands

November 2021
Flood risk and financial stability:
Evidence from a stress test for the Netherlands *
Francesco Caloia David-Jan Jansena
De Nederlandsche Bank, VU Amsterdam De Nederlandsche Bank, VU Amsterdam
November 2, 2021
Abstract
If climate change continues unabated, extreme weather events are ex-
pected to occur more frequently. Rising flood incidence will especially
affect low-lying countries, both through property damage and macro-
financial adversity. Using a stress test framework and geocoded data
on real-estate exposures for Dutch banks, we study when floods would
start impairing financial stability. We find that the banking sector is
capitalised sufficiently to withstand floods in unprotected areas, where
there is relatively little real estate. However, capital depletions would
increase quickly in case more severe floods hit the densely-populated
western part of the Netherlands. These findings have possible implica-
tions for various policy areas, including macroprudential policy.
JEL codes: G21, Q54, R30
Keywords: financial stability, flood risk, real estate, stress test
*
Acknowledgements: We received helpful comments at a DNB research seminar, a
Eurosystem workshop on Climate Change Analytics, and during discussions with Maarten
Bosker, Wouter Botzen, Ferdinand Diermanse, Hans de Moel, and Kymo Slager. We
also thank our colleagues at de Nederlandsche Bank for helpful feedback. We especially
thank Merel Vrolijk for contributions during the initial phase of this project. We also
thank Jack Bekooij for data support. Naturally, any errors and omissions remain our own
responsibility. Views expressed in this paper do not necessarily coincide with those of de
Nederlandsche Bank or the Eurosystem.
a
Corresponding author; E-mail: d.jansen@dnb.nl.
12
1 INTRODUCTION
This paper studies conditions under which floods become a financial stability
concern. Climate change implies slow shifts in the weather distribution
(Auffhammer, 2018). Such shifts would mean that extreme weather events
occur more frequently. The historical record already indicates that floods
can cause economic damage.1 Examples include the 2005 floods in New
Orleans after hurricane Katrina, the U.K. winter floods of 2013-14, and the
2021 floods in several European countries. Should climate change continue
unabated, at some point the macrofinancial impact of frequent floods may
become so material, that financial stability will be impaired. It is important
— for policymakers and practitioners alike — to understand how and when
floods could become a systemic-risk concern.
The notion that climate change can imply a financial stability risk is
no longer new. In a well-known speech, Mark Carney (2015) was one of
the first to argue this point. Likewise, the European Systemic Risk Board
(ESRB, 2016) has argued that a delay in the energy transition could af-
fect systemic risk via three main channels, one of which is a rise in the
incidence of natural catastrophes. The Network for Greening the Financial
System (NGFS, 2019) has emphasized that climate change could have much
larger impacts than other sources of structural change affecting the financial
system, necessitating the integration of climate-related risks in financial sta-
bility monitoring. Bolton et al. (2020) have suggested that climate change
could lead to so-called ‘green-swan’ risks and, therefore, even be the cause of
the next systemic financial crisis. These examples are, by no means, exhaus-
tive, with other contributions in this policy debate including ECB (2019),
Lane (2019), and Georgieva (2021).
To incorporate climate-change-related concerns in financial stability mon-
itoring, an important step is risk quantification. Quantification is crucial for
1
See also Dell et al. (2014) for an overview of how weather impacts the economy.3 financial firms to manage properly climate-related financial risks, while it also allows supervisors and regulators to assess whether financial firms are in control. To some extent, quantifying how climate change feeds into finan- cial risks is still a challenging task. As summarized by Bolton et al. (2020), climate-financial risks are characterized by deep uncertainty, potential non- linearities, and most likely fat-tailed distributions. Still, progress on risk quantification is being made, for instance in the form of climate stress tests. Stress testing is an approach that is often employed to identify tail-risk vulnerabilities. To identify tail risks, stress testing uses macrofinancial assumptions that are severe, but still plausible (Basel Committee on Banking Supervision, 2018). A well-known example of a climate stress test is that by Battiston et al. (2017), who use data on over EUR 1 trillion of equity holdings of the largest 50 European banks. They find that, while direct equity exposures to fossil fuels are small, the overall exposures to climate-policy relevant sectors are both large and heteroge- neous. In a stress test for climate transition risks, Vermeulen et al. (2021) find that the CET1-ratio of Dutch banks could decline by several percentage points in case much more stringent carbon pricing would be implemented. A third example is the climate stress test by the French supervisor ACPR for banks and insurers. This stress test found an overall moderate exposure for French financial institutions so far, but also highlighted how the speed and impact of climate change could well increase severity in the next decades (ACPR, 2021). To quantify flood-related financial stability risks, we start from a stan- dard approach to financial stress testing, which we then modify to incorpo- rate flood-risk considerations. In building on a standard approach, we follow Vermeulen et al. (2021). Our flood stress framework has three distinctive features. A first feature of our analysis is its focus on real estate. As the global
4

financial crisis of 2007-08 has underlined, shocks to real-estate exposures can
have severe implications for the stability of the financial system. It is not
unthinkable that a future real estate shock could be due to climate change.
In particular, the property damages related to climate physical risks may be
an important tail-risk event impacting the soundness of the financial system.
   A second distinctive feature is that we provide a perspective for the
banking system as a whole. Although individual banks can focus on their
individual exposures — and some are doing so — the macroprudential per-
spective requires a broader approach. Our analysis offers such an approach
using data for ten Dutch banks. To begin with, we use granular data on real-
estate exposures to determine sensitivity to flood risk. We combine several
data sets to gain insights into the location of individual real-estate objects
as well as the loan contracts for which these objects serve as collateral. Cou-
pled with official flood risk maps, we then assess the climate-financial-risk
implications of floods at the level of 4-digit postal-code areas. In the overall
stress test, we use all available exposures from supervisory data sources in
order to also assess the sensitivity to broader macrofinancial adversity. By
focusing on the overall exposures of these ten banks, we capture more than
95% of the assets of the Dutch banking sector.
   A third distinctive feature is that we run, in essence, a reverse stress
test. This approach is in line with our aim to understand when floods imply
systemic risk. Such an aim implies a willingness to consider truly extreme
scenarios or calibrations, even if these would, at present, be characterised
by very low levels of probability. We assume, in some scenarios, very strong
macrofinancial impacts or extreme levels of flood inundation. To be clear, we
are not implying that climate physical risks will already be much more likely
or severe in the immediate future. Rather, our use of a reverse test follows
from the realization that climate change is surrounded by deep uncertainty.
Whether we will indeed more often see extreme weather events is going to
5

depend on the nature of the energy transition. In turn, the progress of
the energy transition depends on climate policies, energy technology, and
consumer preferences. Though it is possible to model these processes, any
projection is surrounded by large degrees of uncertainty, in particular as
soon as the projection horizon extends beyond the next few decades.2
        Turning to results, a first conclusion is that the Dutch banking sector has
sufficient capital to withstand scenarios with floods in unprotected areas.
In those scenarios, the additional capital depletion lies between 110 and
132 basis points. Such magnitudes are still much smaller than commonly
reported for bank stress tests. The intuition is that in those parts of the
country, there is relatively little real estate and economic activity. However,
capital depletions increase quickly once we start assuming flood stress in
protected parts of the country. In particular, a flood with an extreme level
of inundation in the populated areas of the western half of the Netherlands
would put severe stress on the soundness of the banking system. In that
most extreme case, the flood event would mean a decline of the CET1-ratio
within one year of well over 700 basis points.
        This paper proceeds as follows. Section 2 discusses three strands of
related literature, while section 3 outlines our stress test framework. Section
4 describes the data, and section 5 presents results for the stress test. Section
6 places the effects on banks’ capital positions in context, while section 7
offers concluding comments.

2        RELATED LITERATURE

The literature often classifies the economic damage of a flood, or natural
disasters more generally, as either direct or indirect. The direct impact
includes everything related to the physical destruction from the disaster
    2
        Examples discussing uncertainty in the context of climate change include Barnett,
Brock, and Hansen (2020), ESRB (2016), Lane (2019), and Pindyck (2013).
6 itself. Property damage is one example; other examples include loss of life and damages to infrastructure. Indirect impacts include all follow-up consequences of the initial destruction, for instance additional disruptions to business processes (Kousky, 2014). As Section 3 will discuss, our stress test considers impacts at two levels: property damages and macrofinancial adversity. Of these, the former are direct effects, while the latter combines direct and indirect effects. In Section 3 we will also discuss how we connect our damage estimates to macrofinancial effects using the macroeconometric model NiGEM. Below, we first discuss the empirical evidence on the economic impacts of floods. Section 2.1 discusses direct impacts on property values and section 2.2 then turns to broader macrofinancial impacts. The purpose of the discus- sion is to get a sense what ‘severe, but plausible’ could mean in the context of a flood-risk stress test. In section 2.3, we discuss recent work (academic as well as policy-oriented) that uses stress testing to study climate-change financial stability risks. 2.1 Estimates of property damages For our stress test, we are interested in estimates of property damage in the wake of actual floods. As highlighted by Beltrán et al. (2019), this question differs from asking to what extent properties located in a floodplain already trade at different prices. In the former case, the actual risk has materialised, which is the relevant perspective for our stress test. In the latter case, which is the approach most papers seem to take, the point is inferring to what extent flood risk is already priced in. One example of such a study in the Dutch context is Bosker et al. (2019), who find that house prices are on average 1% lower in places at risk of flooding. Based on a meta-analysis for studies focusing on the U.S., Beltrán et al. (2018) suggest a price discount
7

for a location within the 100-year floodplain of 4.6%.3
       Turning to the empirical literature on actual damages, estimates for
value effects range from small (around 4%) to substantial (50% or more).
For floods along the Meuse river in the Netherlands in the mid-1990s, Daniel
et al. (2009) estimate a price decrease of up to 9%. Atreya and Ferreira
(2015) combine a hedonic pricing model with geospatial information to study
the 1994 flood in Albany, Georgia. Their estimates for price declines range
up to 48%, which is the difference between inundated floodplains properties
and non-inundated properties outside the floodplain. Pistrika and Jonkman
(2010) assess a database of 95,000 damage estimates for buildings in New
Orleans due to flooding after hurricane Katrina. They report an average
damage rating of 43.3%. Damage rates of more than 50% are reported
for 27.6% of the assessed properties. Two further studies focus on floods
in the U.K. Beltrán et al. (2019) use a repeat-sales model to analyse the
price path of properties affected by floods between 1995 and 2014. Their
estimates for price declines in flooded areas range between 21% (in case of
coastal flooding) and 25% (in case of inland flooding). Importantly, these
price declines are estimated to be short-lived, as differences are no longer
significant after a period of 5 years. Garbarino and Guin (2021) focus on one
severe flood event flood in England in 2013-14. They find relatively small
price effects related to this flood. Compared to unaffected properties in the
same district, properties in affected areas shows decreases in sales prices of,
at most, 4.2%.
   3
       An actual flood event also increases the salience of the associated risk, which can lead
to a higher price discount for non-flooded properties that are located in the floodplain.
See, for example, Zhang and Leonard (2019).
8
2.2 Broader macrofinancial adversity
For the purposes of our stress test, the literature on natural disasters sug-
gests two main points with respect to macrofinancial impacts.4
First, the negative effects of natural disasters on economic growth are
short-lived. Based on a panel VAR, Raddatz (2007) estimates that in devel-
oping countries, a climatic natural disaster leads to a decline in real GDP
of 2%. This effect on output has disappeared after five years. Cavallo et
al. (2011) analyze a sample of 196 countries between 1970 and 2008. Based
on synthetic control methods, they find that only extremely large disasters
continue to have a negative effect on output in the long run. Even then, this
long-run effect is due to radical political revolutions following the disasters.
A second finding is that effects of most natural disasters are mild, espe-
cially in developed countries. Based on growth regressions, Noy (2009) finds
a negative relationship between property damage and economic growth. In
developing countries, this relationship is much stronger. There, a one stan-
dard deviation increase in damages leads to an output decline of 9%. In
developed countries, this marginal effect is less than 1%. Focusing on the
growth impact of hurricanes in the U.S., Strobl (2011) finds evidence of a
growth decline at the county level (of 0.45 percentage points) but no effect
on national growth rates.
From the perspective of plausibility, the empirical evidence would suggest
to focus the stress test on short-term effects, while also not assuming large
growth declines. However, especially with respect to the latter point, it
is important to keep in mind that the historical record only offers limited
guidance in the context of climate change. Even if the impact of climate
physical risk has not been large yet, it may well become much more poignant
at some point (Bolton et al., 2019). Also, in line with our notion of doing
a reverse stress test, we are open to exploring calibrations that may seem
4
This section draws on Kousky (2014) and Batten (2018), and references therein.9 large in light of the impacts of natural disasters so far. 2.3 Work on climate stress testing Climate stress testing still is a relatively new field, yet attention is grow- ing fast. The best-known example to date is by Battiston et al. (2017). Using data on over EUR 1 trillion of equity holdings of the largest 50 Euro- pean banks, they find that while direct equity exposures to fossil fuels are small, the overall exposures to climate-policy relevant sectors are large as well as heterogeneous. Another early contribution was a study by the Uni- versity of Cambridge Institute for Sustainability Leadership (2015), which combined macroeconomic simulations of energy transition scenarios with industry-specific risk factors to gauge the potential losses for investment portfolios. Studying the Netherlands, Vermeulen et al. (2021) construct four tail-event transition scenarios, which incorporate shocks to climate pol- icy and energy technology. Analysing granular data on EUR 2.3 trillion in assets of more than 80 Dutch financial institutions, Vermeulen et al. (2021) find that financial losses due to credit and market risk could be sizeable, suggesting that climate-transition risks warrant close attention from a fi- nancial stability perspective. Using a micro-founded stress test, Faiella et al. (2021) conclude that climate risks in Italy are still limited overall and specific to individual households and firms. Lastly, Jung et al. (2021) pro- pose a new measure (CRISK) which is the expected capital shortfall of a financial institution in a climate stress scenario. This measure indicates a strong rise in climate vulnerabilities for banks in the U.S., U.K., Japan and France in recent years. Important steps are also being taken in the policy domain. The French ACPR (2021) has conducted a pilot exercise for 9 banking groups and 15 insurance groups under its supervision. The exercise focused on both tran- sition and physical risks. For the moment, the exercise revealed an overall
10

moderate exposure and vulnerability to climate risks. The European Cen-
tral Bank (ECB) has published an economy-wide stress test, which assesses
the resilience of both companies and banks in the euro area to a range of
climate scenarios. As discussed by De Guindos (2021), it finds that climate
change represents a major source of systemic risk, in particular for banks
with exposures concentrated in certain economic sectors or regions. Third,
the Bank of England’s 2021 Climate Biennial Exploratory Scenario (CBES)
will explore the resilience of the U.K. financial system to physical and tran-
sition risks. For banks, the CBES will focus on credit risk for the banking
book, with a particular focus on risks to large counterparties. For insurers,
the CBES focuses on invested assets as well as insurance liabilities.

3     METHODOLOGY

3.1   Framework

Figure 1 shows the structure of our flood stress test. As in the transition
stress test of Vermeulen et al. (2021), we build on the standard multi-step
approach to financial stress testing, which we then modify to incorporate
flood-related considerations. We start with a set of six adverse scenarios,
each of which has different calibrations with respect to flood events. In the
second step, we map these narratives to economic conditions, in this case
damages to property as well as macrofinancial adversity in a broader sense.
Based on these economic conditions, we turn to stress test models, which we
will use to map out implications for the resilience of banks. We now turn to
a detailed description of the scenarios, calibration, and stress test modules.
Section 4 will give more details on the data sets.

    [INSERT FIGURE 1 AROUND HERE]
11
3.2 Mapping out flood risk
In terms of narrative, the stress test starts with flood maps provided by the
Dutch government. These maps constitute the national implementation of
the 2007 E.U. Floods Directive. Among other things, this Directive requires
Member States to assess flood risk, map the flood extent, and provide in-
formation to the public on the results.5 In the Dutch case, the research
institute Deltares makes these flood risk calculations based on various sim-
ulation models (Slager, 2019). For the general public, information on flood
risk is available via a dedicated website.6 After entering the postal code
of their current residence, people will get an indication of flood risk, for
instance the maximum height the water could reach in the vicinity of their
residence in case of a flood. In addition, there is also information on pos-
sible implications of a flood, such as the unavailability of gas or electricity.
For professionals, a wide range of detailed information (including flood risk
maps) is available via the National Informationsystem Water and Floods.7
In addition, there is specific guidance on running a climate stress test at the
local level. For instance, provinces or municipalities can use this guidance
to assess physical vulnerabilities to factors such as flood, heat, or drought.8
Based on the flood maps, we zoom in on geographical areas within the
Netherlands that are designated as having a potentially significant flood risk
(in Dutch: ‘Gebieden met een Potentieel Significant OverstromingsRisico’
or GPSOR.) The fact that the risk is ‘potentially significant’ chimes well
5
For details, see https://eur-lex.europa.eu/legal-content/EN/TXT/?uri=CELEX:
32007L0060. URL last accessed on 17 June 2021.
6
www.overstroomik.nl. URL last accessed on 17 June 2021.
7
In Dutch: Landelijk Informatiesysteem Water en Overstromingen (LIWO).
See also https://www.helpdeskwater.nl/onderwerpen/applicaties-modellen/
applicaties-per/watermanagement/watermanagement/liwo/. URL last accessed
on 17 June 2021.
8
For information, see https://klimaatadaptatienederland.nl/stresstest/
bijsluiter/. URL last accessed on 24 July 2021.12
with the standard aim of a financial stress test to consider situations that
are ‘severe, but plausible’. Importantly, the designation of GPSOR already
indicates a potential loss of life or economic damages of more than 40 million
euros.
Table 1 shows two relevant dimension of Dutch flood zones. As de-
scribed in Slager (2019), the Dutch GPSOR areas are distributed across
four catchment areas, i.e. the overall area for which all water drains off into
a common outlet. These four catchment areas are those of the following
rivers: the Rhine, the Meuse, the Scheldt and the Ems.9 For each of these
four catchment areas, a further distinction is made based on two dimen-
sions: whether or not there is formal protection against water, and whether
the water system is primary or regional. All four combinations of these two
dimensions are designated by the letters A - D.
[INSERT TABLE 1 AROUND HERE]
Next, we use geodata for the GPSOR classes from a dedicated govern-
ment website. This dataset indicates, at the level of (x,y)-coordinates, the
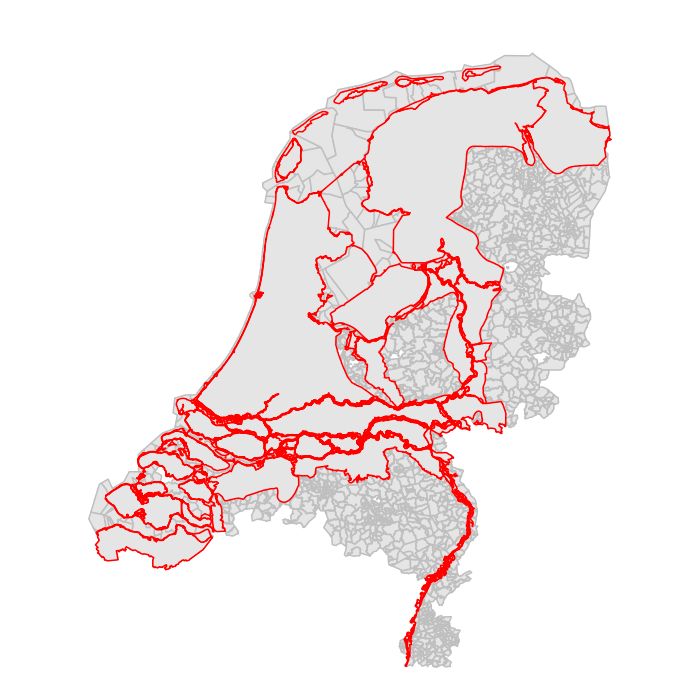
geographical boundaries of the GPSOR areas.10 Figure 2 indicates the at-
risk parts of the Netherlands that we focus on in this paper. The areas
shaded in red indicate those areas that are at risk from flood type A, while
the gray areas are at risk from flood type B. As can be seen, most of the
areas susceptible to those flood types are in the western part of the Nether-
lands.
[INSERT FIGURE 2 AROUND HERE]
An important consideration for focusing on flood types A and B is insur-
9
In Dutch, respectively, de Rijn, Maas, Schelde, and Eems.
10
See Appendix A for links to the geodata.13
ability. In the Dutch context, insurance policies cover some, but not neces-
sarily all types of flood risk. Since 2018, effects of local floods are covered by
insurance policies under the so-called ‘precipitation clause’ (in Dutch: neer-
slagclausule). These local floods correspond to types C and D. Our current
stress test does not focus on these two flood types, as financial consequences
would be covered by insurers and not banks.11 However, coverage against
flood risk is mostly excluded for properties located outside of areas protected
by dikes (i.e. at risk from flood type A). Insurance policies almost always
also do not cover damages in case of failure of a primary defense against the
water (i.e. flood type B). In case of a major flood the government could,
in principle, offer support under the terms of the Calamities Compensation
Act (in Dutch: Wet tegemoetkoming schade bij rampen). However, there is
no formal obligation to cover part (let alone all) of the property damage. In
that case, the property owners would need to bear the costs. To the extent
that financial buffers of households would not be sufficient, it becomes in-
creasingly likely that there would be financial implications for banks. There
is already some evidence that Dutch floodplain inhabitants underestimate
the maximum expected water level of a flood (Mol et al. 2020). In addition,
survey evidence suggests that home-owners in flood-prone areas do not have
higher financial buffers (Caloia et al, 2021).
To connect the flood maps with the data on banks’ real-estate exposures,
we map the flood areas to the level of postal codes at the 4-digit level. Table
2 shows the distribution of postal codes across the 8 GPSORs of type A and
B. As the table shows, most of the postal codes at risk lie in the catchment
area of the Rhine and are of the type B. With this information in hand, we
can connect flood risk to our data on the location of real-estate exposures.
11
In that case, the insurers most likely would turn to reinsurers. This paper does not
cover that particular channel. See also section 3.2 of DNB (2017) for further discussion
on insurability of flood risk in the Dutch context.14 [INSERT TABLE 2 AROUND HERE] 3.3 Scenario calibrations: floods and damages For flood types A and B, we consider three levels of water stress. Thus, our stress test has six different calibrations. We start from a low level of water stress, then consider an intermediate level, while also considering an extreme level of stress. In choosing these three levels, we broadly follow available guidance on flood incidence and associated inundation depths pro- vided by a Dutch government expert group (Stuurgroep Water, 2018). The top panel of Table 3 has information on the flood characteristics associated with these stress levels. The inundation depth ranges from 1 meter (in sce- narios with low severity) to 5 meters (in the extreme scenarios). Broadly speaking, such events could be expected to occur once in 50 years (low), once in 500 years (intermediate) or less than once every 2000 years (extreme). [INSERT TABLE 3 AROUND HERE] It is important to note that our paper looks at scenarios where all areas at risk from either flood type A or B are assumed to be affected simultaneously. We realize this is a strong assumption. But, we would argue it is in line with our aim of doing a reverse stress test. By considering such extremes, our stress test shows what could ultimately be at stake. Naturally, in future work, it will also be informative to consider more isolated floods that could affect individual parts of the Netherlands that are at risk from a particular flood type. To compute the property damage associated with these six scenarios, we use damage functions provided in the so-called National standard method 2017 (Slager and Wagenaar, 2017). These damage functions take inundation depth as input and generate property damage (in euros) as output. There
15

are separate functions for damage to the property itself and damage to
household goods and personal effects. We focus on the damage function
for the property itself, as it is the property to which the bank would have
recourse in case of default. For our stress test, it is important that the
standard method also distinguishes between types of real estate. In this
paper, we exploit the granularity of our data sources at the level of 4-digit
postal-code areas. Further details on how we use the standard method are
in Appendix C. Section 3.5 will discuss how we use the damage estimates
to calibrate the relevant parameters in the credit-risk modules.12

3.4       Scenario calibrations: macrofinancial

As discussed in Section 2.2, the literature so far has found relatively mild
effects of natural disasters. In line with this, recent estimates by a Dutch
government expert group also suggest that, in most cases, flood damages
would be limited. For instance, in a low-stress flood event of type A, the
overall economic damages are estimated to be around EUR 1 billion. How-
ever, for flood type B, individual floods could have impacts of up to EUR 25
billion. In the worst-case outcome, up to 250.000 people could be affected
by a flood of type B. The sum total of economic damages for flood type
B in the most extreme scenario could well be EUR 500 billion or more.13
The intuition is clear: flood type B affects most of the western half of the
Netherlands, where the country’s industry, commerce, and people are con-
centrated.
       In the stress test, we will use calibrations for economic growth that start
at a one-year decline of 0.5 percentage point (in the low-stress scenario for
  12
       DNB (2017) also relied on the National standard method in an exploratory estimation
of credit losses. That analysis focused on two specific regions in the Netherlands, namely
the Rivierenland region and the Kromme Rijn region.
  13
     The numbers in this paragraph are taken from Table 4.2 and Figures 4.7 and 4.8 in
Stuurgroep Water (2018).
16
unprotected areas) and that range up to declines of ten percentage points
in the extreme scenario for flood type B. For the low-stress scenarios, these
calibrations may be somewhat severe, but that would be in line with our
aim of doing a reverse stress test. A growth effect of ten percentage points
is larger than usually used in stress tests. Such a strong decline would be
in line with the concentration of economic activity in those areas vulnerable
to floods of type B.
Following Vermeulen et al. (2021) and recent work by the NGFS, we use
the macroeconometric model NiGEM to ensure internal consistency between
the GDP shocks and other macrofinancial variables.14 Vermeulen et al.
(2021) used NiGEM to create four consistent scenarios with macrofinancial
stress for their energy-transition stress test. The NGFS has used NIGEM to
generate calibrations for chronic physical climate risks.15 For acute physical
impacts such as floods, standard calibrations at the country level are not yet
readily available. However, the climate version of the NiGEM model offers
two routes to calibrating macrofinancial shocks. Appendix C outlines the
details on this approach. The additional macrofinancial variables that we
use as inputs for the stress test modules are unemployment, funding costs,
and stock market returns.16
14
For details on this model, see also https://nimodel.niesr.ac.uk.
15
For further information on the NGFS scenarios, see https://www.ngfs.net/
ngfs-scenarios-portal/
16
Our calibration does not incorporate shocks to government credit spreads. As noted
in Section 3.2, the government is not formally obliged to provide financial assistance in
the aftermath of a flood. Following the approach of a reverse stress test, we do not assume
government assistance explicitly. If the government were to step in, this would alleviate the
impact on banks via the credit risk channel. However, to the extent that the government
credit spread would increase, it could still have an impact via losses on government bonds
in banks’ portfolios.17
3.5 Stress test framework
To analyse the financial implications of the various flood scenarios for banks,
we use a top-down stress test framework that is used by de Nederlandsche
Bank to support its macro- and microprudential responsibilities.17 As de-
scribed in Daniëls et al. (2017), the modules in this framework represent
different parts of a bank balance sheet and its profit and loss accounts. In
previous work on climate stress, Vermeulen et al (2021) also relied on this
model to compute implications of energy-transition scenarios.
As indicated in Figure 3, our flood stress test uses modules for credit risk,
market risk, and profitability. We use the basic version of these modules,
with one important exception concerning the credit risk module.18 For the
credit risk parameters, we use calibrations that are specific to scenarios and
banks. The former, naturally, accounts for the differences in flood severity.
The latter takes into account that banks may differ in terms of exposure
to flood types, as well as in terms of starting point credit risk. To give an
example, if a bank has no collateral that is exposed to floods, the increase
in the loss-given-default (LGD) parameter only reflects the evolution of the
macrofinancial scenario. Instead, banks with a high share of exposures at
risk from floods will observe a high increase in the resulting LGD parameter,
too, as a result of the property damage. Banks that are more exposed in the
case of floods will likely see a higher increase in the probability of default
(PD) too, as some debtors (especially non-financials) will no longer be able
to meet their obligation.
In our framework, the increase in credit risk as a consequence of the flood
is captured by the PD and LGD parameters, which are estimated by means
17
In a top-down approach, the central bank or supervisor makes an assessment of the
stress impact using its own set of models and data. The alternative is a bottom-up
approach, where financial institutions themselves are responsible for making the impact
calculations. The EBA banking stress test is one example of a bottom-up approach.
18
See Appendix D for further details on the modules.18 of two satellite modules. The PD module returns default projections based on a combination of three sources of shocks: interest rate risk, business risk and collateral repricing risk. Interest rate risk captures the risk associated to changes in the financing conditions of the debtor. An increase in inter- est rates translates into an increase in the debt service amount of variable interest rate loans and loans subject to interest rate reset. This leads to an increase in the probability of not being able to meet the outstanding obliga- tion. Business risk captures the risk associated to changes in the economic environment, which leads to a change to the earnings and profitability of households and non-financial corporations, and ultimately to their repay- ment capacity. Eventually, collateral repricing risk captures the strategic default choice associated to a loss in the value of the real estate securing the loan. In the event of a flood, a substantial damage to the property can make debtors also financially go underwater, as the outstanding loan amount may become much higher than the current value of the property. This can ulti- mately affect their decision to continue to service their loans, especially in the case of limited-liability firms that use the commercial real estate for own business use. The LGD module returns the percentage loss that the bank would incur, after that a debtor defaults on a mortgage and the real estate object used as collateral is been liquidated. In this module, the increase in LGD entirely reflects the damage hitting bank real estate collaterals. It does not depend on the macroeconomic context. 4 DATA DESCRIPTION To assess implications of flood risk, we make use of several proprietary data sources: supervisory data, loan-level data, and administrative microdata. The analysis covers a sample of ten Dutch banks. Together, these ten banks represent more than 95% of total assets of the Dutch banking sector. We now describe the three data sources in more detail.
19

      Starting with the supervisory data, we rely on the Common (COREP)
and Financial (FINREP) Reporting frameworks. The COREP and FIN-
REP formats cover the import important aspects of banks business, such as
the balance sheet composition, profitability, capital adequacy, asset quality
and funding conditions. The information in these templates is reported at
quarterly frequency and at the highest level of consolidation. For the stress
test, the starting points for exposures are those for the fourth quarter of
2020.
      Second, we use loan-level data that is being collected by de Nederland-
sche Bank. This loan-level data covers all residential real estate (RRE) and
commercial real estate (CRE) properties that serves as collateral for loans
provided by Dutch credit institutions. These two datasets contain detailed
information on each counterparty (creditor, debtor, servicer), contract, in-
strument and protection associated to each residential and commercial real
estate loan. The information is available at quarterly frequency and covers
both the stock and the flow of new loans granted in each reporting period.
      Third, we rely on administrative microdata at the level of the residential
and commercial real estate objects from Statistics Netherlands. This admin-
istrative data covers all objects registered in the basic registry.19 This basic
registry contains several types of information collected for administrative
purposes. To begin with, the registry has information on the tax value of
each property. In addition, the data set contains a range of property charac-
teristics, such as floor surface (in m2 ), location (down to the neighborhood
level) and the type of real estate. We use location to determine the level of
flood risk, while we use the other characteristics in the computations for the
property damage.
 19
      In Dutch: ‘Basisregistratie Addressen en Gebouwen’.
20
5 RESULTS
Figure 3 illustrates our key findings. The figure reports the system-wide ef-
fect on banks’ capital positions in the six stress scenarios. The vertical axis
shows the effect on the CET1-ratio (in basis points). We measure this effect
as the difference between the level of the capital ratio in the stress scenario
and a baseline projection.20 The horizontal axis denotes two dimensions:
flood types and severity. The first three bars indicate effects in case a flood
affects unprotected areas. The second set of three bars shows results when
a flood affects areas that are, in principle, protected. For both flood types,
we show results for the three levels of waters stress, ranging from 1 meter
to up to 5 meters.
[INSERT FIGURE 3 AROUND HERE]
Starting with results for unprotected areas, the effects on bank capital
remain limited at all three levels of severity. If we assume a water level of
1 meter, the additional decline in the system-wide CET1-ratio is 110 basis
points (Figure 3, most-left bar). Such a decline is certainly not negligible,
but it appears small compared to recent outcomes of bank stress tests. When
we increase the severity of water stress to an inundation depth of 5 meters,
the effect on capital comes in at 132 basis points (third bar from the left).
The key intuition here is, of course, that only a fraction of Dutch real estate
properties are located in the unprotected areas. Naturally then, the prop-
erty damages will be small. In addition, there is very little macrofinancial
adversity associated with floods of unprotected areas.
However, capital depletions would increase quickly when we turn to sce-
narios that focus on the densely-populated western part of the Netherlands.
20
For the baseline, we use the macroeconomic outlook in DNB (2020). This baseline
projected a gradual recovery from the covid pandemic in the course of 2021.21 A flood resulting in one meter inundation depth implies a capital decline of 307 basis points (Figure 3, fourth bar). An additional two meters of water stress results in a system-wide effect on the CET1-ratio of close to 400 basis points. The extreme level of water stress, i.e. five meters inundation, would lead banks’ capital to decline by 712 basis points. As the flood severity increases, the capital depletion is due increasingly to credit losses and increases in risk exposure amounts. To illustrate this, Figure 4 shows contributions of six factors to changes in the CET1-ratio. The top panel has results for a low-impact flood in unprotected areas; the bottom panel has results for an extreme impact flood in protected areas. In the former case, the banks’ operational profits are still sizeable. There is some depletion due to credit losses and increased risk exposure amounts. On the whole, the banks are still able to distribute dividends. In contrast, in the extreme flood case (bottom panel), the operational profits are much lower, and they are already taken up by the credit losses. There is also a strong increase in the risk-exposure amounts, which is due to the much higher level of LGD parameters. On the whole, banks no longer distribute dividends in this stress scenario. [INSERT FIGURE 4 AROUND HERE] We close by showing how different components of the scenario calibra- tions contribute to the capital depletion. Figure 5 shows the contribution of three main scenario components: damages to residential real estate (in red), damages to commercial real estate (in blue), and macrofinancial adversity (in green). The y-axis shows the percentage contribution, while the labels in the bars show the contribution in basis points. The left bar focuses on a low-stress event in unprotected areas; the right bar has results for the most extreme flood of type B. In the former case, most of the capital depletion is
22

due to the macrofinancial shocks, which are associated with a capital effect
of 59 basis points. In the latter case, most of the effect is due to the dam-
ages to residential real estate, which is associated with a capital effect of 402
basis points. The intuition here is that the property damage has a strong
LGD-impact, which leads to a marked increase in risk-weighted assets.

    [INSERT FIGURE 5 AROUND HERE]

6    DISCUSSION

We now provide further context to the size of the CET1 impact, in particular
focusing on how the more extreme flood scenarios link to systemic risk.
    A first point is that, at the very least, declines in the CET1-ratio of more
than 700 basis points are not common in stress tests for Dutch banks. In
the 2021 EU-wide stress test of the European Banking Authority (EBA),
the system-wide CET1 depletion for Dutch banks was 520 basis points,
while in 2018 the depletion was 530 basis points. Second, the depletion in
the EBA exercise is also due to operational risks, which our flood stress
test does not consider separately. The reason we do not consider them is
that, at least at the moment, the operational challenges of major floods
seem difficult to quantify. Nevertheless, in a qualitative sense, it is not
difficult to imagine a major impact of severe floods on business operations
of financial institutions. For instance, the headquarters of some of the banks
are actually located in areas that are at risk from floods. In addition, the
impact on infrastructure would most likely inhibit employees commuting to
the office. In contrast to the situation during the covid pandemic, working
from home may also be far from trivial, if employees themselves also live in
flood-prone areas. Third, in interpreting the numbers for the flood scenarios,
it is important to remember that they materialize over a relatively short
horizon. In the common set-up of the EBA stress test, banks are assumed
23
to be confronted with macroeconomic adversity over a three-year horizon.
In the flood scenarios, all of the impact is already concentrated in the first
twelve months after the flood event.
An even broader point is that the assets of insurers and pension funds
are also vulnerable to flood events. Increasingly, Dutch insurers and pension
funds take up a role in mortgage lending. Similar to banks, this means that
these institutions would face increased credit risks in the aftermath of severe
floods. Second, the non-banks hold relatively large asset positions in real
estate. Through these positions, the damage of major floods would lead to
severe mark-to-market losses. By combining different data sources, Caloia
et al. (2021) give a first indication of the total exposures at risk for Dutch
insurers and pension funds. They estimate that around two-thirds of these
institutions’ real-estate-related exposures are at risk from flood type B. In
total, these at-risk exposures for non-banks are close to EUR 90 billion.
7 CONCLUSIONS
This paper finds that, if climate change were to continue unabated, at some
point flood events could have implications for systemic risk. The evidence
we present uses a stress test framework that incorporates property damage
as well as broader macrofinancial adversity. To quantify the effects, we ap-
ply the stress test to geocoded real-estate exposures of Dutch banks. In
particular if the densely-populated western regions of the Netherlands were
hit by an extremely severe flood, the capital impact for Dutch banks would
be sizeable. Our calculations suggest capital impacts of more than 700 basis
points over a one-year horizon. Such a major financial impact of floods, to-
gether with additional adversity for non-banks, suggest that climate-change
physical risks have a potential to affect financial stability in a material way.
Taken at face value, our results are important for various policy areas.
First, they obviously underline the importance that the Netherlands has24 traditionally attached to robust flood defenses. Second, the flood scenarios consider tail-risks, which can be mitigated if the transition to a carbon- neutral economy were to take place in a timely and orderly fashion. The potentially detrimental effects of flood events seem relevant to incorporate in thinking about costs and benefits of various transition paths. Third, the notion that several areas of the Netherlands are particularly at risk, com- bined with our finding that this risk could affect the banking sector, could have implications for discussions on spatial planning. Lastly, there are po- tential implications for macroprudential policies. Our stress test points out which locations in the Netherlands are possible pockets of risk from the per- spective of financial stability. Admittedly, the scenarios we consider are still very much in the tail of the distribution. However, given the complexities that surround both our modeling efforts as well as the broader discussion on climate change, it seems advisable, at the very least, to start a structured discussion on possible policy reactions sooner rather than later. One aim of this paper is offering a framework to quantify financial impli- cations of climate-change physical risk in a structured manner. We provide first quantifications using the Netherlands as a case study. In closing, we re-emphasize that our estimates are surrounded by a degree of uncertainty. In future research, it will be interesting to incorporate the uncertainties sur- rounding our stress test approach in a more structured manner. Also, we note again that this paper takes possible consequences of floods to the very extreme. An interesting route for future work would be exploring the finan- cial impacts of flood at higher levels of granularity (i.e. by moving beyond the 4-digit postal codes) or focusing on individual areas particularly at risk from different flood types.
25

REFERENCES

   ACPR (2021). A first assessment of financial risks stemming from cli-
mate change: the main results of the 2020 climate pilot exercise.
   Atreya, Ajita, and Susana Ferreira (2015). Seeing is believing? Evidence
from property prices in inundated areas. Risk Analysis 35(5): 828-848.
   Auffhammer, Maximilian (2018). Quantifying Economic Damages from
Climate Change. Journal of Economic Perspective 32(4): 33-52.
   Barnett, Michael, William Brock, and Lars Peter Hansen (2020). Pricing
Uncertainty Indiced by Climate Change. Review of Financial Studies 33(3):
1024-1066.
   Basel Committee on Banking Supervision (2018). Stress testing princi-
ples. Available at: http://www.bis.org/bcbs/publ/d450.htm.
   Batten, Sandra (2018). Climate change and the macro-economy: a crit-
ical review. Bank of England Working Paper No. 706.
   Battiston, Stefano, Antoine Mandel, Irene Monasterolo, Franziska Schtze,
and Gabriele Visentin (2017). A climate stress-test of the financial system.
Nature Climate Change 7: 283-288.
   Beltrán, Allan, David Maddison, and Robert Elliott (2018). Is flood risk
capitalised into property vales? Ecological Economics 146: 668-685.
   Beltrán, Allan, David Maddison, and Robert Elliott (2019). The im-
pact of flooding on property prices: A repeat-sales approach. Journal of
Environmental Economics and Management 95: 62-86.
   Bolton, Patrick, Morgan Després, Luiz Awazu Pereira da Silva, Frédérick
Samama, and Romain Svartzman (2020). The green swan: Central banking
and financial stability in the age of climate change. Bank for International
Settlements.
   Bosker, Maarten, Harry Garretsen, Gerard Marlet, and Clemens van
Woerkens (2019). Nether Lands: Evidence on the price and perception of
rare natural disasters. Journal of the European Economic Association 17(2):
26

413-453.
   Caloia, Francesco, David-Jan Jansen, Helga Koo, Remco van der Molen,
and Lu Zhang (2021). Climate risk and real-estate financial risk. De Ned-
erlandsche Bank, Financial Stability Review, Fall 2021.
   Carney, Mark J. (2015). Breaking the tragedy of the horizon — climate
change and financial stability. Speech at Lloyds of London, 29 September
2015.
   Cavallo, Eduardo, Sebastian Galiani, Ilan Noy, and Juan Pantano (2011).
Catastrophic natural disasters and economic growth. Review of Economics
and Statistics 95(5): 1549-1561.
   Claessens, S., N. Coleman, and M. Donnelly, M. (2018). Low-For-Long
interest rates and banks interest margins and profitability: Cross-country
evidence. Journal of Financial Intermediation 35(A): 1-16.
   Daniëls, Tijmen, Patty Duijm, Franka Liedorp, and Dimitris Mokas
(2017). A top-down stress testing framework for the Dutch banking sec-
tor. DNB Occasional Studies No. 17-3.
   De Guindos, Luis (2021). Shining a light on climate risks: the ECBs
economy-wide climate stress test. Available at https://www.ecb.europa.
eu/press/blog/date/2021/html/ecb.blog210318~3bbc68ffc5.en.html.
URL last accessed on 22 June 2021.
   Daniel, Vanessa E., Raymond J.G.M. Florax, and Piet Rietveld (2009).
Floods and Residential Property Values: A Hedonic Price Analysis for the
Netherlands. Built Environment 35(4): 563-576.
   De Nederlandsche Bank (2017). Waterproof? An exploration of climate-
related risks for the Dutch financial sector.
   De Nederlandsche Bank (2020). Economic Developments and Outlook.
December 2020.
   Dell, Melissa, Benjamin F. Jones, and Benjamin A. Oken (2014). What
Do We Learn from the Weather? The New Climate-Economy Literature.
27

Journal of Economic Literature 52(3): 740 - 798.
   European Central Bank (2019). Climate change and financial stability.
Special feature in the May 2019 Financial Stability Review.
   European Systemic Risk Board (2016). Too late, too sudden: Transi-
tion to a low-carbon economy and systemic risk, Reports of the Advisory
Scientific Committee. No 6 / February 2016.
   Faiella, Ivan, Luciano Lavecchia, Valentina Michelangeli, and Alessandro
Mistretta (2021). A micro-founded climate stress test on the financial vul-
nerability of Italian households and firms. Bank of Italy Occasional Papers
No. 639.
   Garbarino, Nicola, and Benjamin Guin (2021). High water, no marks?
Biased lending after extreme weather. Journal of Financial Stability.
   Georgieva, Kristalina (2021). The IMF is placing climate change at heart
of its work. Remarks by IMF Managing Director at the Climate Adaptation
Summit. 25 January 2021.
   Gross, Marco, Björn Hilberg, and Cosimo Pancaro (2017). Satellite mod-
els for bank interest rates and net interest margins. In: S. Dees et al. (Eds).
STAMPe: Stress-Test Analytics for Macroprudential Purposes in the euro
area.
   Jung, Hyeyoon, Robert Engle, and Richard Berner (2021). Climate
stress testing. Federal Reserve Bank of New York Staff Reports No. 977.
   Kok, Christoffer, Harun Mirza, and Cosimo Pancaro (2019). Macro
stress testing euro area banks fee and commissions. Journal of International
Financial Markets, Institutions and Money 61: 97-119.
   Kousky, Carolyn (2014). Informing climate adaptation: A review of the
economic costs of natural disasters. Energy Economics 46: 576-592.
   Lane, Philip R. (2019). Climate Change and the Irish Financial System.
Economic Letter, Vol. 2019, No. 1.
   Mol, Jantsje M., W.J. Wouter Botzen, Julia E. Blasch, and Hans de
28

Moel (2020). Insights into Flood Risk Misperceptions of Homeowners in the
Dutch River Delta. Risk Analysis 40(7): 1450-1468.
   Pindyck, Robert S. (2013). Climate Change Policy: What do the Models
Tell Us? Journal of Economic Literature 51(3): 860-872.
   Pistraka, Aimilia and S. N. Jonkman (2010). Damage to residential
buildings due to flooding of New Orleans after hurricane Katrina. Natural
Hazards 54: 413-434.
   Raddatz, Claudio (2007). Are external shocks responsible for the insta-
bility of output in low-income countries? Journal of Development Economics
84: 155-187.
   Slager, Kymo (2019). Handboek overstromingsrisico’s op de kaart: Over
de methode van kaartproductie.
   Slager, Kymo, and Dennis Wagenaar (2017). Standaardmethode 2017.
Schade en slachtoffers als gevolg van overstromingen.
   Stuurgroep Water (2018). Overstromingsrisico’s in Nederland.
   University of Cambridge Institute for Sustainability Leadership (2015).
Unhedgeable risk: How climate change sentiment impacts investment. Cam-
bridge, UK: University of Cambridge Institute for Sustainability Leadership.
   Vermeulen, Robert, Edo Schets, Melanie Lohuis, Barbara Kölbl, David-
Jan Jansen, and Willem Heeringa (2021). The heat is on: A framework
for measuring financial stress under disruptive energy transition scenarios.
Ecological Economics 190(107205).
   Zhang, Lei, and Tammy Leonard (2019). Flood Hazards Impact on
Neighborhood House Prices. Journal of Real Estate Finance and Economics
58: 656-674.
29

                                       Stress test modules

               Property damages           Credit risk
                   (Microdata)              (PD/LGD)

   6 flood                                                    Resilience of
  scenarios                                                  banking system
   (Where /                              Market risk            (CET1-ratio)
   severity)                              (NL equities)

                Macrofinancial
                   context
               (Literature / NiGEM)
                                         Profitability
                                           (NII / NFCI)

Fig. 1. Studying floods in a top-down stress test framework.
This figure shows the multi-step framework which this paper uses to assess
the financial stability implications of floods. We start with a set of 6 flood
scenarios that differ in terms of flood types and severity. In the second step,
property damages and broader macrofinancial implications are calibrated.
The property damages are also input for the calibration of the macrofinancial
shocks in NiGEM. In the third step, we use stress test modules to compute
implications for credit risk, market risk, and profitability. The overall im-
plications are computed for a sample of ten Dutch banks using a top-down
stress test model.
30 Fig. 2. Flood risk zones in the Netherlands considered in the stress test. This figure shows the areas of the Netherlands which are vulnerable to two main types of flood. The first type would impact unprotected areas (in red), the second flood type would impact protected areas (in light gray) that are mainly located in the western half of the Netherlands.
31

       0

                 -110        -111
                                        -132
       -200
  basis points

                                                  -307
     -400

                                                             -396
       -600

                                                                       -712
       -800

                 Low     Intermediate Extreme    Low     Intermediate Extreme
                        Not protected                    Protected

Fig. 3. Capital depletion in six flood scenarios over one-year horizon.
The vertical axis shows the depletion of banks’ CET1 capital in basis points.
This depletion is defined as the difference between the system-wide capital
ratio of banks in the respective stress scenario and the CET1 ratio in a base-
line scenario. The stress test horizon is 1 year. The x-axis indicates the level
of severity (which ranges from low to extreme) and differentiates between
two flood types. The first flood type affects unprotected (yet vulnerable)
areas of the Netherlands, the second type affect protected areas. See Table
1 for a taxonomy of flood types. See Table 3 for the shock calibration in
these scenarios.
32
Panel A: Low-impact flood in unprotected areas
250 0
basis points
-250 -500
Profit Credit losses
Market risk losses Dividend
REA increase Other
Panel B: Extreme impact flood in protected areas
250
0
basis points
-250 -500
Profit Credit losses
Market risk losses Dividend
REA increase Other
Fig. 4. Contributions to change in capital position in two flood scenarios.
The figure shows how six drivers contribute to the change in the CET1-ratio
of Dutch banks in two flood stress scenarios. The top panel shows results
for a low-impact flood in unprotected areas; the bottom panel has results
for an extreme impact flood in protected areas. The six components are
bank profits (before credit and market risk losses), credit losses, market risk
losses, dividends, the increase in risk exposure amounts, and other factors
(including taxes).You can also read