RENEWABLES READY: STATES LEADING THE CHARGE - CLIMATECOUNCIL.ORG.AU
←
→
Page content transcription
If your browser does not render page correctly, please read the page content below
RENEWABLES
READY: STATES
LEADING THE
CHARGE

CLIMATECOUNCIL.ORG.AU
Thank you for
supporting the
Climate Council.
The Climate Council is an independent, crowd-funded organisation
providing quality information on climate change to the Australian public.

    Published by the Climate Council of Australia Limited
    ISBN:    978-1-925573-29-9 (print)
             978-1-925573-28-2 (web)
    © Climate Council of Australia Ltd 2017
    This work is copyright the Climate Council of Australia Ltd. All material
    contained in this work is copyright the Climate Council of Australia Ltd
    except where a third party source is indicated.
    Climate Council of Australia Ltd copyright material is licensed under the
    Creative Commons Attribution 3.0 Australia License. To view a copy of this
    license visit http://creativecommons.org.au.
    You are free to copy, communicate and adapt the Climate Council of Australia
    Ltd copyright material so long as you attribute the Climate Council of
    Australia Ltd and the authors in the following manner:
    Renewables Ready: States Leading the Charge by Petra Stock, Dr David
    Alexander, Andrew Stock and Greg Bourne.

    —

    Image credit: Cover Photo “Mount Majura 2.3 megawatt solar farm” by Flickr
    user Steve Bittinger licensed under CC BY 2.0.
    This report is printed on 100% recycled paper.

         facebook.com/climatecouncil                 info@climatecouncil.org.au

         twitter.com/climatecouncil                  climatecouncil.org.au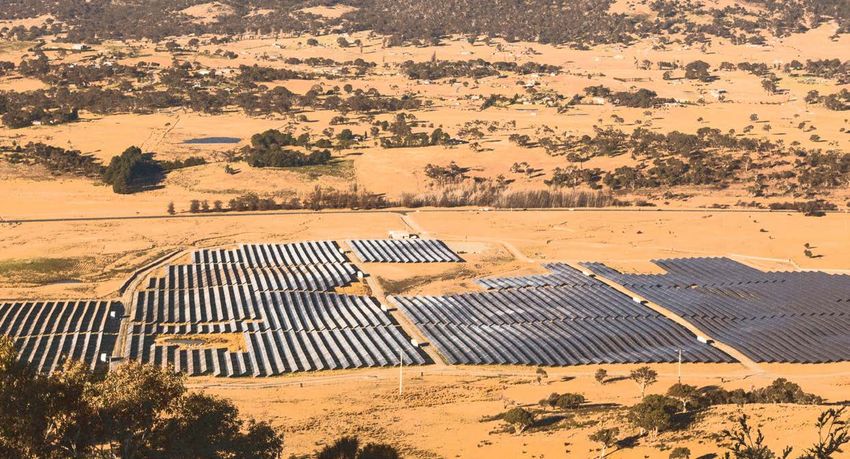
Preface
The renewable energy boom is accelerating in Australia, and across the
world. State and territory governments are leading Australia’s electricity
transition from fossil fuels to renewable energy and storage.

This report follows on from previous state renewable energy updates from the Climate
Council in 2014 and 2016. Since the Climate Council’s previous report in 2016, all state
and territory governments have taken proactive steps to encourage renewable energy
uptake. This report compares states and territories across a range of renewable energy
metrics, revealing leaders and laggards. We also outline progress for each state and
territory government over the last twelve months in terms of renewable energy growth
and policy, as well as their position on fossil fuels.

We would like to thank Tim Buckley and Renate Egan for kindly reviewing the report.
We also appreciate the assistance of Lucy Hough, Christian Lohmüller and Dylan
Pursche in its preparation.

Climate Council CEO Amanda McKenzie served on the Queensland Renewable Energy
Expert Panel, while McKenzie and Climate Councillor Greg Bourne are currently serving
on the Northern Territory Renewable Energy Expert Panel as NT and QLD look at
pathways to achieving 50% renewable energy by 2030.

Petra Stock                     Dr David Alexander
Senior Energy and Climate       Researcher
Solutions Analyst

Andrew Stock                    Greg Bourne
Climate Councillor              Climate Councillor
ii   RENEWABLES READY:
     STATES LEADING THE CHARGE

     Key Findings
     1       2
     States and territories are             In the last year state and
                                                                                   3
                                                                                   New South Wales and
     driving the Australian energy          territory governments have             Queensland are set for
     transition in the absence of           increased commitments to               a significant increase in
     Federal policy.                        renewable power, including             renewable energy.
                                            sources providing 24/7 power.
     ›› Australia’s energy system is                                               ›› The greatest capacity and
        ageing and inefficient and          ›› In the last year Victoria (40% by      number (respectively) of large-
        will need to be replaced in            2025), the Northern Territory          scale wind and solar plants
        coming decades. Power prices           (50% by 2030) and Tasmania             under construction in 2017
        are rising due to a lack of new        (100% by 2022) have put in place       are in New South Wales and
        generation capacity to increase        strong new renewable energy            Queensland.
        electricity supply, ongoing            targets, and New South Wales,
        policy uncertainty and rising          Tasmania, Queensland and            ›› This will create thousands
        gas prices.                            Victoria have all adopted targets      of jobs in construction and
                                               for net zero emissions by 2050.        operation of plants.
     ›› New low-cost electricity
        generation is urgently required     ›› Within the last year, all
        and renewable energy is the            Australian states and territories
        cheapest source of new power           except Tasmania have
        plants.                                increased or kept constant their
                                               proportion of electricity from
     ›› In the absence of national             renewable energy.
        energy and climate policy, all
        states and territories (except      ›› States and territories are now
        Western Australia) now have            focusing on energy storage as
        strong renewable energy targets        a key element underpinning
        and/or net zero emissions              the shift to higher levels of
        targets in place.                      renewable energy.

     ›› State and territory targets, plus
        existing and announced coal
        closures (such as Liddell Power
        Station) are expected to deliver
        the Federal government’s 2030
        emissions reduction target
        of 26-28% reduction on 2005
        levels, even without any action
        from the Federal Government.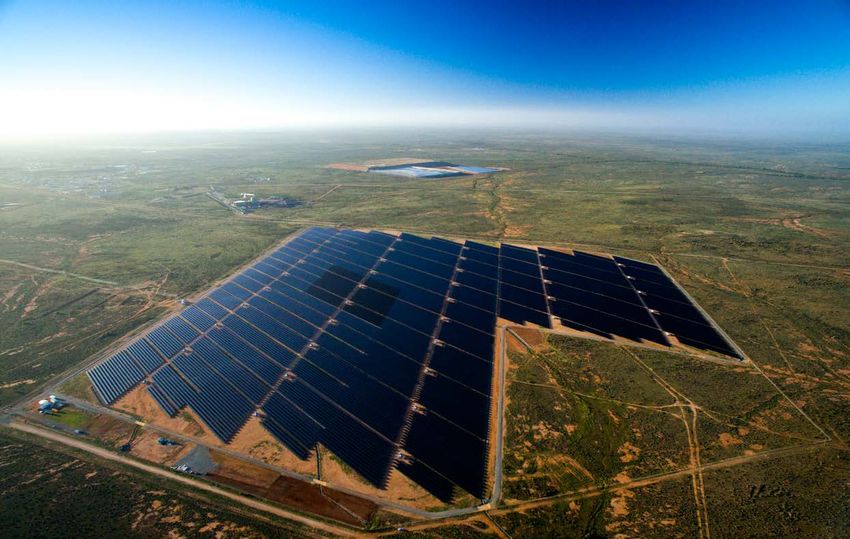
KEY FINDINGS   iii

4
Queensland, South Australian
                                       5
                                       Energy storage is increasingly
and Western Australian                 coming to the fore as part
households continue to lead            of state and territory energy
in the proportion of homes             policy.
with rooftop solar.
                                       ›› The Northern Territory,
›› Australia now has 5.6GW of             Australia Capital Territory,
   rooftop solar across 1.7 million       South Australia, Victoria and
   households, a global record in         Queensland are rolling out or
   per capita terms.                      planning for battery storage to
                                          provide greater grid security.
›› Western Australia has seen the
   largest increase in rooftop solar   ›› South Australia is building
   installations in the past year.        the world’s largest lithium ion
                                          battery storage facility at the
                                          315MW Hornsdale Wind Farm.
                                          The giant battery is expected to
                                          be up and running by the end
                                          of 2017 in preparation for the
                                          2017-18 summer.

                                       ›› The Federal government is
                                          examining a significant boost
                                          with its proposed Snowy
                                          Mountain Pumped Hydro
                                          Storage expansion proposal
                                          (requiring $2 billion of capital
                                          investment plus $2 billion of
                                          grid upgrades), but this is years
                                          away from approval and even
                                          more in terms of completion.

                                                                              climatecouncil.org.au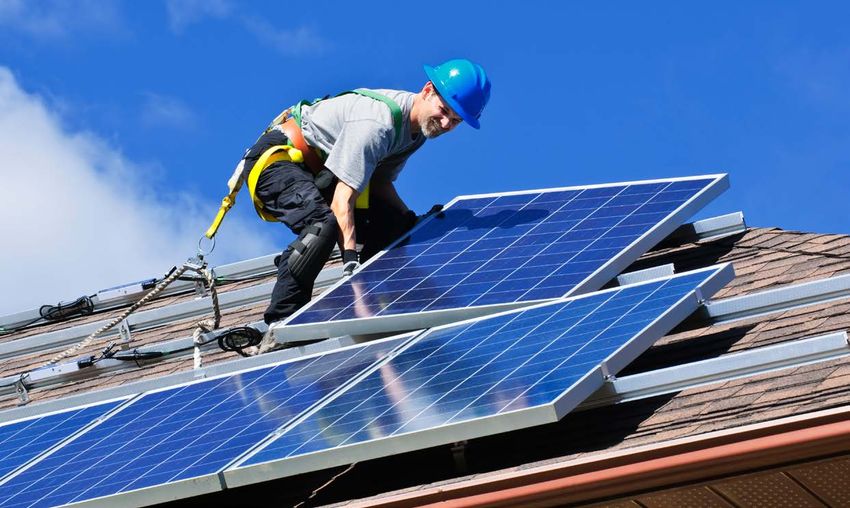
THE AUSTRALIAN
       RENEWABLE ENERGY RACE:
                 2017 SCORE CARD
                                                                                                SA
                                                                 ACT                                      FRONT RUNNERS

                                                                 TAS
                                         Q LD                              CATCHING
                                                                              UP

                                       VIC
         NSW
                                          AT THE
        WA                            STARTING BLOCKS

      NT
 State / Territory     NT              WA            NSW            VIC           QLD           TAS           ACT         SA

 Overall Score

 Renewable             2               7             17             12            7             92            22          47
 Electricity (%)

 Capacity Per Capita   0.1             0.2           0.1            0.2           0.2           0.6           0.4         0.9
 (kw/cap) (excluding
 large hydro)

 Solar                 11%             25%           15%            15%           32%           13%           14%         31%
 Households (%)

 Renewable             50% by 2030     -             -              25% by 2020   50% by 2030   100% by       100% by     50% by 2025
 Electricity Targets                                                40% by 2025                 2022          2020

 Net zero              -               -             Net zero       Net zero      Net zero      Net zero      Net zero    Net zero
 emissions targets                                   emissions      emissions     emissions     emissions     emissions   emissions
                                                     by 2050        by 2050       by 2050       by 2050       by 2050     by 2050

 Progress              Expert panel    Largest       Continued      Renewable     Initial       New           Final       SA Energy
 since 2016            and             increase in   policy         Energy        response to   renewable     reverse     Plan.
                       consultation    rooftop       support.       Target        Renewable     energy        auction.    100MW
                       on approach     solar in      Largest        legislated.   Energy        target and                Battery
                       to Renewable    2016.         capacity of                  Target.       zero net                  announce-
                       Energy                        new projects                 Largest no.   emissions                 ment.
                       Target.                       under                        of new        target.
                                                     construc-                    projects      No new
                                                     tion.                        under         projects
                                                                                  construc-     added in
                                                                                  tion.         2016.

 2016 Scores           -               C             D              C             C             B             -           A

Note: See Appendix A, Table A1 for more detailed scoring methodology.
CLIMATE COUNCIL   v

States and Territories
Renewable Energy
Leaderboards
In the past year, all state and        TARGETS AND POLICIES
territory governments have taken
proactive steps to encourage           All states and territories except Western
renewable energy uptake. We            Australia now have strong renewable energy
have identified the frontrunners       targets or net zero emissions targets in place.
in different categories (Figure 1;     The targets in place are broadly consistent
Figure 2).                             with the level of renewable energy needed
                                       across Australia by 2030 so it can do its fair
                                       share in keeping global temperature rise
                                       below two degrees Celsius (2°C) (Jacobs 2016).

                                       Under the Paris Agreement, world leaders
                                       including those from Australia agreed to
                                       limit global temperature rise to well below
                                       2°C above pre-industrial levels, and to pursue
                                       efforts to limit temperature rise to only 1.5°C.
                                       While 2°C may not sound like much, this
                                       level of temperature rise will have serious
                                       impacts on the lives and livelihoods of
                                       people all over the world. Already at about
                                       1°C temperature increase from pre-industrial
                                       levels, climate change is intensifying
                                       extreme weather events.

                                       Most improved policy environment:
                                       Since the Climate Council’s 2016 report,
                                       New South Wales and the Northern Territory
                                       have seen the most dramatic positive shift
                                       in policy support for renewable energy and
                                       emissions reductions.

                                       At risk of falling behind:
                                       Western Australia is now the only state or
                                       territory in Australia without a target for
                                       renewable energy or net zero emissions.
Figure 1 (opposite): The Australian
renewable energy race showing
which states and territories are
leading the way on renewable energy.
vi     RENEWABLES READY:
       STATES LEADING THE CHARGE

      Figure 2: Renewable energy and net zero emissions targets of states and territories.

                                                 STATES & TERRITORIES
                                                LEADING THE CHARGE
                                                  ON RENEWABLE ENERGY

     AUSTRALIA                                       NT                                            QLD
     23.5% renewable energy by 2020                  50% renewable energy by 2030                  50% renewable energy by 2030
     (33,000GWh of large-scale
     renewable energy)                               No net zero emissions target                  Net zero emissions by 2050

     WA                                                                                            NSW
     No renewable energy target                                                                    No renewable energy target

     No net zero emissions target                                                                  Net zero emissions by 2050

                                                              NT
                                                              2%
                                                                                 QLD
                                                                                 7%
                                    WA
                                    7%
                                                               SA
                                                               47%
                                                                                       NSW
                                                                                       17%

                                                                                                   ACT
                                                                                    VIC            22%
                                                                                    12%

     SA
                                                                                                   ACT
     50% renewable energy by 2025                                                TAS
                                                                                                   100% renewable energy by 2020
     Net zero emissions by 2050
                                                                                 92%
                                                                                                   Net zero emissions by 2050
                                                  VIC
                                                  25% renewable energy by 2020
      LEGEND                                      40% renewable energy by 2025               TAS
          Shaded regions show the                 Net zero emissions by 2050                 100% renewable energy by 2022
          percentage of renewable
          energy currently                                                                   Net zero emissions by 2050

      Sources: ACT Government 2015; ACT Government 2017a; Government of South Australia 2015a; Government of South
      Australia 2015b; Office of Environment and Heritage 2016; Tasmanian Government 2017a; Tasmanian Government 2017b;
      Victoria State Government 2017a.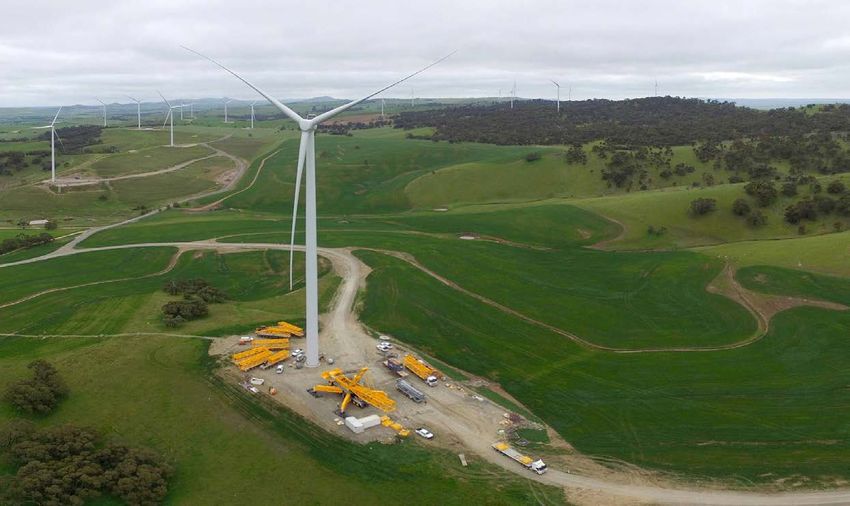
CLIMATE COUNCIL   vii

PERCENTAGE RENEWABLE                            LARGE-SCALE RENEWABLE ENERGY
ELECTRICITY                                     CAPACITY (EXCLUDING LARGE
                                                HYDRO) PER CAPITA
 1. Tasmania                  92% (decrease)
                                                 1. South Australia              0.9 kW/person
 2. South Australia           47% (increase)
                                                 2. Tasmania                     0.6 kW/person
 3. Australian Capital        22% (increase)
    Territory                                    3. Australian Capital           0.4 kW/person
                                                    Territory
Note: Data are for 2016.
                                                Note: Data are for 2016.

Greatest increase:
South Australia (increased wind generation      New large-scale projects underway:
and a reduction in coal power) and New          New South Wales (1,018MW; 8 projects) and
South Wales (doubling in hydro generation       Queensland (784MW; 10 projects) have the
due to low water levels in the previous year)   greatest capacity and number of projects
saw the largest increase in their shares of     under construction.
renewable electricity.
                                                Nothing added:
Decrease:                                       Tasmania is the only state which did not add
Tasmania was the only state where its share     any new renewable energy capacity in 2016.
of renewable electricity decreased.

                                                PROPORTION OF HOUSEHOLDS
                                                WITH SOLAR PANELS

                                                 1. Queensland                   31.6%

                                                 2. South Australia              30.5%

                                                 3. Western Australia            25.4%

                                                Note: Based on most recent data from April 2017.

                                                Largest growth in rooftop solar:
                                                Western Australia (2.9% increase).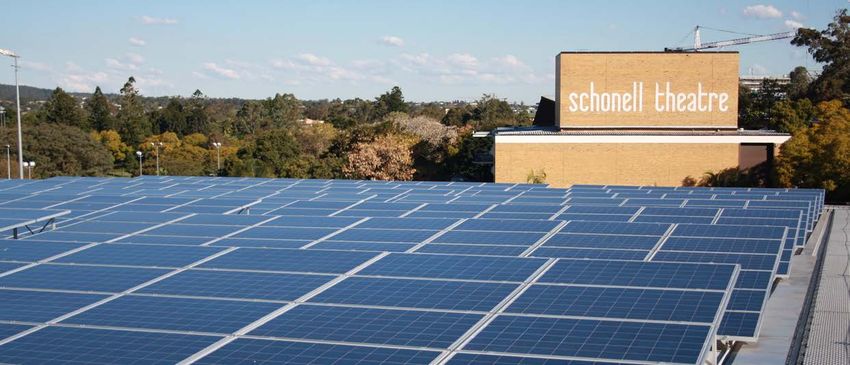
i    RENEWABLES READY:
     STATES LEADING THE CHARGE

    Contents
    Preface................................................................................................................................................................................................. i

    Key Findings..................................................................................................................................................................................... ii

    1.     Introduction...............................................................................................................................................................................1

    2.     Globally, the Renewable Energy Transition Continues............................................................................................... 3

    3.     Renewable Energy Performance ....................................................................................................................................... 5

           3.1 Proportion of Electricity Produced from Renewable Energy                                                                                                                                    6
           3.2 Large-scale Renewable Energy Per Person                                                                                                                                                     8
           3.3 Rooftop Solar                                                                                                                                                                              11
           3.4 Leading Solar Suburbs                                                                                                                                                                      13

    4.     Renewable Energy Targets and Policies .........................................................................................................................15

           4.1 South Australia                                                                                                                                                                            18
           4.2 Australian Capital Territory                                                                                                                                                               21
           4.3 Tasmania                                                                                                                                                                                  25
           4.4 Queensland                                                                                                                                                                                27
           4.5 Victoria                                                                                                                                                                                  30
           4.6 New South Wales                                                                                                                                                                           33
           4.7 Western Australia                                                                                                                                                                         35
           4.8 Northern Territory                                                                                                                                                                        36
           4.9 Federal: Relying on States and Territories to Meet Emissions Reductions Targets                                                                                                           38

    Appendix A – Summary of State and Territory Renewable Energy Measures.............................................................41

    Appendix B – Top Solar Postcodes in Australia................................................................................................................... 43

    References.......................................................................................................................................................................................44

    Image Credits................................................................................................................................................................................. 49
INTRODUCTION 1
1. Introduction
Around the world, governments Australia’s energy system is ageing and
at state, regional and local levels inefficient and will need to be replaced in
are playing an increasingly crucial coming decades. Power prices are rising
role in the transition from fossil due to a lack of new generation capacity to
fuelled to renewable power. In increase electricity supply, ongoing policy
many cases, state, regional and uncertainty and rising gas prices. Renewable
local governments are adopting energy is the cheapest way to power the
stronger renewable energy targets future electricity system (see Table 1, page 4).
and policies than their national
counterparts, and advocating for Accelerating the shift from fossil fuelled to
climate action. For example, in renewable power generation is imperative for
the United States (US), 160 mayors reducing pollution and protecting Australia
and several states have already from the effects of climate change such as
responded to the US President’s worsening extreme weather events (e.g.
proposal to withdraw from the Paris bushfires, heatwaves and storms) (Figure
Agreement on climate change by 3). Current state and territory renewable
pledging themselves to meeting the energy targets are broadly consistent with the
country’s emissions targets without minimum level of renewable energy required
the Federal Government (Los for Australia to tackle climate change
Angeles Times 2017). In Australia, meaningfully (Jacobs 2016). Two degrees is a
states and territories are leading the threshold that is considered too dangerous to
energy transition by setting stronger cross. Limiting global temperature rise well
renewable energy and emissions below 2°C was agreed universally in Paris in
reduction policies and targets while 2015 by 195 nations including Australia, with
the Federal Government is yet to a commitment to “ratchet-up” our collective
decide on renewable energy policy targets over time.
beyond 2020.
This report updates state and territory
renewable energy progress since previous
state renewable energy reports from the
Climate Council in 2014 and 2016. In the last
three years enormous progress has been
achieved by Australian states and territories
with most increasing their commitments.
In the absence of Federal government
State and territory mechanisms driving more investment
in renewable energy beyond 2020, the
renewable targets are approaches taken by States and Territories
are the primary mechanisms for increasing
broadly consistent renewable energy generation.
with action needed
on climate change.2 RENEWABLES READY:
STATES LEADING THE CHARGE
Since our 2016 report: ›› The Australian Capital Territory, Northern
Territory, South Australia, Victoria and
›› The Australian Capital Territory completed Queensland are all rolling out or planning
their final renewable energy reverse for battery storage.
auction and is on track to meet its target of
100% renewable electricity by 2020. ›› The Council of Australian Governments
established an Independent Review
›› South Australia released a new Energy into the Future Security of the National
Plan detailing the next steps in its energy Electricity Market (known as the Finkel
transition, and will build the world’s Review), which was released in June 2017.
largest lithium ion battery storage facility
(100MW/129MWh) by December 2017. ›› The Australian Renewable Energy
Agency (ARENA) and the Clean Energy
›› Queensland’s expert panel released its final Finance Corporation (CEFC) launched
50% Renewable Energy Target report. The and concluded a stimulus program
government has made an initial response resulting in 12 large scale solar PV projects
to the expert panel report, but is yet to being committed and built, catalysing
detail its final plan for reaching the target. steep reductions in large scale solar PV
project costs, and increasing industry
›› Victoria, the Northern Territory and competitiveness. The program will
Tasmania have set new renewable energy more than triple Australia’s large-scale
targets. Victoria has determined its solar capacity, and attract $1 billion in
approach to achieving its target, but is yet commercial investment (ARENA 2016) for
to introduce legislation. a surprisingly low $91 million of subsidies.
Subsequently, many new renewable
›› Four states: New South Wales, Tasmania, projects have been announced without
Queensland and Victoria introduced any capital subsidies, showing the merit of
targets for net zero emissions by 2050. ARENA’s program.
›› The new Western Australian government
committed to investing in research into
renewable energy and storage technology.
Figure 3: Bushfire smoke over Sydney in 2013.CHAPTER 02 3
GLOBALLY, THE RENEWABLE ENERGY TRANSITION CONTINUES
2. Globally, the
Renewable Energy
Transition Continues
Renewable energy uptake continues These record-high global capacity additions
at a rapid pace around the world. were largely driven by rapidly falling
Globally, carbon dioxide (CO2) renewable energy costs (UNEP 2017). Wind
emissions flat-lined for the third and solar prices continue to plummet (with
year in a row in 2016 (Le Quéré et the levelised cost of energy for wind and
al. 2016). Last year, a record 139GW solar falling 18% and 17% respectively in 2016)
of new renewable power capacity as a result of low-cost financing and greater
(wind, solar, biomass, waste-to- efficiency (The Guardian 2017a; UNEP 2017).
energy, geothermal, small hydro With the addition of 15GW of large hydro
and marine sources) was added capacity (projects greater than 50MW),
worldwide – an 8% increase on the renewable energy made up 64% of all new
previous year. This is about twice power capacity added globally in 2016
the entire electricity generating (UNEP 2017).
capacity of Australia (63GW)
(Australian Government 2016). 2016 was also a record year for the solar
photovoltaic (PV) industry, with 75GW of
new capacity added, eclipsing the previous
2015 record of 50GW (BNEF 2017a; Climate
Council 2017c; UNEP 2017). Energy storage
technologies are receiving increasing
attention and investment. Most of the
renewable energy growth has occurred in
developing countries, with China leading
the way (IEA 2016). For example, during the
2016 to 2020 period, China will invest close to
Renewable energy $500 billion into renewable power generation
(Deutsche Welle 2017). Consistent with
made up 64% of this, China announced it installed a record
24.4GW of new solar in the first six months
all new power of 2017. China is also on track to introduce
its national emissions trading scheme (ETS)
capacity globally. across three sectors by December 2017.4 RENEWABLES READY:
STATES LEADING THE CHARGE
To have a reasonable chance of holding Australia has a competitive advantage in
global temperature rise to less than 2°C renewable energy, with some of the best wind
above pre-industrial levels, Australia needs and solar resources in the world (Geoscience
to play its part by transitioning its power Australia 2014), a low population density
generation systems to zero pollution and enormous financial capital resources
renewables by 2050 at the latest. Greenhouse available to fund new infrastructure
gas emissions of some of our closest trading investments. Further, renewable energy
partners including the United States and the technologies such as solar PV, wind and
European Union are trending downwards (Le solar thermal are now the lowest cost form of
Quéré et al. 2016), while Australia’s emissions new electricity generation (Table 1). Australia
are trending upwards (Commonwealth of has the potential to generate a much higher
Australia 2017). Latest Australian Government proportion of our electricity from renewables
data shows that in the year to March without compromising security. Our
2017, Australia’s emissions rose by 1.2% renewable energy resources could potentially
(Commonwealth of Australia 2017). provide 500 times the amount of electricity
we currently use (Commonwealth of
Analysis from Frontier Economics (2017) Australia 2014). However, compared to similar
reveals that Australia could meet its 2030 countries, Australia has one of the lowest
emission reduction targets of 26-28% below levels of renewable electricity generation
2005 levels through the implementation (Australian Energy Council 2016).
of state and territory policies and targets
supporting renewable energy together with
announced, planned closures of polluting
coal power stations such as Liddell Power
Station, NSW in 2022 (AEMO 2016).
Table 1: Cost of new build power plants.
Power technology Levelised Cost of Energy (LCOE)$ (AUD)/MWh
SA Solar Thermal Plant $781
Wind $61 - 1182
Solar $78 - 140
Gas Combined cycle $74 - 903
Coal $134 - 203
Coal with Carbon Capture and Storage (CCS) $352
Sources: BNEF 2017b. 1. Government of South Australia 2017. 2. Recent prices for wind are even lower - Stockyard Hill Wind
Farm “well below” $60/MWh. 3. Based on gas prices of $8/GJ. Current gas prices are much higher than this.CHAPTER 03 5
RENEWABLE ENERGY PERFORMANCE
3. Renewable Energy
Performance
To compare the performance of state and
territory governments on renewable energy
(see Figure 1 and Appendix 1 for Score card),
we used the following measures:
1. Policy support for renewable energy and
emissions reduction targets.
2. Percentage of renewable energy in
electricity supply.
3. Large-scale renewable energy capacity
(excluding large-scale hydro) installed
per capita (Figure 4).
4. Proportion of households with solar
panels.
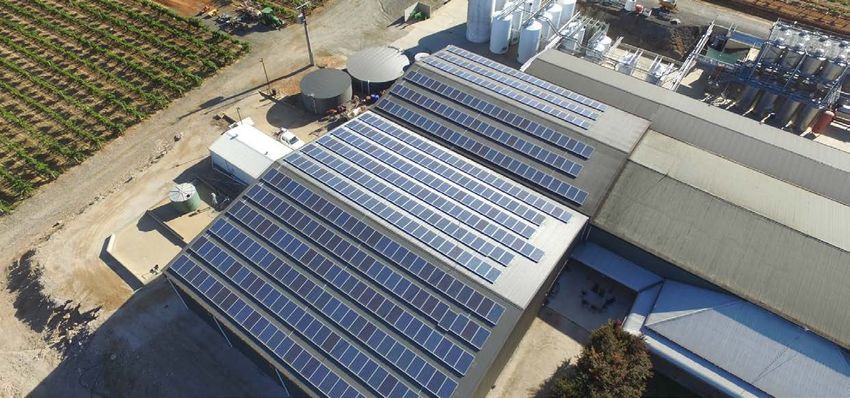
Figure 4: Kilikanoon Winery in South Australia, with more than 400 solar panels.6 RENEWABLES READY:
STATES LEADING THE CHARGE
3.1 Proportion of Electricity
Produced from
Renewable Energy
Renewable energy provided 16% of Australia’s the last 12 years. Recent reports indicate
electricity in 2016 based on government data South Australia has already achieved its
(Department of Environment and Energy renewable energy target of 50% renewable
2017; Table 2). Australia’s renewable energy electricity production in 2017 – eight years
generation – 42,022 GWh in 2016 – was early (ABC 2017b). South Australia’s increased
enough electricity to power the equivalent share in 2016 has been driven largely by an
of nearly 7 million homes (calculated based increase in wind and the cessation of coal
on the usage of an average NSW household fired power generation in South Australia
in ACIL Allen 2015). Further, Australia’s (Department of Environment and Energy
proportion of renewable energy increased 2017). New South Wales’ renewable electricity
by more than 1% on the previous year, is mostly hydro (58%) followed by wind (17%)
and actual renewable energy output rose and solar (17%). New South Wales’ increased
8.6% to 5,596GWh in 2016 (Department of share in 2016 was largely due to a doubling of
Environment and Energy 2017). The majority generation from existing hydro power plants
of new projects brought online were as a and a doubling of generation from large-
result of the ACT’s renewable energy target. scale solar plants.
At a state level, the proportion of renewable The proportion of renewable electricity
electricity generated in Tasmania and South in Western Australia and the Northern
Australia continues to be well ahead of other Territory remained unchanged. Fossil fuels
states and territories. Tasmania was the only continue to dominate the electricity supply
state where the proportion of renewable in Queensland, Western Australia and the
electricity fell. Tasmania relies mainly on its Northern Territory.
historic development of hydropower. The
state is increasingly reliant on gas generation Data for the Australian Capital Territory is
after Tasmania’s Tamar Valley gas power based on renewable electricity consumed.
station was turned on after the Basslink cable This is because the territory purchases
failed in late 2015. renewable energy from projects located
in other states to meet its target. Further,
South Australia and New South Wales Department of Environment and Energy
saw the largest increase in their shares (2017) data does not separate out the
of renewable electricity. South Australia’s Australian Capital Territory’s electricity
renewable electricity is made up almost production from New South Wales’ figures.
entirely of wind and solar PV developed inCHAPTER 03 7
RENEWABLE ENERGY PERFORMANCE
Table 2: Proportion of renewable electricity for Australian states and territories.
2015 2016 Change
States and territories
Tasmania 99 92 ▼
South Australia 40 47 ▲
Australian Capital Territory* 19 22 ▲
Western Australia 7 7 -
Victoria 11 12 ▲
New South Wales 12 17 ▲
Queensland 6 7 ▲
Northern Territory 2 2 -
National
Australia 14 16 ▲
Source: ACT Government 2016a and data provided by the ACT government. Department of Environment and Energy 2017.
* States and Northern Territory renewable electricity data is the proportion of electricity production whereas Australian
Capital Territory data is calculated based on electricity consumption.
Note: The NSW Government has published figures for 2015 claiming a higher percentage (14%) of renewable energy for 2015
than Australian Government figures shown in Table 2. The difference relates to the NSW Government including solar hot
water (NSW Government 2017b). For consistency, renewable energy data presented herein is for the year 2016.
The majority of states and
territories have increased their
proportion of renewable electricity.8 RENEWABLES READY:
STATES LEADING THE CHARGE
3.2 Large-scale Renewable
Energy Per Person
Among the states and territories, South support 4,100 jobs across the nation with
Australia, Victoria, Queensland and New New South Wales, Queensland and South
South Wales have the greatest total capacity Australia adding the most.
of large-scale renewable energy (excluding
large hydro) with over 1,100MW capacity in It should be noted, that while the ACT
2016 (Table 3). However, on a per capita basis, has a low share of large-scale renewable
South Australia leads, followed by Tasmania energy capacity within its borders, the ACT
and the Australian Capital Territory (ABS Government has supported large-scale wind
2017; Clean Energy Regulator 2016b; Table 3). projects in South Australia, New South Wales
and Victoria through its renewable energy
Across Australia, 265MW of new large-scale reverse auctions and 100% renewable energy
renewable energy capacity was added in target. A reverse auction is a process where
2016. The greatest share of new capacity was the best value, lowest priced renewable
added in South Australia (120MW), more than energy bids are successful. 143MW of
double the next highest state, New South new renewable energy added in 2016 was
Wales (56MW). The Clean Energy Council supported by the ACT’s renewable energy
(2017a) reports that large renewable energy target. Completed projects under the ACT’s
projects under construction or starting in reverse auction scheme are included as
2017 will add 3,300MW capacity and will part of the ACT’s capacity per person below
(Table 3).
South Australia, New South
Wales and Queensland
added the most renewable
energy capacity in 2016.CHAPTER 03 9
RENEWABLE ENERGY PERFORMANCE
Table 3: Large-scale renewable electricity capacity per person (excluding large hydro) for Australian states and territories.
2015 2016 (MW Total capacity Population
(MW)1 added)2 2016 (MW) (‘000 people)3 MW/person
States and territories
Tasmania 320 0 320 520 0.6
South Australia 1,505 120 1,625 1,711 0.9
Western Australia 600 10 610 2,623 0.2
Victoria 1,378 20 1,398 6,101 0.2
New South Wales 1,070 56 1,126 7,758 0.1
Queensland 1,136 30 1,166 4,860 0.2
Northern Territory 12 6 18 246 0.1
Australian Capital Territory 23 (in ACT) 1604 398 0.4
Australia 6,021 265 6,286 24,217 0.3
Sources: 1. Clean Energy Regulator 2016b. 2. Clean Energy Council 2017a. 3. ABS 2017. Total capacity of completed projects
under the ACT’s reverse auction scheme - Royalla Solar Farm, Mugga Lane Solar Farm, Williamsdale Solar Farm, Coonooer
Bridge Wind Farm, Hornsdale Wind Farm (Stage 1). Note that the capacity of these projects is also included under the state in
which they are built.
Ten large-scale renewable energy projects ›› Normanton Solar Farm, Queensland 5MW.
were completed in 2016 totaling 265MW of
capacity (Clean Energy Council 2017a) – ›› Mugga Lane Solar Farm, ACT 13MW.
enough electricity to power 90,000 homes
(based on information from project websites). ›› Williamsdale Solar Farm, ACT 10MW.
New projects include: ›› DeGrussa Mine Solar, Western Australia
10MW.
›› Hornsdale Stage 1 Wind Farm, SA 100MW
(Figure 5). ›› Coonooer Bridge Wind Farm, Vic 19.8MW.
›› Waterloo Stage 2 Wind Farm, SA 19.8MW. ›› Darwin Airport, NT 5.5MW.
›› Moree Solar Farm, NSW 56MW. Table 4 shows that New South Wales and
Queensland could be set for a significant
›› Barcaldine Solar Farm, Queensland 25MW. increase with the greatest capacity and
number of projects under construction.10 RENEWABLES READY:
STATES LEADING THE CHARGE
Table 4: Large-scale renewable energy projects under construction in 2017.
Total capacity (MW) Number of projects Number of jobs created
States
South Australia 644 4 620
Victoria 687 7 535
New South Wales 1,018 8 1,245
Queensland 784 10 1,896
Western Australia 20 1 100
Australia 3,151 30 4,396
Source: Clean Energy Council 2017b.
Note some projects have been announced as commencing construction in 2017 since the above data was compiled. For
example, two wind projects - Cattle Hill and Granville Harbour - in Tasmania are likely to begin construction in 2017 (The
Mercury 2017).
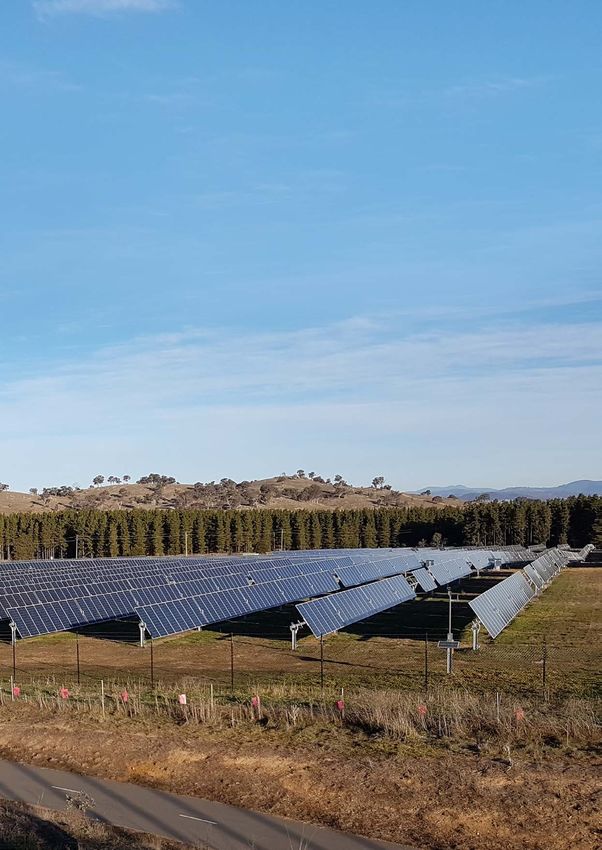
Figure 5: Hornsdale Wind Farm under construction near Jamestown, South Australia. This is one of the largest wind farms
(100MW capacity for Stage 1) added in Australia in 2016.CHAPTER 03 11
RENEWABLE ENERGY PERFORMANCE
3.3 Rooftop Solar
Australia is a world leader in household solar ›› Initial state-based feed-in tariffs plus high
PV, with double the rate of uptake – 21% of and rising residential electricity costs.
households on average (Renew Economy
2017b) – compared to any other country ›› Large-roof space on a large proportion of
in the world (excluding small nations like houses.
Kiribati; see Bruce and MacGill 2016) (ESAA
2015). ›› A sunny climate.
More than 1.7 million Australian households ›› Cost effective.
have installed solar PV panels (as of March
2017) (Clean Energy Regulator 2017; Figure 6). ›› Relatively high rates of home-ownership.
Bruce and MacGill (2016) identify a number
of reasons that household rooftop solar is The total capacity of Australian rooftop solar
popular in Australia: was 5.6GW as of April 2017 (Renew Economy
2017a). At the state and territory level,
Queensland, South Australia and Western
Australia have the highest proportion of
households with solar PV installations (APVI
2017; Table 5).
Table 5: Proportion of households with solar PV.
Proportion of Proportion of
households with solar households with solar
PV systems installed PV systems installed Total capacity (MW)
State/Territory (May 2016) (April 2017) (April 2017) Change
Queensland 29.6% 31.6% 1,727 ▲
South Australia 28.8% 30.5% 738 ▲
Western Australia 22.5% 25.4% 726 ▲
Victoria 14.2% 15.4% 1,048 ▲
New South Wales 14.1% 15.3% 1,413 ▲
Australian Capital Territory 13.1% 13.9% 107 ▲
Tasmania 12.1% 13.2% 104 ▲
Northern Territory 8.7% 11.4% 58 ▲
Source: APVI 2017.12 RENEWABLES READY:
STATES LEADING THE CHARGE
Queensland, South Australia and
Western Australia have the highest
proportion of households with solar.
Historically, state and territory governments households’ ability to feed solar PV into the
have actively driven the uptake of rooftop grid and whether extra fees or charges are
solar through premium feed-in tariffs, imposed by networks on solar households,
however most of these programs have or should restrictions to the installation of
been wound back as solar has become battery storage be brought in. For example,
cost competitive with grid sourced retail Standards Australia has released prohibitive
electricity prices. State governments can also draft guidelines for battery storage which if
play a role encouraging or discouraging solar adopted or required by state governments
PV through planning policies (for example would impact negatively on battery storage
heritage legislation can restrict solar PV in uptake (Renew Economy 2017f).
certain locations), regulations impacting on
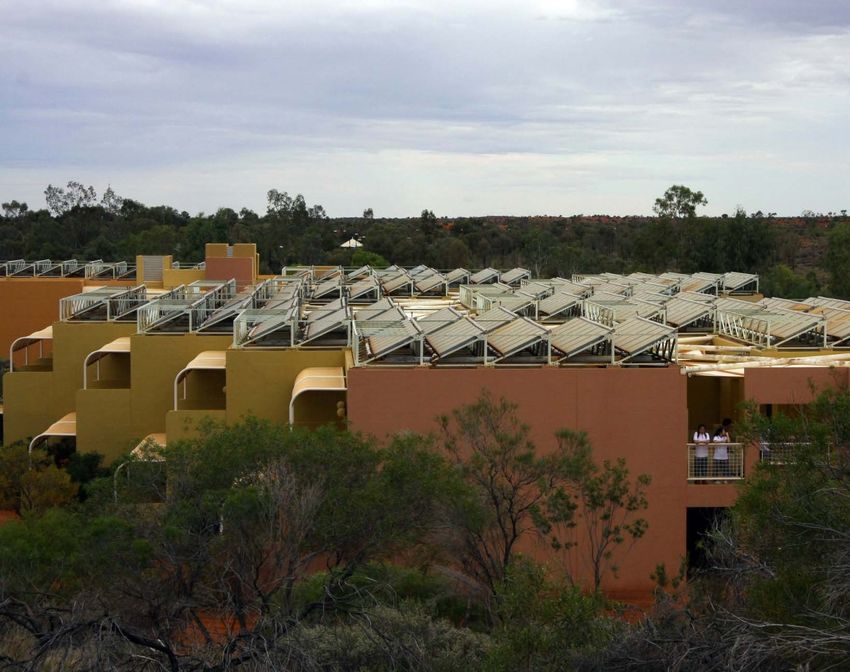
Figure 6: Worker installing solar PV on the rooftop of a house.CHAPTER 03 13
RENEWABLE ENERGY PERFORMANCE
3.4 Leading Solar Suburbs
There are 22 postcodes in Australia where electric vehicles on each house – features
half or more of households have rooftop solar which are anticipated to save residents over
PV with the majority in Queensland and $2,000 a year on their electricity bills (Renew
Western Australia (Figure 7; see Appendix B; Economy 2015).
APVI 2017). The suburbs of Baldivis (Western
Australia; 69% uptake), Elimbah (Queensland; Other recent developments include the
63% uptake) and Tamborine (Queensland; 57% largest residential “virtual power plant” in
uptake) are leading the way with installations the world, which went live in March 2017
on houses. The best performing postcodes in Adelaide (AGL 2017). The virtual power
in each state are provided in Table 6. Suburbs plant is made up of numerous individual
with high levels of rooftop solar PV have solar battery systems installed in homes.
generally low to medium income levels and The batteries store excess solar energy to use
tend to be located in the outer metropolitan when required and the virtual power plant
“mortgage belt”, or in regional areas. will sometimes help support the electricity
grid by providing stored electricity to power
Some new suburbs are now being built with the home or to feed back into the grid. 1,000
100% solar. For example, Denman Prospect in batteries are expected to be installed across
Canberra, will be the first suburb in Australia Adelaide by the end of next year (AGL 2017).
to require a minimum of 3kW of solar PV on Meanwhile, in Western Australia, Horizon
every house (Canberra Times 2015). Breezes Power has run a successful trial of solar and
Muirhead in Darwin being developed by battery storage in remote locations, providing
Defence Housing Australia plans to include reliable power, with more systems to be rolled
a 4.5kW solar system and charging points for out by the end of the year (ABC 2017a).
Table 6: Best performing postcodes for each state and territory for residential uptake of solar PV. Values are based on suburbs
with more than 1,000 dwellings.
State Postcode Suburbs Installs Capacity
Western Australia 6171 Baldivis 3951 69%
Queensland 4516 Elimbah 763 63%
South Australia 5171 Blewitt Springs, McLaren Flat, McLaren Vale, Pedler 1201 50%
Creek, Tatachilla
New South Wales 2390 Baan Baa, Bohena Creek, Bullawa Creek, Couradda, 1601 50%
Edgeroi, Eulah Creek, Harparary, Jacks Creek,
Kaputar, Narrabi, Narrabi West, Tarriaro, Turrawan
Victoria 3331 Bannockburn, Gheringhap, Maude, Russells Bridge, 546 37%
She Oaks, Steiglitz, Sutherlands Creek
Tasmania 7017 Grasstree Hill, Honeywood, Old Beach, Otago, 471 27%
Risdon, Tea Tree
Northern Territory 832 Rosebery 580 20%
Australian Capital Territory 2914 Amaroo, Bonner, Forde, Harrison 945 20%
Source: APVI 2017.14 RENEWABLES READY:
STATES LEADING THE CHARGE
Figure 7: Postcodes in Australia that have 50% or more rooftop solar PV, based on residential uptake for suburbs with more
than 1,000 dwellings (APVI 2017). The majority of the suburbs are located in southeast Queensland and southwest Western
Australia.
POSTCODES WITH
50% OR HIGHER
ROOFTOP SOLAR
4516
4553
4511
4514
4505
4306
4504
4512
4125
6035 4520
4270
6122 4124
6170 4280
6171
2390
6180
5171
5157CHAPTER 04 15
RENEWABLE ENERGY TARGETS AND POLICIES
4. Renewable Energy
Targets and Policies
In the past year, all states and ›› South Australia released a new Energy
territories have taken steps to Plan detailing measures for the next stage
expand and strengthen their of the state’s energy transition.
renewable energy and emissions
reduction targets and policies: ›› The Queensland Government has made
its initial response to its expert panel’s
›› Victoria, the Northern Territory and final report detailing pathways and
Tasmania have set new renewable energy recommendations for the state to reach its
targets. The Northern Territory set a target 50% renewable energy target by 2030.
for 50% renewable energy by 2030. Victoria
has increased its renewable energy target ›› New South Wales, Tasmania, Queensland
from “at least 20% by 2020”, to 25% by and Victoria adopted new targets to reach
2020 and 40% by 2025. The Tasmanian net zero emissions by 2050.
Government has announced plans to
increase renewable energy generated ›› The newly elected Western Australian
in Tasmania so that the state would be government has committed to funding for
100% supplied by renewable energy by renewable energy and storage research.
2022 (Tasmanian Government 2017a).
The Tasmanian Government has yet to All states and territories, except Western
formalise this new commitment in policy. Australia, now have strong renewable energy
targets or net zero emissions targets in place.
›› The Australian Capital Territory The targets in place are broadly consistent
announced the results of its final with the minimum level of renewable energy
renewable energy reverse auction, setting needed for Australia to play its part in tackling
the territory on track to achieve its 100% climate change and transition to net zero
renewable energy target by 2020 (once all emissions by 2050 at the latest (Jacobs 2016).
projects are completed and operating; e.g.
Figure 8).
States and territories are continuing
to expand their renewable energy
goals and policies.16 RENEWABLES READY:
STATES LEADING THE CHARGE
New South Wales and the Northern Territory Western Australia is now the only state or
have seen the most dramatic positive shifts territory in Australia without a target for
in policy support for renewable energy since renewable energy or net zero emissions. The
2016: newly-elected government has committed to
investing in research into renewable energy
›› In 2016, the Northern Territory had no and battery technology (WA Labor 2016).
specific targets or policies to encourage
renewable energy. The Northern Territory States and territories are at different stages
now has a target to achieve 50% renewable in setting renewable energy targets and
electricity by 2030, and has appointed implementing actions to achieve them. For
an expert panel to develop a roadmap for example, the Australian Capital Territory’s
achieving the target. renewable energy target has been in place
since 2010 and is underpinned by measurable
›› The New South Wales government policies and quantifiable actions designed
finalised planning guidelines for wind to meet its target, such as the renewable
farms after more than five years of interim energy reverse auction process. Similarly
guidelines (the lack of final guidelines in South Australia, more than a decade of
was creating uncertainty for wind energy consistent policy support, ratcheting up of
developers). The state government also renewable energy targets, and improving
adopted a new target to reach zero net complementary planning legislation has
emissions by 2050. established the state as an attractive location
Figure 8: Royalla Solar Farm near Canberra.CHAPTER 04 17
RENEWABLE ENERGY TARGETS AND POLICIES
for wind (e.g. Figure 9) and solar, as well as Renewable Energy Agency and the Clean
battery storage. In contrast, Queensland, Energy Finance Corporation). The Federal
Victoria and the Northern Territory have Government is currently deliberating on the
recently set new renewable energy targets findings of the Finkel Review into the future
and are in the early stages of detailing plans of Australia’s national electricity market and
to achieve these targets. States and territories has initiated a 2017 review of climate policy.
with supportive renewable energy policies Federal funding programs, established in
are benefiting from investment resulting 2011, have been crucial in supporting the
from federal programs such as the Renewable growth of renewable energy projects. In 2016,
Energy Target, the Clean Energy Finance ARENA and CEFC launched and concluded
Corporation (CEFC) and the Australian a stimulus program resulting in 12 large-
Renewable Energy Agency (ARENA). scale solar PV projects being committed and
built, catalysing steep reductions in large-
The Federal Government has no plans to scale solar PV project costs, and increasing
encourage investment in new renewable industry competitiveness. The program is
energy in Australia beyond the existing expected to triple Australia’s large-scale solar
policy framework set in place prior to capacity, and attract $1 billion in commercial
the current government’s election (the investment (ARENA 2016).
33,000GWh Renewable Energy Target
expected to result in 23.5% renewable
electricity in 2020, the Australian
Figure 9: Brown Hill Wind Farm, South Australia.18 RENEWABLES READY:
STATES LEADING THE CHARGE
4.1 South Australia
BOX 1: SOUTH AUSTRALIA – RENEWABLE ENERGY FACTS AND STATISTICS
Large-scale renewable power Households
›› The highest capacity of renewable energy ›› 30.5% of households with rooftop solar PV –
(excluding large hydro) - 1,625 MW. second highest proportion after Queensland.
›› The highest capacity of new renewable energy Policy
per person (excluding large hydro).
›› Has a 50% by 2025 renewable energy target,
›› The second highest share of renewable a “zero net emissions” target for 2050 and
electricity generation (47%) after Tasmania. introduced a new Energy Plan in 2017.
›› South Australia had one of the largest increases Power on-demand
in its share of renewable energy, driven largely
by an increase in wind power and a decrease in ›› Announced plans to build the world’s biggest
coal generation. lithium-ion battery storage facility by 1
December 2017.
›› Added the most new renewable energy
capacity (120MW) in 2016. ›› A new 150MW solar thermal power plant
will supply 100% of the state government’s
electricity needs.
Sources: Government of South Australia 2015b; ABC 2017b; APVI 2017; Department of Environment and Energy 2017.
After more than a decade of consistent policy ensuring competitive prices, reliable and
support for renewable energy, South Australia secure supplies of electricity, and setting
has shifted from 99% fossil fuelled electricity in place a state target to achieve “zero net
in 2003-04 to 47% renewable electricity emissions” by 2050 (Government of South
generation (predominantly wind and solar Australia 2015a).
power) in 2016 (Government of South
Australia 2015a; Department of Environment A number of significant events have
and Energy 2017; Figure 10). impacted on South Australia’s electricity
system since the start of 2016, including the
In 2014, South Australia increased its closure of the Northern (coal-fired) Power
renewable energy target to 50% of electricity Station; gas-fuelled electricity price spikes
produced in the state to come from in July 2016; a whole-state black out in
renewable sources by 2025 (Government September (caused by an extreme storm);
of South Australia 2015a). In 2015, the state followed by power outages in December
announced further plans designed to 2016 (due to a transmission fault); and power
transition the state more quickly to a greater outages in February 2017 (during a heatwave).
reliance on renewable energy sources whilst These events have focused significantCHAPTER 04 19
RENEWABLE ENERGY TARGETS AND POLICIES
attention on South Australia, and influenced On 14 March 2017, the state government
the establishment of the Independent Review responded by publicly announcing a $550
into the future of the National Electricity million Energy Plan as the next step in the
Market (Finkel Review). state’s transition to secure its energy future
(Government of South Australia 2017). This
The following Climate Council reports plan includes:
provide more information on recent events
in South Australia: ›› Battery storage and renewable technology
fund.
›› New generation to increase competition,
and drive down costs.
Fact Sheet: South
Australian Storms ›› State-owned gas power plant to have
& Power Outages stand-by power for emergencies.
›› Incentives to source more gas for use in
South Australia instead of coal.
›› Local powers over the national market.
The Perfect Storm:
Analysing the Role of ›› Introducing an energy security target to
Gas in South Australia’s have more locally generated, cleaner and
Power Prices secure energy.
The proposed energy security target has,
however, been criticised for its reliance on
fossil fuels (particularly gas), increasing
Mythbusting: Electricity consumers’ electricity costs by 12-15% per
Prices in South Australia household over the life of the scheme and
limiting renewable generation share (Stock
2017).
South Australia generates
nearly half of its electricity
from wind and solar power.20 RENEWABLES READY:
STATES LEADING THE CHARGE
South Australia will build the largest lithium-
ion battery storage facility in the world.
In the past few years, the South Australian battery storage facility by 1 December 2017
Government has supported the rollout of which will be paired with Neoen’s Hornsdale
battery storage, seeking tenders to provide Wind Farm to store renewable energy for
battery storage to high profile buildings later use, provide stability services for the
along North Terrace including the Museum, electricity grid and emergency back-up
the State Library and the Art Gallery. The power (Premier of South Australia 2017).
project complements the City of Adelaide’s
Sustainable City Incentives Scheme that On 14 August, South Australia announced
provides rebates to households installing that a new 150MW solar thermal power
solar PV, battery storage systems and electric plant located in Port Augusta will supply
vehicle charging systems (City of Adelaide 100% of the state government’s electricity
2015). needs (Government of South Australia
2017). Solar thermal plants use mirrors to
Following the announcement of the Energy concentrate sunlight and heat molten salt,
Plan in March 2017, the South Australian in turn producing steam which drives the
Government called for expressions of interest turbine. The solar thermal plant will be the
from the private sector to submit proposals to largest of its kind in Australia and will be
construct the nation’s largest grid-connected able to provide reliable, renewable power
battery. All proposals received were subject to on-demand with 8-10 hours of storage.
a tender process which concluded on 7 July Batteries and solar thermal together represent
2017 when the South Australian Government a significant investment in large-scale
announced that Tesla and renewable energy renewable power that is available day and
company Neoen had won the bid. Tesla will night and will enhance the reliability and
now build a 100MW/129MWh lithium-ion security of the State’s power system.
Figure 10: The 91MW Wattle Point Wind Farm on the coast of South Australia.CHAPTER 04 21
RENEWABLE ENERGY TARGETS AND POLICIES
4.2 Australian Capital Territory
BOX 2: AUSTRALIAN CAPITAL TERRITORY – RENEWABLE ENERGY FACTS AND STATISTICS
Large-scale renewable power Policy
›› The third highest capacity of new renewable ›› The third highest share of renewable energy
energy per person (excluding large hydro). (22%).
Households ›› More than half (143MW) of new renewable
energy added in 2016 (built across the ACT,
›› 13.9% of ACT households have solar PV. South Australia, Victoria) was supported by the
ACT’s renewable energy target.
›› The ACT is the first state or territory in Australia
where both major political parties have ›› The ACT has completed its final renewable
provided bipartisan support for its renewable energy reverse auction putting the territory on
energy target. track to reach 100% renewable electricity by 2020.
Sources: ACT Government 2016a; APVI 2017.
The Australian Capital Territory (ACT) The ACT is the first state or territory where
has a renewable energy target (for energy both major political parties have provided
consumed) of 100% renewable electricity bipartisan support to its renewable energy
by 2020. The ACT Government has been target. In the context of national policy
progressively transitioning to renewable uncertainty, the ACT was able to capitalise
power sources since 2012, by holding on its “first mover advantage” and a buyer’s
five large-scale renewable energy reverse market, by attracting some of the best
auctions aimed at purchasing renewable renewable energy projects at low prices
energy from wind and solar projects at the (Climate Council 2016b). As the Territory
lowest price. The ACT’s reverse auctions have Government demonstrated its ability to
supported 600MW of wind power (Figure meet each of its set targets with limited costs
11) and 40MW of large-scale solar, with through its reverse auction process (Table 7),
the projects supporting jobs and training the ACT could then confidently increase its
opportunities across Canberra, Victoria and targets and bring them forward in time (The
South Australia (ACT Government 2015; Sydney Morning Herald 2016). The ACT’s
Climate Council 2016b). The following leadership on renewable energy shows the
projects completed construction in 2016: positive impact that one small territory can
Mugga Lane Solar Farm (13MW), Coonooer have in a few short years with political will
Bridge Wind Farm (19.4MW), Hornsdale 1 and smart policy design.
Wind Farm (100MW) and Willamsdale Solar
Farm (10MW).22 RENEWABLES READY:
STATES LEADING THE CHARGE
Table 7: The size, location and feed-in tariff price for renewable energy reverse auctions in the Australian Capital Territory.
Fixed feed-in tariff
Size price for renewable
Project name (MW) electricity over 20 years Location Current status
20MW Solar Auction 2012
Royalla Solar Farm 20 $186/MWh South of Canberra, ACT Completed 2014
(Figure 8)
20MW Solar Auction 2013
Mugga Lane Solar Farm 13 $178/MWh Tuggeranong, ACT Completed 2016
Williamsdale Solar Farm 10 $186/MWh Williamsdale, ACT Completed 2016
200MW Wind Auction 2014
Coonooer Bridge Wind Farm 19.4 $82/MWh Northwest of Bendigo, Completed early 2016
VIC
Hornsdale Wind Farm 100 $92/MWh North of Jamestown, Completed 2016
(Stage 1) SA
Ararat Wind Farm 80.5 $87/MWh Northwest of Ballarat, Completed in early 2017
VIC
200MW Wind Auction 2015
Hornsdale Wind Farm 100 $77/MWh North of Jamestown, Under construction, to
(Stage 2) SA be completed 2017
Sapphire Wind Farm 100 $89/MWh Near Glen Innes, NSW Under construction, to
be completed 2018
Next generation solar and wind (plus storage) 2016
Hornsdale Wind Farm 109 $73/MWh Southeast of Port Construction to
(Stage 3) Augusta, SA start late 2017, to be
completed 2019
Crookwell 2 Wind Farm 91 $87/MWh Northwest of Goulburn, Construction to
NSW start late 2017, to be
completed 2019
Total 640
Sources: Renew Economy 2013; Jacobs 2015; ACT Government 2016b.CHAPTER 04 23
RENEWABLE ENERGY TARGETS AND POLICIES
Successful solar and wind projects under the The ACT Government is undertaking one
ACT’s reverse auction process have delivered of the largest household battery storage
some of Australia’s cheapest prices for programs in the world. The Next Generation
renewable energy. The prices for successful Energy Storage Program aims to provide
wind energy projects (ranging from $73-92/ 36MW of distributed energy storage to
MWh) under the ACT’s process are equal to or households and businesses with battery
lower than prices for electricity from new coal storage by 2020 (ActSmart 2016).
and gas plants (ranging from $78-91/MWh)
(McConnell 2015). The ACT’s 2012 and 2013 The following Climate Council report
solar auctions produced some of the lowest provides more information on the ACT’s
prices for large-scale solar at the time, with renewable energy policy:
all projects priced similar to or lower than the
Australian industry benchmark of $180/MWh
(SKM 2013). Since that time, prices for large-
scale solar (including bids in the ACT’s 2016 Territory Trailblazer:
wind and solar auction) have come down How the ACT became the
substantially (Renew Economy 2016a). renewable capital of Australia
While the ACT has some of Australia’s
cheapest power prices, from July the
Independent Competition and Regulatory
Commission increased power prices by 19%
(ACT Government 2017b). This increase has
been driven by rising wholesale prices in the
National Electricity Market – in large part
driven by dramatic gas price increases. The
ACT’s 20-year fixed price contracts to achieve
100% renewable energy from 2020, will
partly shield its households and businesses
from future wholesale price rises (ACT
Government 2017b).
The ACT’s renewable energy
target is the only state or territory
target with bipartisan support.THE AUSTRALIAN CAPITAL TERRITORY IS
RISING UP ON RENEWABLES
100% RENEWABLE
ENERGY BY 2020
640MW OFWINDLARGE-SCALE
AND SOLAR
17,000 SMALL-SCALE SOLAR
INSTALLATIONS
$400+ MILLION IN ECONOMIC
BENEFITS TO THE ACT
36MW BATTERY
BY 2020
STORAGE
$73/MWh RECORD LOW PRICES
FOR WIND POWER
1,000+
CONSTRUCTION JOBS
Figure 11: The Australian Capital Territory is leading the way on uptake of renewable energy in Australia.You can also read