Mobile Video Explosion - WHITE PAPER Challenges and Solutions for Operators - Badu Networks
←
→
Page content transcription
If your browser does not render page correctly, please read the page content below
Mobile Video Explosion
                                               WHITE PAPER

Challenges and Solutions for Operators

                      BADU
                      networks
                        - Improving the way the world connects -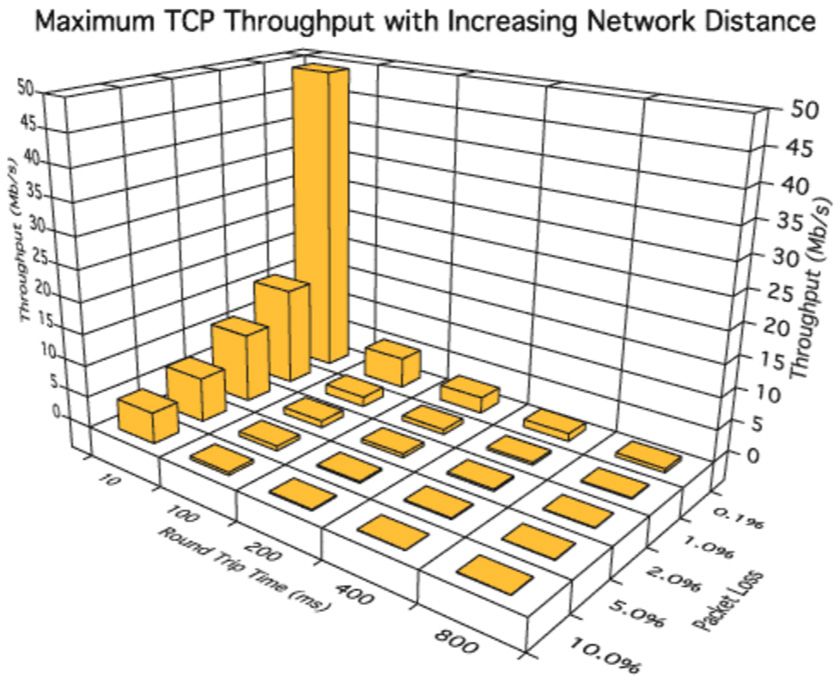
Mobile Video Traffic Volume Continues to Skyrocket
The consumer’s desire to consume digital media at       Cisco predicts, by 2019, 80% of all Internet traffic will
any location at any time seems insatiable. Fueling      be video. The dramatic increase will be driven by the
this growth is the increased capacity and reduced       increased popularity of over-the-top (OTT) video
pricing of mobile devices and their associated data     delivery.
plans.
                                                        Video and traditional TV consumption has changed
The attraction of technology and media is so            dramatically in recent years. Gone are the days of
strong that the US Bureau of Labor Statistics 1 has     limited channels, with viewers at the mercy of
found that the average American spends more             program schedules. OTT video service providers such
time using technology and consuming media than          as YouTube, Netflix, and Amazon have disrupted the
working or sleeping.                                    old model with a new and personalized “on-demand”
                                                        video service.
Among all types of digital media, video is most
popular. According to the Cisco annual VNI 2 fore-
cast, worldwide consumption of mobile video will
grow nearly ninefold from 2016 to 2021, and will
account for 78% of all mobile traffic by the end of
2021, up from 60% in 2016. From 2016 to the end
of 2021, while global mobile data traffic will
increase 700%, mobile video consumption will
grow even more at 870%.

                     More than three-fourths of the
                     world’s mobile data traffic will
                     be video by 2021. Mobile video
                     will grow at a CAGR of 54%
                     between 2016 and 2021, higher
                     than the overall average mobile
                     traffic CAGR of 47%.

                     Between 2011 and 2015, the
                     CAGR for Amazon Prime mem-
                     bers 3 was 92%. This growth is
                     correlated   with  introducing
                     Amazon Prime Video free to all
                     Amazon Prime members in Feb
                     2011. Amazon Prime is just one
                     example of strong influence of
                     OTT video consumer online
                     activities.

       BA DU
       networks
                                                                                                                1
Decelerating Growth of Mobile Revenue

                                            EBITDA Decline
                                            While mobile operators still enjoy
                                            reasonably large operating margins,
                                            their earning growth started to
                                            decline in 2016. According to UBS 4 :
                                            earning growth for US wireless
                                            operators has peaked in 2015; it will
                                            continue to decline or be flat for the
                                            next 5 years.

 ARPU Decline
 Many mobile operators are not on
 the receiving end of the financial
 bonus associated with the OTT
 video boom or mobile data explo-
 sion. In recent years, the ARPU for
 most mobile operators has been flat
 or declining:

                                       Negative Revenue Growth
                                       According to GSMA Intelligence 5, the total
                                       global revenue growth for mobile opera-
                                       tors in both developed nations and devel-
                                       oping nations will be lower than 2%.
                                       GSMA Intelligence 6 estimates the total
                                       global revenue for all mobile operators
                                       was 1.06 Trillion USD in FY 2015, repre-
                                       senting 2.18% growth from the prior
                                       year, while the ARPU per month was
                                       $10.25 in FY 2015, representing negative
                                       growth at -2.78%.

      BA DU
      networks
                                                                                 2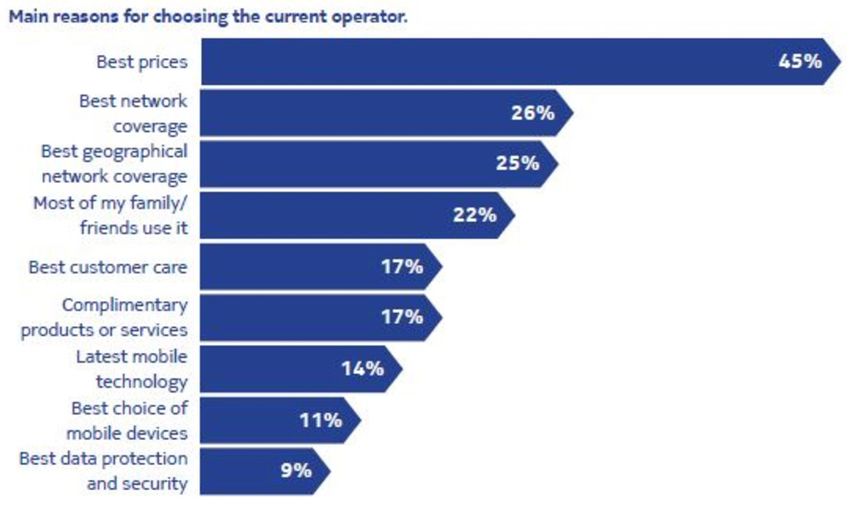
Productivity Challenge for Mobile Operators
In 2017, mobile operators face slow growth with             A recognized new source of revenue is business
increasing pressure to upgrade their network capac-         related to the internet of things (IoT). In a recent
ity. According to a special report from the Economists      report by Citigroup, the banking giant argued for
Intelligence Unit 7 (EIU), mobile operators have found      telecom operators to embrace the “digital transforma-
it difficult to monetize offerings such as fixed wireless   tion” and to do more to develop IoT technologies such
broadband. Besides spectrum constraints and invest-         as mobile banking, cloud-based TV, smart home func-
ment for 5G evolution, operators face competition           tionality, and e-health. In the first quarter of 2016,
from providers of OTT services like Netflix, YouTube,       vehicle connectivity was responsible for 32% of cellu-
Amazon, and Facebook/WhatsApp, whose online                 lar connections in the US, outstripping phones (31%)
offerings are spreading worldwide.                          and tablets (23%), according to Chetan Sharma, a
                                                            consulting firm.

  All these recommendations and
  predictions are predicated on heavy
  investment in network infrastruc-
  ture. In such environments, all
  operators have to look carefully at
  their strategies for capacity expan-
  sion.
  All mobile operators are facing a
  productivity challenge. According to
  Tefficient 8 , mobile operators as a
  group spend approximately 15%-
  20% of their revenue just to retain
   their customers.

Network Quality is Critical to Avoid Churn

  According to a Nokia 2016 Acquisi-
  tion and Retention Study 9 summary
  report, Network Quality is the second
  most important factor for subscriber
  retention. While the importance
  subscribers place on Network Quality
  varies between operators, dissatis-
  faction with Network Quality is
  closely linked with the likelihood to
  switch. In fact, 42% of subscribers
  claiming to be very dissatisfied with
  their Network Quality would like to
  switch as soon as possible.

        BA DU
        networks
                                                                                                              3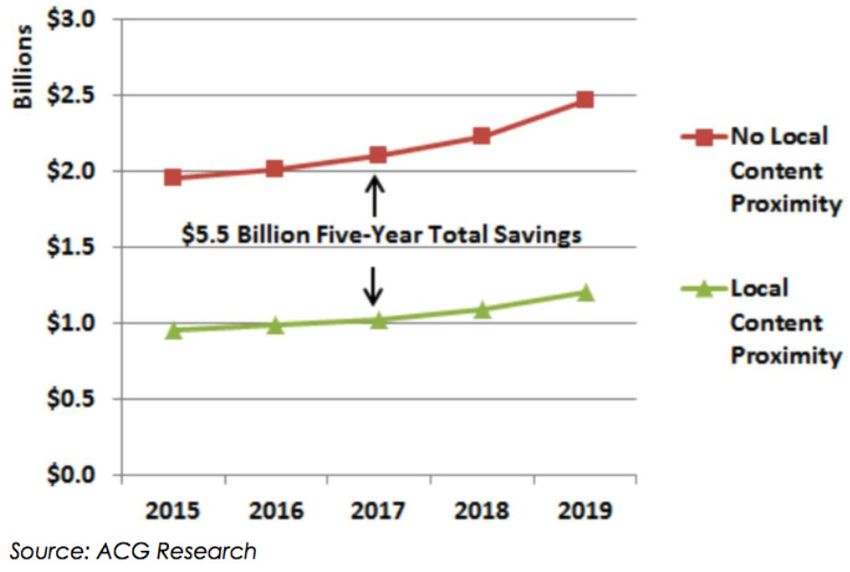
Video Quality of Experience Requires Bandwidth
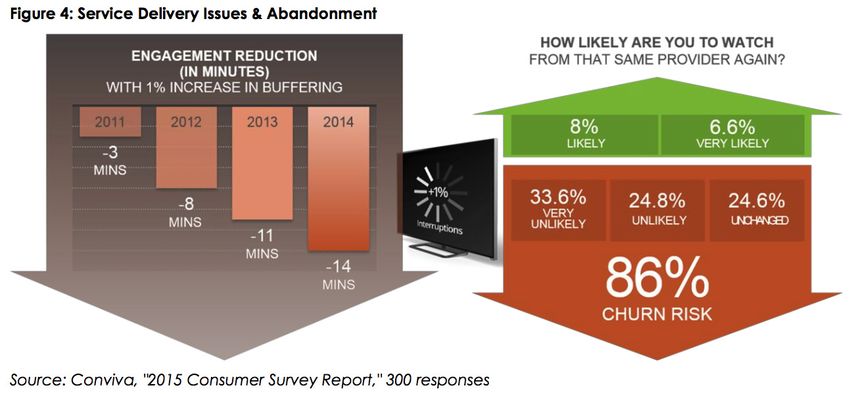
As video becomes the dominant type of mobile media, consumers are increasingly sensitive to QoE issues in
watching videos. This problem will be exacerbated by the coming of 4K videos. Based on the research by
Conviva, all 3 critical factors for QoE for video viewing are dependent on bandwidth. Higher bandwidth is
becoming the dominant factor in subscriber QoE and churn rate for mobile operators. According to a study
from Conviva1 0, major providers of the online video streaming market lost $2.16B in revenue in 2012 due to
video problems, and will miss out on an additional $20B in 2017. The top 3 problems that cause viewers to
abandon viewing are: long startup delays, frequent buffering, and low video quality.
Three critical factors recognized by Conviva for video QoE require bandwidth:
Load Time: shorter load time requires higher bandwidth
Buffering: less buffering requires consistent bandwidth
Video Quality: better video quality requires higher bandwidth
According to Conviva11 ,
viewers have become intol-
erant of poor video quality:
In a survey done by
Conviva12 , a provider
runs a churn risk of
86% for a mere 1%
increase in video
buffering:
BA DU
networks
4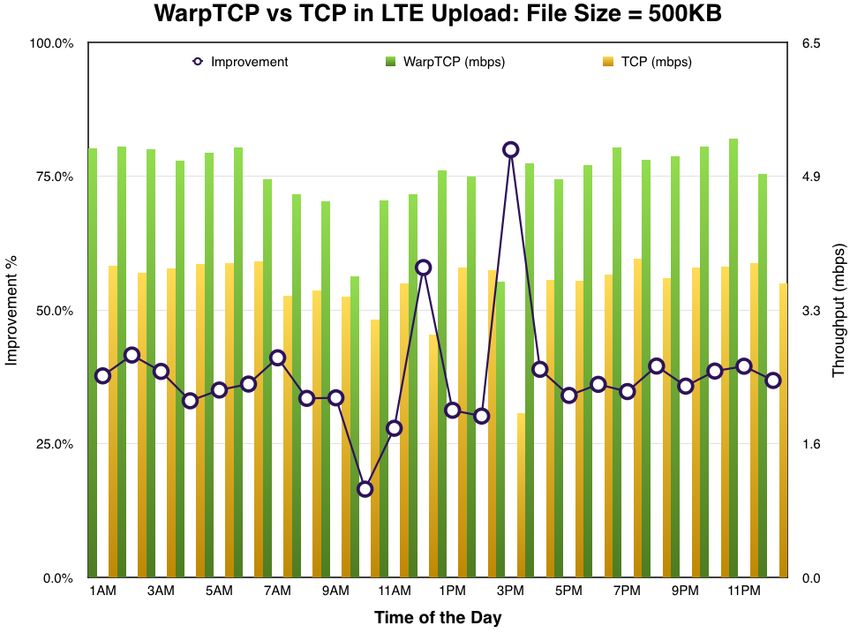
Content Should be Pushed to the Edge
Today, as broadband connection to the Internet          That would amount to a 50% cost reduction over the
becomes affordable, users are accustomed to             current long-haul transport method.
high-bandwidth consuming applications, causing
the overall Internet traffic to grow at a 30%-50%       If this approach is adopted in the CSP industry, this
annual pace. Consequently, cable operators, telcos      will translate into huge backbone savings and cost
and other communications service providers              reduction. According to ACG Research, bringing a
(CSPs) find themselves in a bind. According to          majority of content to the edge for 50 million house-
HeavyReading1 3 , CSPs are seeing their backbone        holds would save the industry $5.5 billion over the
networks increasingly filling beyond the breaking       course of five years.
point.
Additionally, CSPs find their total network transport
costs soaring, even though the cost per port or
data packet continues to decline. Despite their best
efforts, the problems caused by surging network
traffic are easily outpacing the benefits achieved by
improving their network efficiencies.
To solve the traffic clogging problem, a number of
firms such as HeavyReading, ACG Research,
Conviva, EdgeConneX, etc., now advocate pushing
data to the edge.
In a study conducted in 2015 for EdgeConneX, ACG
Research 1 4 found that, for a metro area with 1
million subscribers, introducing local content prox-
imity could generate $110 million in backbone
transport cost savings over a five-year span.

In separate research by Conviva1 5 , localized cach-    In the TDF study, a multicast network which would
ing improves video rebuffering by significant           cover about 30% of the population of France (main
amounts.                                                cities) could offload 220 PB out of the 500 PB trans-
                                                        mitted on the cellular network for this population. The
In comparative trials in Boston, Norfolk, Las Vegas,    220 PB offload would be achieved by multicasting
and San Diego in 2015, Conviva found that edge          only 1 TB of popular content, equivalent to a reduc-
datacenters allow ISPs and CDNs to produce lower        tion factor of 200,000. Using this approach, the
video rebuffering rates for their subscribers. In       estimated savings in transport cost over the 10-year
Norfolk, for instance, Conviva reported that the        period of 2016-2025 would exceed €10 Bn.
rebuffering rate improved 37% for end users on
one ISP's network, while the rebuffering rate           The multicasting approach, while not feasible for
improved nearly 35% for Akamai users on the             many applications, is along the same line of reasoning
second ISP's network.                                   for pushing content to the edge.
According to a study by TDF Group1 6 (a French
broadband and mobile network operator), a
promising recourse to the surging network traffic
in France is replacing redundant and repeated
transmissions in unicasts by multicasts.

        BA DU
        networks
                                                                                                           5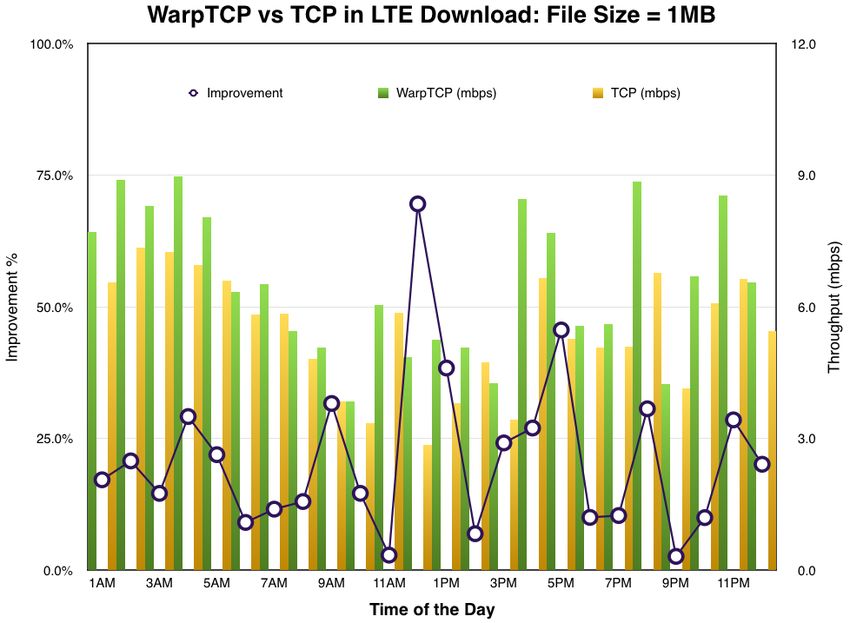
Content at the Mobile Edge is Coming with 5G
Pushing content to the mobile edge is coming with 5G.        Knowledge of real-time radio network conditions
Today, Mobile Edge Computing (MEC) is being stan-            and context information (such as location) can be
dardized along with other 5G-related standards.              used to optimize the network and service opera-
                                                             tion. This would improve service experience and
One of the first places mobile networks will be trans-       utilization of network resources, by optimizing
formed with 5G is in cellular base stations. As part of      traffic with more flexibility and reduced load.
the MEC initiatives 1 7, operators plan to enable applica-
tions to run at the edge, or at the base stations. This      MEC enables new value chains, fresh business
will reduce the network latency experienced by an end        opportunities, and a myriad of new use cases
user accessing an application over a mobile network.         across multiple sectors. MEC enables a computing
                                                             environment characterized by low latency, proxim-
With MEC, the RAN (radio access network) edge                ity, high bandwidth, and real-time insight into radio
becomes a new value center for mobile operators.             networks. All these features can translate into
Content served from the RAN edge not only saves the          value for mobile operators, application providers,
operators 50% (ACG Research) in back-haul and                and content providers. MEC also allows providers to
long-haul transport costs, but also provides the best        play complementary and profitable roles within
possible user experience by minimizing the latency           their respective business models, by better mon-
between the content server and the customer device.          etizing mobile data experiences.
This is a fundamental advantage, only enjoyable by
the mobile operators.

Badu WarpTCP — TCP Optimization at Mobile Edge
  At this writing, Badu’s WarpTCP is the only GTP-compatible TCP proxy and caching solution installable at the
  base station. Badu’s WarpTCP solution has been field-tested with a tier-1 mobile operator in USA and a tier-1
  mobile operator in China.

        BA DU
        networks
                                                                                                                 6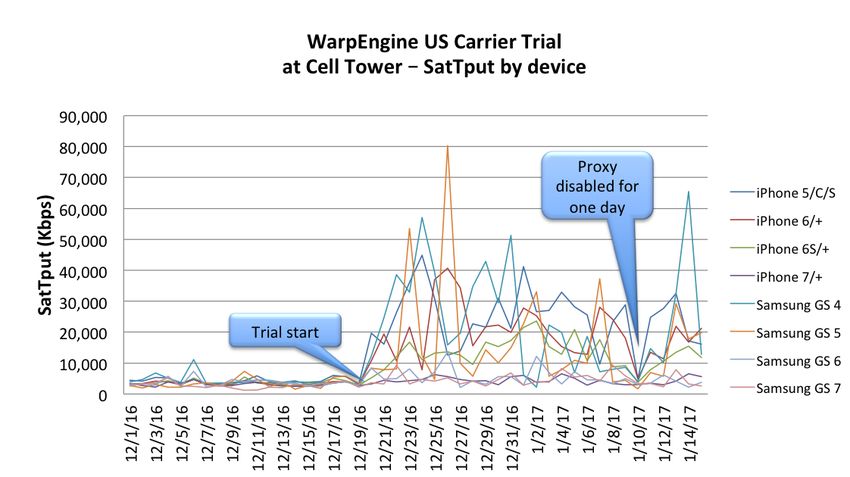
Badu WarpTCP — Solving the TCP Bottleneck Problem
Badu’s WarpTCP technology suite is the only one in the      The TCP slowdown can be large or small — however,
industry that solves a critical problem in data transport   as the modern mobile network becomes highly com-
between servers and clients. While CSPs and mobile          plex, small amounts of jitter can cause transport
operators provide a bandwidth infrastructure to deliver     bandwidth utilization to drop by a significant amount
data to and from a server or a client, Badu’s WarpTCP       for a significant amount of time. A common TCP
ensures network bandwidth is utilized at a high level.      slowdown can be experienced at a Wi-Fi hotspot.
High utilization is critical as it lowers the capital and   When there are more than 5-10 devices attached to
operating expenditures for owning a bandwidth infra-        a hotspot, total utilization of the available bandwidth
structure.                                                  at the hotspot can drop to 5%-10%. In such
                                                            hotspots, there is usually no shortage of Wi-Fi or
TCP is a cause of concern because TCP will often            backhaul bandwidth — the problem is that the serv-
prevent a server (for download) or a client (for upload)    ers or clients are stopped by TCP transmission
from sending data to the designated receiver. This is a     control.
problem inherited from the simple end-to-end feed-
back control grounded in the TCP design objectives.         Badu’s WarpTCP solution solves the TCP bottleneck
While this design allows TCP to operate under all types     problem. TCP slowdown wastes transport bandwidth
of network condition, it also causes TCP to be overly       and causes user dissatisfaction, which leads to churn
conservative when the network path encounters               at mobile operators.
various types of jitter.

                         This diagram 1 8 shows TCP
                         slowdown in reaction to
                         end-to-end delay variance.

                                                            This diagram19 shows
                                                            exponential TCP slowdown
                                                            in reaction to RTT (round-
                                                            trip time) and packet loss.

        BA DU
        networks
                                                                                                                7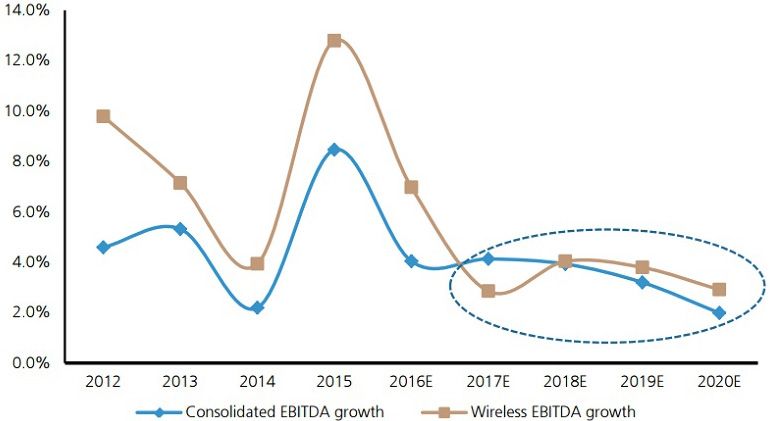
U.S. Mobile Operator Case Study
              In this US carrier, the saturation throughput 20 measured at the base
              station after Badu’s WarpTCP was installed skyrocketed 5-10 times for
              many mobile devices:

                 In this US carrier, a field download test with file size of 1MB shows
                 average improvement at 21.3% with 69% peak improvement; a field
                 upload test with file size of 500KB, shows average improvement at
                 37.9%, with peak improvement at 80%:

   BA DU
   networks
                                                                                         8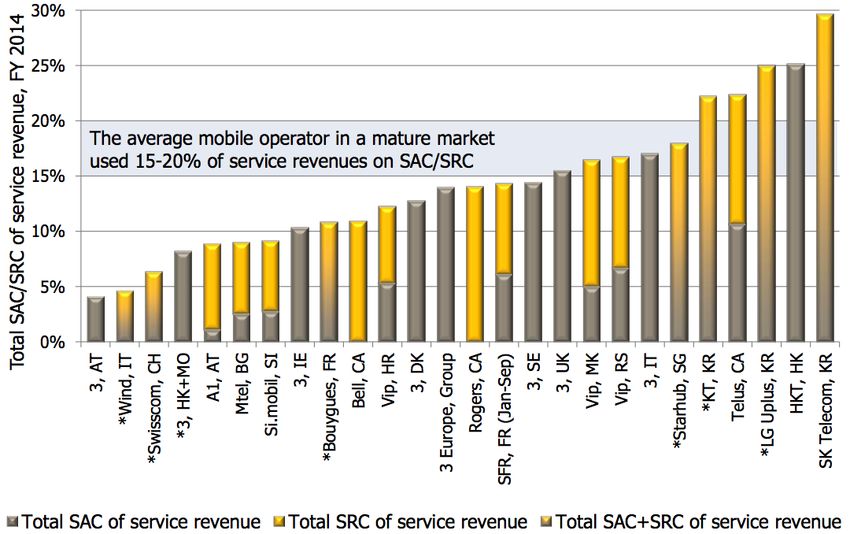
China LTE Operator Case Study
The WarpTCP proxy has been deployed at multiple LTE cell sites with a Chinese Operator since the end of 2016.
It was independently concluded by the Chinese Operator that the following five operating indicators all saw
considerable improvements: TCP throughput, Video streaming download rate, TCP retransmission rate, TCP
handshake duration (wireless side), RTT (terminal side).

          Video Buffer Initial Delay
          During a time of heavy traffic, WarpTCP
          lowered the video buffer initial delay by
          1059.33 ms, or a decrease of 29.8%.
          During a time of slow traffic, WarpTCP
          lowered the delay by 537.66 ms, or a
          decrease of 30.09%.

                                                           Video Peak Buffer Speed
                                                           During a time of heavy traffic, WarpTCP
                                                           raised the video peak buffer speed by
                                                           6.57 mbps, or an increase of 98.21%.
                                                           During a time of slow traffic, WarpTCP
                                                           raised the video peak buffer speed by
                                                           12.57 mbps, or an increase of 127.21%.

          Video Perceived Speed
          During a time of heavy traffic, WarpTCP
          raised the video perceived speed by 1.95
          mbps, or an increase of 129.12%.
          During a time of slow traffic, WarpTCP
          raised the perceived speed to 3.16
          mbps, or an increase of 122.96%.

       BA DU
       networks
                                                                                                          9
Comparative Cost for Badu’s WarpTCP
Badu’s WarpTCP 1G-CT is a box that delivers 1Gbps According to Cisco VNI 24, the average mobile data
(uplink and downlink), which is installable at a typical consumption per month globally was 1.6 GB for
LTE cell site. To compute the production cost per GB 2016. Assuming ARPU = $10, and 8% of ARPU is
for a typical operator, we assume the box is installed used for CapEx for the LTE site, then the cost for
at a LTE-A site with maximum downlink speed of delivering 1.6 GB per user per month is $0.8 (=
1Gpbs (500 Mbps for uplink), with utilization at 40%21 $10*8%). To provide x% improvement in band-
and uplink traffic being 30% 2 2 of downlink traffic. width, the cost will be proportionally scaled up by
Assuming the CapEx for the 1G-CT box is depreciated x% — if the improvement in BW (bandwidth) is 5%,
over 3 years, then the base production cost per GB is then the LTE CapEx will be $0.8*(1+0.05) = $0.84
$0.0081. (see the corresponding entry in the table below).
To compute the production cost per GB for an opera- Next, we account for increased BW because of the
tor, we will use the published industry data from installed WarpTCP 1G-CT. If the extra bandwidth
various sources. According to GSMA Intelligence, the delivered by WarpTCP is x%, then the production
average ARPU for global mobile operators for FY 2015 cost per GB for the WarpTCP will be decreased
was $10.25. Based on UBS and GSMA Intelligence, the proportionally. Thus, when the base CapEx for
average ARPU for 2016 was flat or lower than the deploying WarpTCP is $0.0081, then the final CapEx
ARPU for 2015. Therefore, we will take $10 for the cost per GB will be $0.0081/(1+x%), when the
average ARPU for global operators in 2016. According bandwidth improvement is x%. In our study, as we
to an Ericsson 2 3 study, average network OpEx for assume 1.6 GB is delivered per user per month, the
operators is 5% of revenue, while depreciation final production cost is adjusted accordingly. There-
network CapEx is 8% of revenue. The Ericsson report fore, if the BW improvement due to WarpTCP is 5%,
is based on depreciation over 8 years in hardware and then the production cost of deploying WarpTCP to
3 years for software. deliver 1.6 GB per month per user is
$0.0081*1.6/(1+0.05) = $0.0124 (see the corre-
sponding entry in the table below).
The following table lists the cost ratio between LTE CapEx and the Badu’s
WarpTCP CapEx for delivering 1.6GB per user per month, with BW improvement
ratio ranging from 5% to 50%.
Therefore, Badu has an excellent cost advantage.
Even at improvement ratio of 5%, the cost advantage is 67.8 times.
BA DU
networks
10Benefits in Churn due to Badu’s WarpTCP
Churn rate has been one of the top concerns for all Therefore, $117.06 is the value of reducing churn
mobile operators. According to Tefficient 2 5, the blended rate at 1% per month per customer.
churn rate for global operators in 2016 was 25% annu-
ally. According to a Nokia study2 6, the global churn rate To quantity benefits in churn, we will employ an
in 2016 was 14% annually. We will take the average of artificial ratio R = (percent change in
the 2 reports, and use 19.5% as the assumed global churn)/(percent change in BW). R reflects the influ-
churn rate — this translates into 1.495% monthly ence in churn due to the single factor of bandwidth
churn. According to Tefficient 2 7, the average spending improvement. We will assume R = 100: in other
for SRC+SAC by global operators was 15%-20% of words, 50% improvement in bandwidth will produce
service revenue — we will assume 17.5% of ARPU is only 0.5% (reduction) in monthly churn. From user
used for reducing churn. experience point of view, 50% improvement in
throughput is quite noticeable for video viewing,
Therefore, the financial value of reducing churn can be 0.5% improvement in monthly churn is a conserva-
computed based on the global average ARPU at $10 — tive estimate.
every 1% monthly churn reduction is worth
ARPU*17.5%/1.495%=$10*17.5/1.5= $117.06.
Badu has an excellent ROI advantage.
Even at bandwidth improvement ratio of 5%, the ROI ratio is 3.7 times.
Conclusion
Bandwidth is money, especially for mobile operators, as the investment to expand network capacity is a
costly proposition. Capacity expansion is critical for profitability for mobile operators. Moving content to
the edge will save about 50% of backhaul and long-haul bandwidth cost. Adoption of a TCP de-bottleneck
solution will improve efficiency for existing bandwidths.
With the advent of 4K video, the pressure of surging mobile data traffic has to be dealt with using the
highest leverage of the existing bandwidth infrastructure. Badu’s WarpTCP is the only TCP de-bottleneck
solution that can be deployed at any location in the network.
It is time to take action to improve profitability and productivity for mobile operators.
To request a demo, visit: www.BADUnetworks.com.
B A DU
networks
11References
1. Bureau of Labor Statistics, with the Telegraph, Edison 1 5 . http://www.edgeconnex.com/wp-content/uploads/2017
Research, We Are Social, eMarketer, Nielsen, National /02/HR-EdgeConnex-Edge-Data-Centers-WP-1-20-17.pdf
Sleep Foundation, Deloitte, SNL Kagan, Sandvine, Ipsos,
comScore, Global Web Index, OECD, and Activate 1 6 . http://www.tdf-group.com/sites/default/files/B2M%20-
analysis. %20White%20Paper%20finalUK.pdf
2. http://www.cisco.com/c/en/us/solutions/collateral/servi 1 7 . http://www.etsi.org/images/files/ETSIWhitePapers/et
ceprovider/visual-networking-index-vni/mobile-white-pap si_wp11_mec_a_key_technology_towards_5g.pdf
er-c11-520862.html
1 8 . Chan & Ramjee, “TCP/IP Performance over 3G Wireless
3. http://www.businessinsider.com/chart-of-the-day- Links with Rate and Delay Variation” MOBICOM'02
amazon-has-nearly-60-million-prime-members-2014-12
1 9 . http://downloads.asperasoft.com/en/technology/short
4. http://www.fiercewireless.com/wireless/ubs-margins- comings_of_TCP_2/the_shortcomings_of_TCP_file_transf
for-u-s-wireless-carriers-have-peaked-it-s-all-downhill- er_2
from-here
2 0 . Saturation throughput is defined as the limit through-
5. The Mobile Economy 2016: GSM Association put reached by a system as the offered load increases.
In this test, a program increases the download traffic to
a single device and measures the saturation download
6. https://www.gsmaintelligence.com/
throughput in that device. This measure provides the
highest sustainable download throughput at the device.
7. http://pages.eiu.com/rs/783-XMC-
194/images/Telecoms_in_2017.pdf
2 1 . 40% is a conservative estimate of link utilization.
According to a Nokia report, cites with utilization ranges
8. Industry analysis #2 2016, “Wi-Fi – the last piece of the from 40% to 90% are subject to carrier upgrade:
customer retention puzzle?” published by tefficient. see https://tools.ext.nokia.com/asset/200996.
9. Nokia 2016 Acquisition and Retention Study; 2 2 . https://tools.ext.nokia.com/asset/200183
https://pages.nokia.com/rs/677-JYK-041/images/Nokia-
AR_Global_Summary_Report.pdf
2 3 . https://www.ericsson.com/ericsson/corpinfo/publications
/ericsson_business_review/pdf/209/209_BUSINESS_CASE
10.https://bitmovin.com/video-problem-3-reasons- _mobile_broadband.pdf
users-leave-website-badly-implemented-video/
2 4 . http://www.cisco.com/c/en/us/solutions/collateral/servic
11 .Ibid. e-provider/visual-networking-index-vni/mobile-white-paper
-c11-520862.html
12.http://www.edgeconnex.com/wp-content/uploads/2017
/02/HR-EdgeConnex-Edge-Data-Centers-WP-1-20-17.pdf
2 5 . http://tefficient.com/2016-was-a-great-year-for-
mobile-customer-loyalty/
13.Ibid.
2 6 . https://pages.nokia.com/AR-Study-Series.html
14.http://3tjgg82p9t5x33q15k3lwedm.wpengine.netdna-
cdn.com/wp-content/uploads/2015/05/
TheGrowingValueofContentatTheEdge_WP_05.27.15.pdf 2 7 . Industry analysis #2 2016, “Wi-Fi – the last piece of
the customer retention puzzle?” published by Tefficient.
BADU p 949-310-5390
f 888-958-7697
networks e info@badunetworks.com
2640 Main Street Irvine CA 92614
http://www.BADUnetworks.com
© 2017 BADU Networks. All rights reserved.You can also read