Modelling the solar photospheric plasma and magnetic field dynamics during the emergence of AR 11190
←
→
Page content transcription
If your browser does not render page correctly, please read the page content below
Modelling the solar photospheric plasma and
magnetic field dynamics during the emergence
of AR 11190

        Campos Rozo, Jose Ivan1,2; Utz, Dominik1,3; Veronig, Astrid1;
        Vargas Dominguez, Santiago2
        1
          Institute of Physics/IGAM, University of Graz, Graz, Austria
        2
          Observatorio Astronómico Nacional, Universidad Nacional de Colombia, Bogotá,
           Colombia.
        3
          Instituto de Astrofísica de Andalucía IAA-CSIC, Granada, España.

        Abstract
        The interaction between the plasma and the magnetic field has been studied before by various
        authors. In this work we will show a detailed study employing two different distributions
        applied to the flow velocities during the emergence and prior evolution of AR 11190 on 11-
        April-2011. The velocity fields are computed from intensity as well as LOS magnetograms by
        using Local Correlation Tracking (LCT) techniques. Horizontal velocities as well as vertical
        velocities show strong correlation between the emergences of new fast and strong positive
        magnetic elements, and strong divergences observed from vertical velocities calculated by LCT
        in continuum data. Although there are several divergence regions within the field of view, just
        the region of interest shows the emergences of new magnetic field.

1. INTRODUCTION                                             with higher frequencies in mesogranule regions (e.g.
                                                            Title et al. 1989), or during the emergence of magnetic
    The solar phostophere shows on its surface different    field, and its subsequent accumulation in intergranular
features related with the emergence of convective flows,    zones (Domínguez Cerdeña 2003; Ishikawa & Tsuneta
transporting plasma, energy as well as magnetic field       2011).
from the solar interior. The plasma emergences display
flow     convective     patterns  called    granulation,    2. DATA
mesogranulation, and supergranulation, depending on
the spatial and temporal dimension of their organization         On April, 11, 2011 an active region started to form
and evolution. On the photosphere it is also possible to    on the solar disk. We focused in this AR 11190 (see
observe the arrangement of magnetic field at different      Fig. 1). Here it was possible to observe the time
scales, from small-scales, like Magnetic Bright Points      instances of the emergence and formation of the AR.
(MBP; Utz, D. et al. 2010), to large-scale magnetic         The used data covers the 24 hours of April 11, 2011
concentrations such as Sunspots (Solanki, S. K., 2003)      during the first formation stage of the AR, and consists
or Active Regions (AR). Different Local Correlation         of continuum image data, as well as Line Of Sight -
Tracking (LCT) techniques have been used for the            LOS magnetograms, taken with the Helioseismic and
analysis of these features. LCT was applied for the first   Magnetic Imager (HMI; Hoeksema et al. 2014) on board
time by November and Simon (1988). The algorithm is         of the Solar Dynamics Observatory (SDO; Pesnell et al.
based on the idea to find the best cross-correlation        2012) spacecraft. The cadence for intensity maps as
between the intensities of two consecutive images in t,     well as for magnetic field images is 45 seconds, whereas
and t+τ, time instances. Besides, the plasma vertical       the pixel size corresponds to ~ 0.504 arcsec/pix.
intrinsic emergences, the photospheric evolution is             The data need to be prepared before the analysis can
strongly influenced by the expansion and fragmentation      be started (e.g. de-rotation, co-aligment, subsonic-
of the granules. The meso- and supergranules have been      filtering). All the preparation and analysis have been
associated to fast emergence flows (Palacios et al.         done using Python programming language, and the
2012), as well as to explosive granules, which occur        specialized library for the solar data analysis SunPy

                                                            1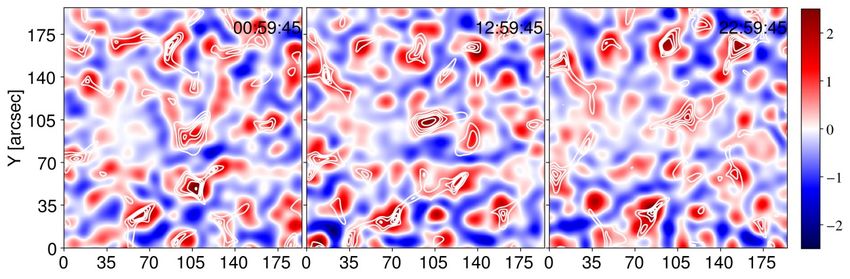
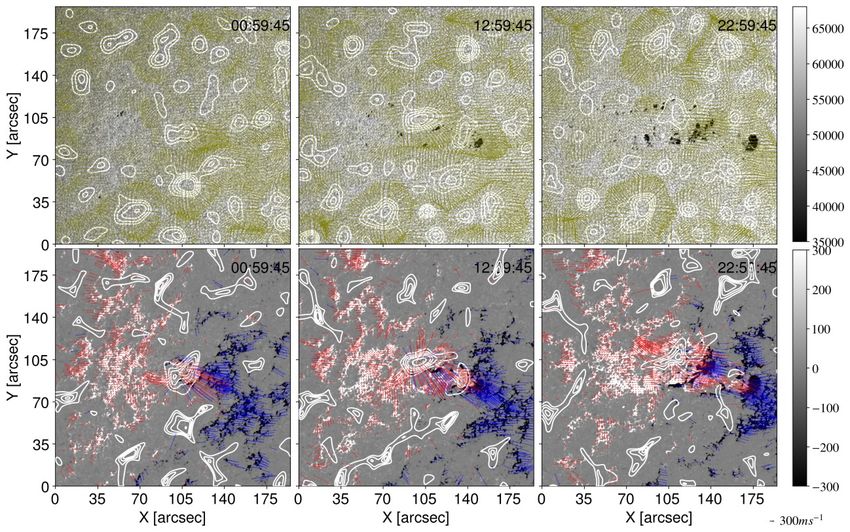
Figure 1. Temporal evolution during the emergence of AR 11190 on April 11, 2011. [Top] Continuum images enhanced for
double resolution (~0.25 arcsec/pix). [Bottom] LOS magnetograms with the same resolution after application of the
enhancing algorithm.

(SunPy Community et al. 2015). As the calculations of       the time instances of the two images, and the W(x-ζ)
proper motions are dependent on the resolution of the       function is an apodization window, that for our
data, we improved the resolution of the HMI data            particular case, was chosen to be represented by a
(continuum images as well as the LOS magnetograms)          Gaussian window, defined by the value FWHM as
using the new enhancing algoritm, described in Diaz         mentioned before.
Baso, C. J. et al (2018).                                       Figure 1 shows three time instances of the evolution
                                                            during the formation of AR 11190. The top row displays
3. ANALYSIS AND RESULTS                                     the continuum images, whereas the bottom row shows
                                                            the evolution of LOS magnetic field. Clearly one can
    We focused on the tracking and dynamic behaviour        observe the fast emergence of positive magnetic field in
of the horizontal and vertical velocity fields obtained     the center of the Field of View (FOV) that pushes the
from intensity as well as magnetic field maps during the    pre-existent magnetic elements away.
formation instances of AR 11190. Emergence flows are           The first row in Fig. 2 shows the horizontal
associated to meso- and supergranules (Palacios et al.      velocities calculated from the continuum data. Contour
2012). Thus, to be able to detect these flows, we have      levels represent the vertical positive velocities
chosen the size of the correlation window FWHM as           overplotted on the maps with the background being
12.5 arcsec that are correlated with average size for       associated with the time instances shown in each image.
mesogranules (~ 9 Mm; November et al., 1981), and           Second row displays the horizontal velocities obtained
applied a temporal average of 2 hours (Life-time            from LOS magnetograms plotted over the maps at the
average for mesogranules; ver Hill et al.1984; Rast         respective times, where the red arrows represent the
2003. The LCT algorithm used in the present work is         horizontal velocities associated with proper motions of
given by                                                    fast and strong positive magnetic elements (> 50 G),
                                                            whereas the blue arrows are connected with strong and
Ct,t+τ(δ,x) = ʃ Jt(ζ-δ/2)Jt+τ(ζ-δ/2)W(x-ζ)dζ,      Eq. 1    fast negative magnetic elements (< -50 G).
                                                               The behaviour of the horizontal flow fields displayed
where Ct,t+τ(δ,x) represents the coordinates of the         in Fig. 2 show how the formation of the AR 11190 is
position as well as the displacements in both directions,   leaded by the fast and violent emergence of new strong
x, and y. The terms Jt, and Jt+τ represent the intensity    positive magnetic elements in the center of the FOV,
values for two consecutive images. Times t, and t+τ are     pushing the previous positive and negative magnetic

                                                            2
field. It is possible to observe that whereas the center of vz(vx, vy)=hm ∇∙vh(vx, vy), Eq. 2
the field of view seems to emerge following radial
motions, in general, the magnetic field has strong where hm is a constant and represents the mass flux
motions to the right. scale (see November et al. 1981). The background maps
Figure 3 shows vertical velocities calculated using represent the vertical velocities obtained from the
the idea of the divergence between the horizontal intensity maps (plasma motions), and the white contour
velocities vx, and vy, leading to vz via lines represent the positive vertical velocities with
values of [0, 1, 1.5, 2, 2.5] km/s.
Figure 2: Temporal evolution of the horizontal velocity fields. [Top] Plasma horizontal velocities with positive vertical
velocities plotted by the white contours. The contour lines represent velocity values of [0, 1, 1.5, 2, 2.5] km/s. [Bottom]
Horizontal velocities calculated from the LOS magnetograms. Contour lines represents again positive vertical velocities with
the values mentioned before. The arrow in the right lower corner represents a vector with a magnitude of 0.3 km/s.
Figure 3: Temporal evolution of the vertical velocity fields. The figure shows the correlation between vertical velocities
calculated from continnum maps, and vertical velocities obtained from LOS magnetograms. Background maps are vertical
velocities from intensity maps, whereas contour lines represent positive vertical velocities from LOS magnetic fields. The color
map represent the vertical velocities in the background in km/s.
3Although the plasma flow fields shows fast Acknowledgments
divergences (long arrows) in different “centers” of our
FOV, and some contours are associated with some of We acknowledge the support of FWF project P27800.
those divergences, it is clear to observe that there are HMI/SDO data were obtained from the Joint Science
not strong magnetic elements associated to these Operation Center (JSOC), and they are courtesy of
emergences, which is only possible to observe in the NASA/SDO and the AIA, EVE, and HMI science teams
region of interest where AR 11190 is starting the
formation. REFERENCES
[1] The SunPy Community, et al. Sunpy-Python for Solar Physics,
5. CONCLUSIONS APJ - Computational Science and Discovery, 8.
[2] Palacios, J., Blanco Rodríguez, J., Vargas Domínguez, S., et al.
2012, A&A, 537, A21.
During the formation stage of solar active regions, it [3] November,L. J. and Simon,G.W.: 1988, Astrophys. J.333, 427.
is possible to distinguish how the proper motions of the [4] November, L. J., Toomre, J., Gebbie, K. B., Simon, G. W. 1981,
plasma (continuum images) within the region of interest ApJ, 245, L123-L126.
[4] Domínguez Cerdeña, I. 2003, A&A, 412, L65.
are affected by the emergence of new magnetic field.
[5] Title, A. M., Tarbell, T. D., Topka, K. P., Ferguson, S. H., Shine,
However, it is not possible to say the same in the R. A., and SOUP Team (1989). Statistical properties of solar
contrary sense, due to, even where it would be possible granulation derived from the SOUP instrument on Spacelab 2. ApJ,
to observe strong divergences of plasma, there are not 336:475-494.
[6] Ishikawa, R. & Tsuneta, S. 2011, ApJ, 735, 74.
emergences of new and strong positive magnetic
[7] Utz, D., Hanslmeier, A., Muller, R., Veronig, A.,Rybák, J., and
elements in such regions. Muthsam, H. 2010, A&A, 511, A39.
Generally, the flow fields comprise, in the case of [8] Solanki, S. K. 2003. Sunspots: An overview. A&A Reviews, 11,
active regions, stronger magnetic elements, which are 153-286.
[9] Diaz Bazo, C. J. & Asensio Ramos, A. 2018, A&A, 614, A5.
often also of bipolar nature showing a way-more
[11] Hill, F., Gough, D., Toomre, J. 1984, Mem S. A. It., 55, 153-161.
turbulent behavior than their corresponding counterparts [12] Rast, M. P. 2003, ApJ, 597, 1200-1210.
in the quiet Sun. A more detailed study about the [13] Hoeksema J. T., Y. Liu, K. Hayashi et al. (2014). The
dynamics and the behavior of the connection between Helioseismic and Magnetic Image (HMI) Vector Magnetic Field
Pipeline: SHARPs – Space- Weather HMI Active Region Patches,
the plasma motions with the emergence of new
Sol. Phys. 289, 3549.
magnetic fields is described in Campos Rozo et al. [14] Pesnell, W. D., B. J. Thompson, P.C. Chamberlin (2012). The
2018a. Solar Dynamics Observatory (SDO), Sol. Phys. 275, 3.
A similar study was performed in order to compare [15] Campos Rozo, J. I., D. Utz, S. Vargas-Domínguez, A. Veronig,
T. Van Doorsselaere 2018, A&A Photospheric plasma and magnetic
the behavior during the formation of an AR and the
field dynamics during the formation of solar AR 11190, under review.
evolution of proper motions within a Quiet Sun region [16] Campos Rozo, J. I., D. Utz, A.Veronig, S. Vargas-Domínguez,
(Campos Rozo et al. 2018b) Proccedings Workshop “Solar Influence on the Magnetosphere,
Ionosphere and Atmosphere”. Vol. 10, p. 37-42. ISSN 2367-7570
4You can also read