MARITIME TOURISM IN THE ADRIATIC SEA AND THE 2020 THRESHOLD - Adriaeco

Page created by Sally Carpenter
 
CONTINUE READING
MARITIME TOURISM IN THE ADRIATIC SEA AND THE 2020 THRESHOLD - Adriaeco
MARITIME TOURISM IN THE ADRIATIC SEA AND THE 2020 THRESHOLD
The 2019 edition of Adriatic Sea Tourism Report (ASTR) continues the series dedicated to analysis and
description of maritime tourism in the Adriatic Sea, with information and data updated every year since the
first edition (2013). This report provides in-depth quantitative and qualitative information on the three sectors
of maritime tourism in the Adriatic Sea: cruise, ferry and sail and yachting tourism.
This report is derived from information and data collected directly by Risposte Turismo, thanks to lengthy, in-
depth dialogue with several Adriatic stakeholders who collaborated. These stakeholders include ports and
marinas (individual and networks), passenger terminals, charter operators, navigation and tourism companies,
national institutes of statistics, tourism destinations, public administrations and tourism boards. ASTR also
contains the results of analysis, researches, studies of data and info regarding traffic, investments, demand,
supply, plans, strategies, priorities and obstacles within the maritime tourism sectors in the area.
The 2019 edition of the report – in addition to methodology and this introduction – maintains its chapter
structure, the ones focussing on the cruise, ferry and sail and yachting sectors. The edition includes graphs,
tables and maps and an examination of the movements of tourists by sea, directions, dimensions and
behaviours. As was the case with the previous Adriatic Sea Tourism Report, the final chapter has a special
focus. This year it concerns the Adriatic maritime tourism projects ongoing and recently approved. A double
ad-hoc survey of the nautical sector was conducted again this year in the first five months of 2019. It was
addressed to marinas and charter companies, and it highlights information relating to demand and supply
from a transnational viewpoint.
The Adriatic is an international space for which efforts are still required if it is to be fully recognised as a
brand and as a unique destination. Studies and analysis like this may contribute, but greater commitment both
from public and private operators is needed. The summary of data below should be sufficient to give an idea
of the unequivocal relevance that the Adriatic assumes in international geography and maritime tourism.
However, the overall results - even with an expected increase due to an overall positive outlook in 2019 - still
do not appear to be aligned with the potentials.

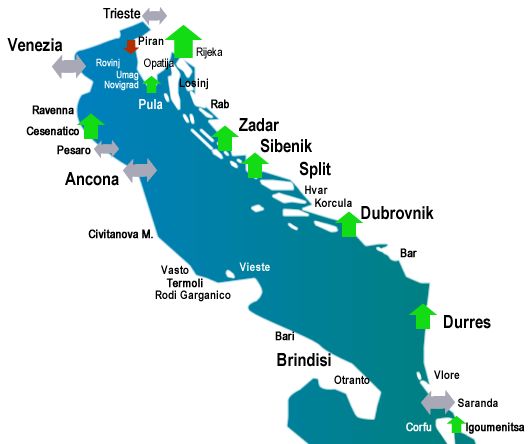
Maritime tourism in the Adriatic Sea in 2019 at a glance: Adriatic gates and routes
                                                                          more than 30 cruise ports
                                                                         5,16 million passenger movements
                                                                                and 3127 cruise calls

                                                                           more than 40 ferry ports
                                                                       over 19 million passengers, 6 of them
                                                                         travelling the international routes

                                                                                 332 structures
                                                                                for boat tourism
                                                                            more than 75,000 moorings

 Source: Risposte Turismo (2019), Adriatic Sea Tourism Report.
MARITIME TOURISM IN THE ADRIATIC SEA AND THE 2020 THRESHOLD - Adriaeco
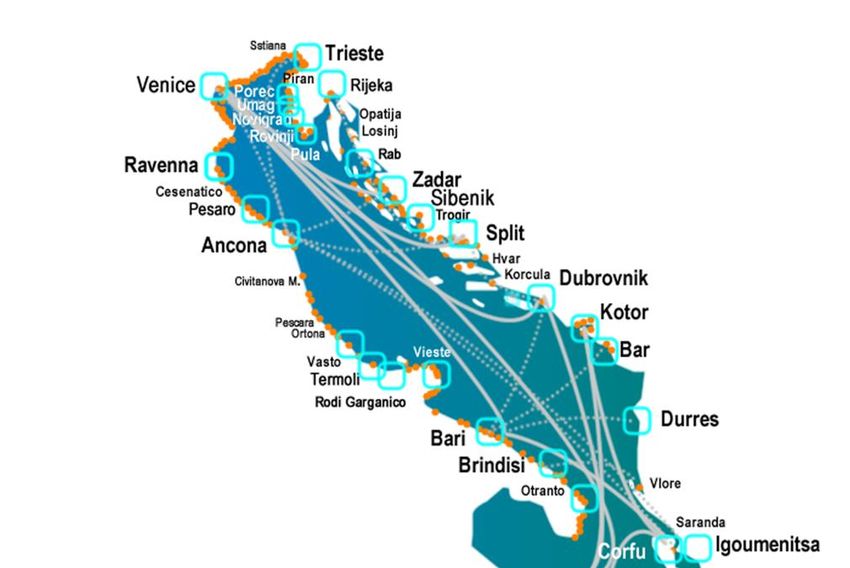
MARITIME TOURISM MOVEMENTS                                                                      MARKET CONCENTRATION
          IN ADRIATIC COUNTRIES                                                                                          (PORTS TRAFFIC)
    Cruise traffic by country, absolute values and share %, 2018                                   Concentration of cruise and ferry passenger movements
            PORTS                          2018                  Share % on total                                   in Adriatic ports, 2018
            Country                  Pax. mov. Calls             Pax. mov. Calls
          ITALY*                      2,420,333          978       46.9%         31.3%                             58,7%                                51,2%
         CROATIA                      1,300,845         1,180      25.2%         37.7%               15,0%
                                                                                                                                          21,7%
        GREECE*                        737,479           415       14.3%         13.3%
      MONTENEGRO                       514,948           427       10.0%         13.7%
                                                                                                        CRUISE                                   FERRY
        SLOVENIA                       101,415           75        2.0%          2.4%
                                                                                                      20,6%                                    15,6%
         ALBANIA                       84,815            52        1.6%          1.6%
   BOSNIA-HERZEGOVINA                     0               0        0.0%          0.0%
         TOTAL 2018                  5,159,835       3,127         100%          100%                          First 3       (4°5°)      (6°-10°)       Others

Note (*): both for Italy and Greece, only their Adriatic ports are considered.
                                                                                                         ADRIATIC SEASONALITY
     Ferry, hydrofoil and fast catamaran passenger movements                              Monthly share of cruise and ferry passenger movements and cruise
           by country, absolute values and share %, 2018                                         and ferry calls of Adriatic cruise and ferry ports, 2018
             PORTS                          2018                  Share % on total         25%
                                                                                                               Cruise Pax. movements
             Country                  Pax. mov.  Calls            Pax. mov. Calls                              Cruise calls
          CROATIA                     9,560,814         46,433     48.4%          50.9%                        Ferry pax movements                  21,3%
                                                                                           20%
                                                                                                               Ferry ship calls
         GREECE **                    5,394,028         33,765     27.3%          37.0%
          ITALY **                    3,292,455         7,302      16.7%          8.0%     15%
                                                                                                                                 15,8%
          ALBANIA                     1,487,568         3,525      7.5%           3.9%
         SLOVENIA                      14,850            120       0.1%           0.1%
                                                                                           10%
       MONTENEGRO                        n.a.            n.a.       n.a.           n.a.
    BOSNIA-HERZEGOVINA                    0               0         0.0            0.0
                                                                                            5%
          TOTAL 2018                19,749,715 91,145              100%           100%
Notes: Where not available, some values (pax. movements or calls) were estimated
with multi-year dataset trend; (*): for Italy only the Adriatic ports were considered,      0%
for Greece only Corfu, Igoumenitsa and Patras.                                                       Jan Feb Mar Apr May Jun Jul Aug Sept Oct Nov Dec

 Values and shares of berths and structures in Adriatic by country, 2019                           BOATING CLIENTS IN ADRIATIC
                            Berths      Structures   Avg. berths                            Distribution of the type of clients of the sample* of marinas,
                        value % share value % share per structure**                                    2014, 2017, 2018 and forecasts, 2019
 ITALY*                 49,186     65.5%       186        56.0%            264              100%
                                                                                            90%
 CROATIA                17,459     23.3%       125        37.7%            140              80%
                                                                                                                                                                 daily transits
                                                                                                                                                                 (clients in daily
 SLOVENIA               3,101      4.1%         8         2.4%             388              70%                                                                  transit) in one year

 MONTENEGRO             2,851      3.8%         8         2.4%             356              60%        79,2%             78,4%         78,2%         78,4%
                                                                                            50%                                                                  resident seasonal
 GREECE*                2,255      3.0%         4         1.2%             564              40%
                                                                                                                                                                 customers
                                                                                                                                                                 (summer)
 ALBANIA                 200       0.3%         1         0.3%             200              30%
                                                                                            20%
 BOSNIA-H.                 0       0.0%         0         0.0%             n.a.                         7,6%              7,6%          7,7%          7,9%       resident customers
                                                                                            10%                                                                  in one year (12
                                                                                                       13,2%             14,0%         14,1%         13,7%
 TOTAL                  75,052     100%        332        100%             226               0%                                                                  months)
                                                                                                       2014              2017          2018          2019
Notes: (*) both for Italy and Greece, only their Adriatic ports were considered;
(**) the values are rounded either up or down to whole numbers.

 Berths, structures and the average of berths                                               The distribution of the itineraries chosen by the charter companies
   per structure in the Adriatic areas, 2019                                              customers of the sample* among the 4 areas of the Adriatic Sea, 2019
              Berths Structures Avg. berths
              % share % share per structure
 NORTH          57.7%         58.7%               222
 CENTRE         19.5%         19.3%               229
 SOUTH          22.8%         22.0%               234
               100%           100%                226

                                                                                             Note: (*) the 2019 panel count on 49 marinas and 19 charter companies
MARITIME TOURISM IN THE ADRIATIC SEA AND THE 2020 THRESHOLD - Adriaeco
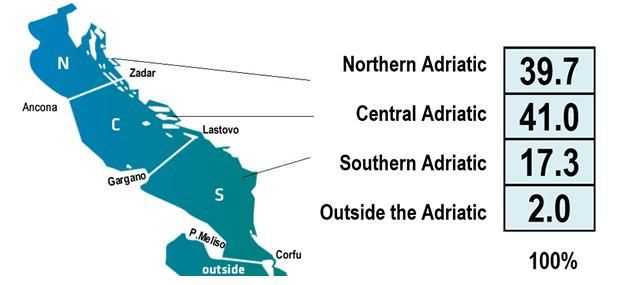
2019 CRUISE FORECASTS                                                    Variations 2019 on 2018
                    Pax. mov.             Calls            % Pax. mov.                 % Calls            Abs. Pax             Abs. Calls
Venice              1,560,579             502                     stable                stable              stable               stable
Corfu
Dubrovnik
                     787,389
                     745,815
                                          416
                                          475
                                                                  7.0%
                                                                  1.8%
                                                                                         0.7%
                                                                                         8.4%
                                                                                                            51,557
                                                                                                            13,384
                                                                                                                                    3
                                                                                                                                   37                 +7.3% on 2018
Kotor
Bari
Split
                     638,572
                     610,000
                     337,042
                                          519
                                          233
                                          292
                                                                  29.7%
                                                                  6.5%
                                                                  9.7%
                                                                                       26.3%
                                                                                         9.4%
                                                                                       12.3%
                                                                                                           146,097
                                                                                                            37,094
                                                                                                            29,903
                                                                                                                                  108
                                                                                                                                   20
                                                                                                                                   32
                                                                                                                                                      +7.2% on 2018
                                                                                                                                                      Notes: forecasts on passenger
Zadar                182,214              142                     9.4%                   6.8%               15,686                  9                 movements are based on 23 ports
Sarande              120,000              65                      53.3%                54.8%                41,718                 23                 data (representing the 99.7% of the
Brindisi             110,000              45                      5.3%                  -2.2%                5,572                 -1                 total passengers and 99.3% of cruise
Koper                102,400              69                      1.0%                  -8.0%                 985                  -6                 calls registered in 2018)
Trieste              100,000              63                      7.7%                 10.5%                 7,152                  6
Ancona               92,100               46                      37.4%                15.0%                25,069                  6
Rijeka               46,427               27                     325.4%                145.5%               35,514                 16
Bar                  23,000               17                      2.3%                   6.6%                 527                   1
Sibenik              20,823               99                     -41.7%                 -9.2%              -14,906                -10
Korcula              16,363               95                     -23.4%                -23.4%               -4,995                -29
Durres               13,100               20                     100.5%                100.0%                6,567                 10
Ravenna              11,720               34                     -35.1%                 -2.9%               -6,348                 -1
Rovinj               11,388               60                      0.0%                  -7.7%                  0                   -5
Pula                  3,200               26                      16.6%                  0.0%                 441                   0
     2019 FERRY FORECASTS

                                                                                          Half of the Adriatic ports provided forecast for           Anyway, with the positive or negative
                                                                                          2019 but some of the major ports are missing:              variations previously presented, and
                                                                                          this is the reason why it is difficult to make             with several ports that foresee a certain
                                                                                          forecasts on the overall ferry traffic in the              stability, it is reasonable to expect that
                                                                                          Adriatic. Moreover, this kind of traffic is highly         this sector won’t register relevant
                                                                                          dependent on external factors, such as                     variation.
                                                                                          weather, petrol costs and travel alternatives.

                 Variations in clientele of interviewed marinas in Adriatic, 2018/2017 and 2019/2018
                                               decrease                                                                  decrease
                                                 11%                                                                       4%

                                                                                  increase                                                               increase
                                                            variation               32%                                             forecasts              37%
                                       stability            2018/2017                                                               2019/2018
                                         57%                                                                       stability
                                                                                                                     59%

                                          0%       20%     40%       60%    80%        100%                        0%      20%      40%     60%       80%       100%

                          homebased                                                                homebased
            Domestic
       (same country) regular transit                                                            regular transit                                                    Domestic
                                                                                                                                                                    (same country)
                     occasional transit                                                       occasional transit
                          homebased                                                                homebased
        International   regular transit                                                          regular transit                                                    International
                     occasional transit                                                       occasional transit

        Variations in clientele of interviewed charter companies in Adriatic, 2018/2017 and 2019/2018

                            decrease                stability
                              23%                     46%                                                                            decrease
                                                                                                                                                        stability                decrease
                                                                            decrease                                                   13%
                                                                                                                                                          62%                      13%
                                                                               8%

     stability     variation                                    variation                                                variation        increase
                                                                                                                                                                    variation
                                                                                                          stability                         12%
       54%         2018/2017      increase                      2019/2018                                   75%          2018/2017                                  2019/2018        increase
                                    23%                                       increase                                                                                                 25%
                                                                                46%
MARITIME TOURISM IN THE ADRIATIC SEA AND THE 2020 THRESHOLD - Adriaeco
CRUISE AND FERRY PASSENGERS BRINGS ECONOMIC BENEFITS
Risposte Turismo estimates that the cruise tourists spent in 2018 more than 362 Million euro in Adriatic destinations,
considering not only the 1.78 million cruisers that embarked or disembarked in one of the ports of the region but
also the 3.356 million cruisers who visited other ports along their itineraries. This value does not take into account
crew expenditures onshore (approximately an additional 14 Million euro over the year) and the impact of the
extended cruise industry (ships, ports, suppliers, and so on). This is therefore an amount limited to the cruisers’
expenditures on shore. Risposte Turismo estimates that direct expenditures on shore by ferry passengers in the
Adriatic and only on international routes reached 60 Million euro in 2018. Furthermore it should be considered that
the entire ferry industry and tourism guarantees a much higher economic impact when other kinds of expenditures
are considered (once again, for these industry, ships, ports, crews, suppliers and so on).
Considering just the expenditures of tourists/passengers on shore moving through the two components
of maritime tourism in Adriatic, cruise and ferry - accounted for more than 420 Million euro in 2018,
but the economic impact of these two sectors (cruise & ferry) in the area is indeed much higher, considering the
fact that tourists’ direct expenditures are just a part of the overall contribution to the Adriatic economy.

EUROPEAN PROGRAMMES, PROJECTS AND THE ADRIATIC MARITIME TOURISM
From the point of view of organizing and fostering the tourism supply side, our company believes that the
Adriatic Sea merits yet more attention and commitment as one of the pillars of the ASF project as a whole.
When the first Adriatic Sea Forum took place, the EU Strategy for the Adriatic and Ionian region had not yet
been adopted. However, in 2013 the Europe 2020 agenda, the 10-year plan, was already in effect and was
used as a reference framework for all the activities at EU and national and regional levels. Approaching the
end of the 2014-2020 programming period, EUSAIR Strategy hasn't had − and will not have − its own funds,
but cooperation programmes of cooperation of the area funded and supported projects with activities and
aims that are in line with EUSAIR activities and aims. Adriatic regions are eligible in many programmes: from
the latest IPA CBC Italy-Albania-Montenegro and on to Italy-Croatia, Italy-Slovenia, ADRION or Interreg MED
and others.
In the Adriatic Sea Tourism Report 2019 itself, we analyse all these programmes, highlighting the more
relevant projects for stakeholders operating in maritime tourism in Adriatic. The overall budget of all the
selected projects is 19.5 million euro. This significant economic value should boost the three sectors and, more
in general, the maritime tourism economy and jobs, if the expected objectives are achieved. The topics
targeted by the approved projects are described in the full report. Some of these topics are as follows: cruise
and ferry homeports integration for various modes of transport, especially regional airports in peak seasons;
development of sustainable urban mobility plans and mitigation of the impact that cruise ships related
traffic has on cities, to enhance the quality of life of inhabitants and passengers; development of a common
model and plans for the enhancement of nautical tourism in 21 small and medium-sized ports; promotion
of sustainable tourism and blue growth in the program area through turning the important maritime cultural
heritage of 8 Adriatic Italian and Croatian ports to best account; the maritime production cluster (including
the shipbuilding area), interaction gaps; and more sustainable and greener shipbuilding.
The overall impression is that, even with concerted efforts on the part of the joint secretariats to attain higher
cost efficiency (in particular, leakages in dissemination and promotion activities) and new networking
opportunities, project partners differ in their views on priorities. Compared to the project aims, the activities
carried out focus on narrow and local scopes and do not impact the framework in the mid-term.
MARITIME TOURISM IN THE ADRIATIC SEA AND THE 2020 THRESHOLD - Adriaeco MARITIME TOURISM IN THE ADRIATIC SEA AND THE 2020 THRESHOLD - Adriaeco
You can also read