National E3 Webinar Summit March 6, 2013
←
→
Page content transcription
If your browser does not render page correctly, please read the page content below
National E3 Webinar
      Summit
  March 6, 2013

                      1
WELCOME

            Lee Mazzocchi                           Matt Bogoshian
SVP, Chief Integration and Innovation      U.S. EPA's Senior Policy Counsel,
                Officer                 Office of Chemical Safety and Pollution
                                                      Prevention

                                                                              2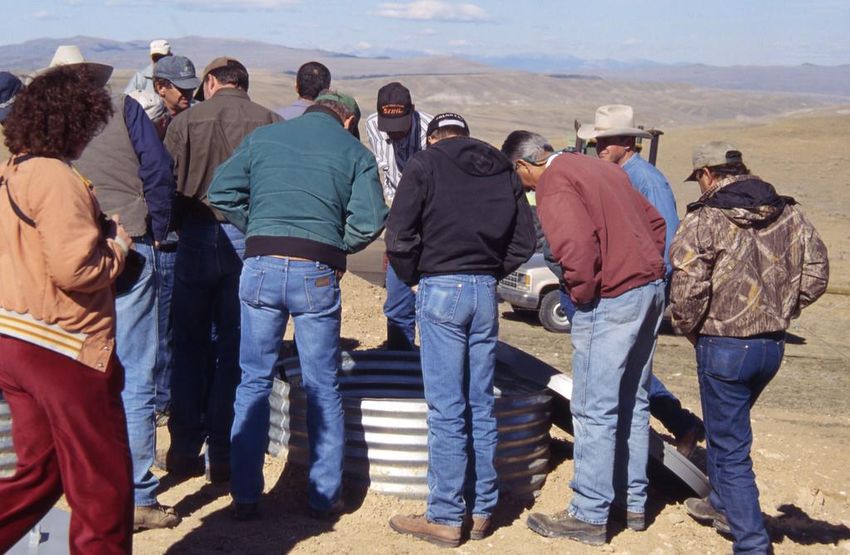
Making E3 Financially Sustainable:
  Current Funding and Future
            Options

                                     3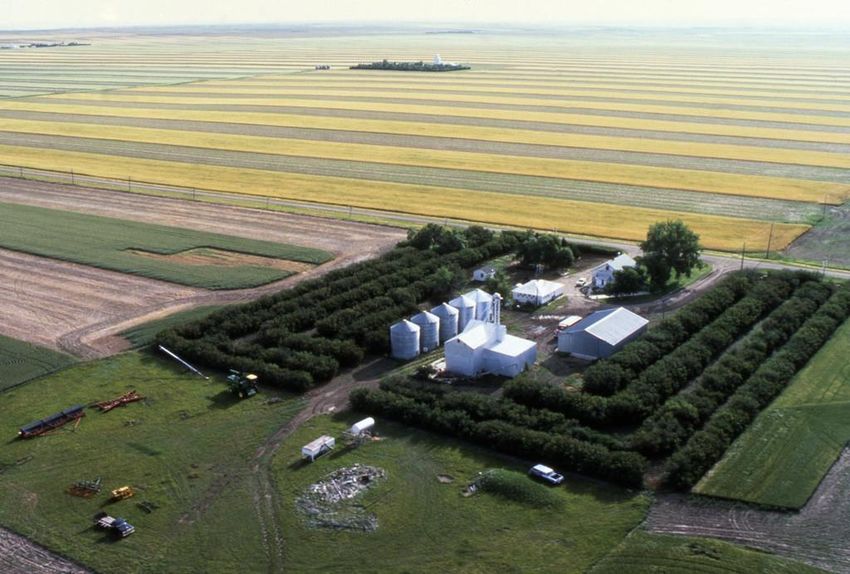
Making E3 Financially Sustainable:
               Current Funding and Future Options

• Historical Funding Process
  – State Steering Committee Formation/Charter
  – Identification of Assessment Suite Sources
     • Assessment Costs
        – Base triple assessment suite $15,000 to $25,000
     • Promotional Costs
        – $10,000 to $20,000 per year
     • Administrative Overhead/Implementation Follow-up
        – 1 – 2 FTE’s + Significant in-kind from partners
     • Implementation

                                                            4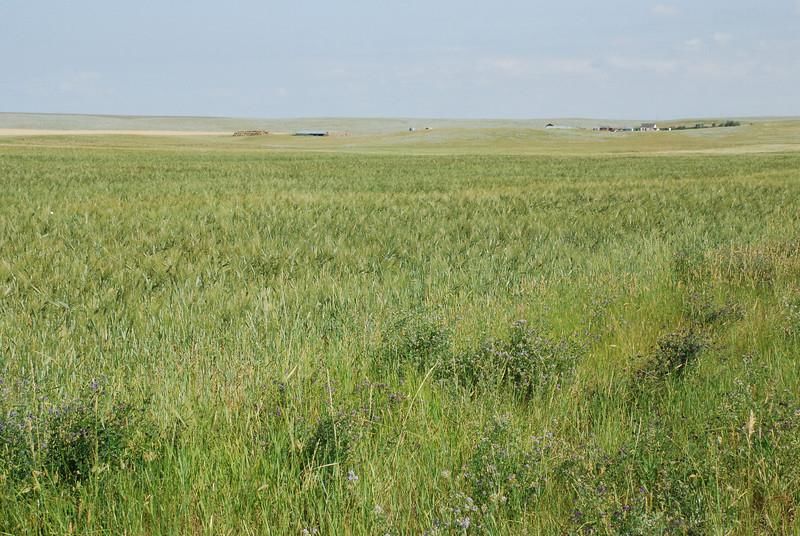
Making E3 Financially Sustainable:
                Current Funding and Future Options
• Historical Funding Process (cont.)
  – Search for Funding Sources
     • Grants
        –   EPA – Waste Reduction
        –   Rural Development
        –   Economic Development
        –   Stimulus
     • Prefunded government programs
        – State Environmental P2
        – Industrial Assessment Centers
        – MEP Lean Programs

                                                     5
Making E3 Financially Sustainable:
              Current Funding and Future Options

• Historical Funding Process (cont.)
  – Search for funding Sources
     • Utility Energy Efficiency Programs
     • Private Foundations
     • Client Contribution

                                                   6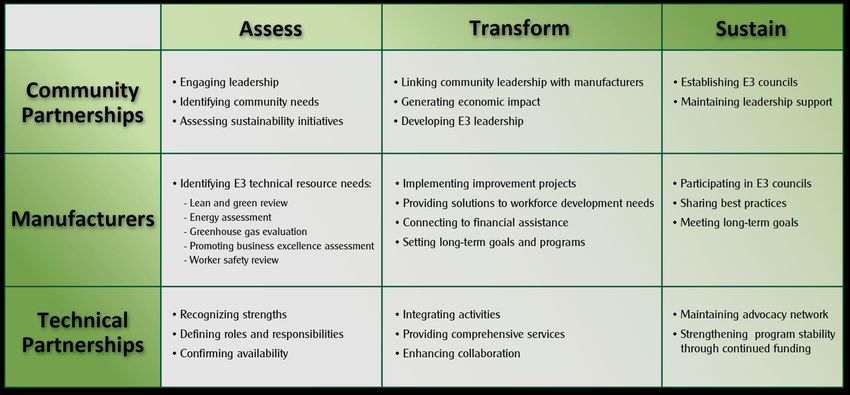
Making E3 Financially Sustainable:
                Current Funding and Future Options

• Problems with Historical Model
  – Myriad Sources
     • Patchwork of multilateral agreements.
     • Incompatible restrictions and covenants.
        –   Economically depressed
        –   Small or medium business
        –   Rural
        –   Energy Efficiency only
        –   P2 only

                                                     7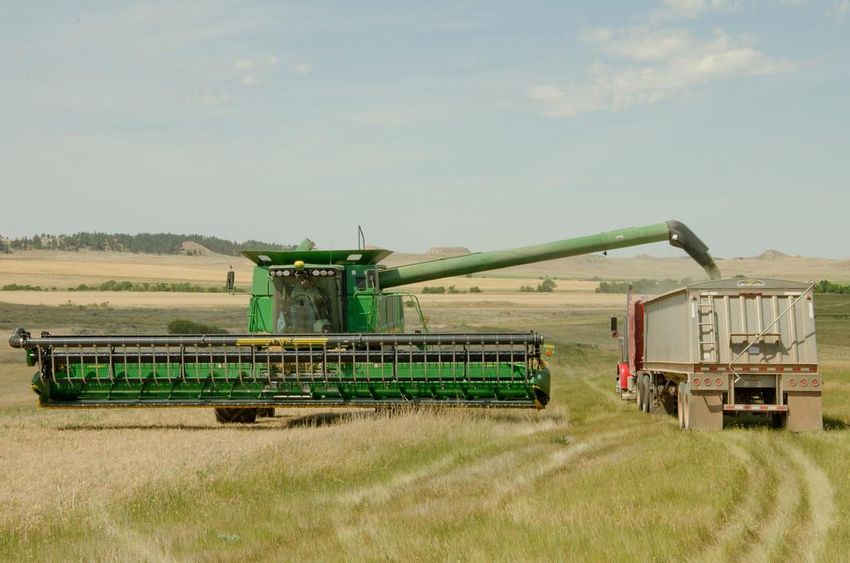
Making E3 Financially Sustainable:
             Current Funding and Future Options

• Problems with Historical Model (cont.)
  – Inconsistent objectives and reporting
    requirements.
  – Misalignment of covered regions with service
    territories of active partners.
  – Misalignment of grant/benefactor objectives with
    partner missions and E3 Charter.
  – Insufficient $ to support dedicated resource over a
    meaningful time horizon.

                                                      8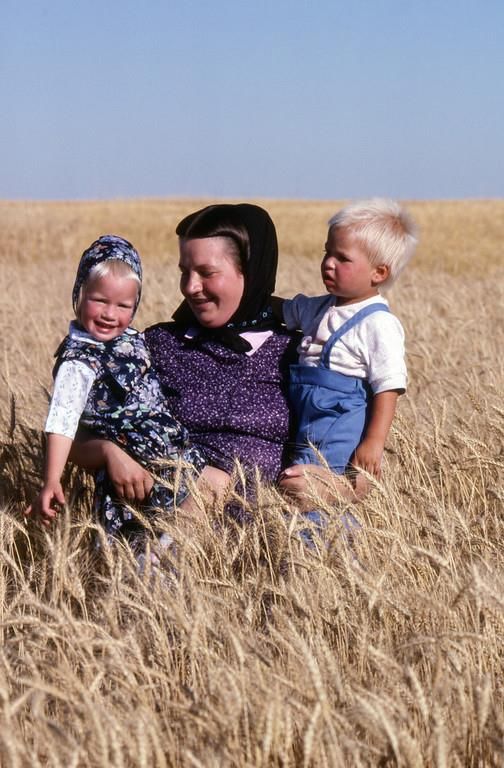
Making E3 Financially Sustainable:
                Current Funding and Future Options

• Problems with Historical Model (cont.)
  – Time bounded: limits investment in strategic long
    range planning.
  – No standards for effective use of $
     •   Client qualification
     •   Level of subsidy
     •   Qualification of technical assessors
     •   Client deliverables
     •   Assessor collaboration requirements

                                                        9
Making E3 Financially Sustainable:
             Current Funding and Future Options

• Today
  – Each client opportunity requires a custom funding
    solution.
• Future Vision
  – National Dialogue on Sustainable E3 Funding.
  – Cross functional team approach.
  – Public/Private Partners committed to the process.
  – Consistent and reliable funding solution

                                                    10
Making E3 Financially Sustainable:
Current Funding and Future Options
• Future Solution Should Address
– What should be funded
• Promotion
• Technical Assessments
– Energy, Waste Minimization, LEAN --- Other?
– At what subsidy level and for how long.
• Post Assessment Follow-up/Reporting
• Administrative overhead.
– Cost effective sourcing of services.
– Commitment of funding sources.
11Making E3 Financially Sustainable:
Current Funding and Future Options
• Other considerations
– Service level requirements for funding eligibility
– Common, efficient application process
– Needs analysis
– Formula designs
– Market maturity impacts
– Performance based
– What should not be funded (eg. implementation)
12Making E3 Financially Sustainable:
Current Funding and Future Options
• Input from Regional Teams
• Input from Federal Partners
• Conclusions and Path Forward
13Peaks to Prairies Pollution Prevention
Information Center – Myla Kelly
• Regional P2Rx center for EPA’s Region 8
www.peakstoprairies.org
• Located at Montana State University in Bozeman
• Part of Housing and Environmental Health Dept in Extension
• Also coordinate the nationwide Tribal P2 workgroup
www.tribalp2.org and Greening Local Government Initiative
for Region 8 www.greenlocalgovernment.org
14E3 in Montana Agriculture
• Initial discussions began in spring 2012
• Oct 2012 EPA Region 8 awarded Peaks to Prairies a Source
Reduction Grant of $110,626
• Objective: Through hands-on E3 assessments we work with
our agricultural community to reduce energy consumption,
increase productivity, minimize carbon emissions, prevent
pollution, & drive innovation.
• Fall 2012 filled with a series of phone and personal meetings
to discuss partnership opportunities with potential
stakeholders
15E3 in Montana Agriculture
GOAL
• Our goal is to ensure that by participating in E3, we have put
our agricultural producers in the best position possible to
maximize available financial opportunities in order to
implement E3 recommendations.
What is the highest bar?
16How do we make it happen…
1. We need access to farmers’ land
2. We need lots of boots on the ground
3. Farmers need to tell farmers that this is a
worthwhile process
17Access – it is a trust issue
• Reminder: Farms now have less than six
months to prepare or amend and implement
their Spill Prevention, Control, and
Countermeasure (SPCC) Plans. The
compliance date for farms is May 10, 2013.
• DOL Youth Farm Labor Proposal
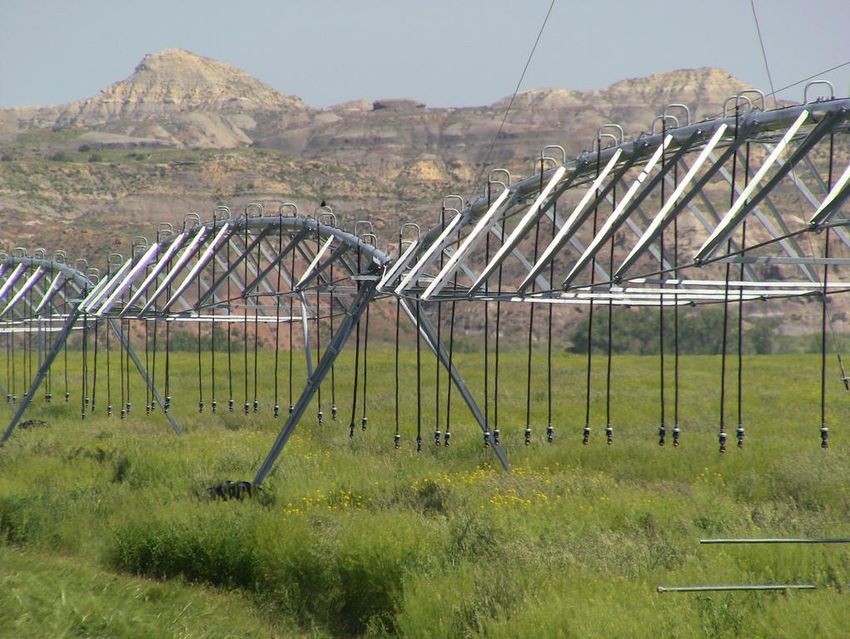
18Photos Courtesy of USDA NRCS
1920
Partnerships
Cooperative Extension Service, USDA
         Montana State University Extension – Professionals in each county
   of the state are in place to help Montana agricultural producers and land
   owners increase profits, reduce loss, protect our food supply and sustain
   future resources. They have an established trust relationship with
   producers and are essential in:
1. Finding producers willing to participate in an E3 assessment
2. Communicating the benefits of an E3 assessment and subsequent
    implementation of recommendations, and
3. Communicating successful outcomes to other producers in the state.

                                                                               21
Natural Resource Conservation Services (NRCS) - NRCS conservationists work
on agricultural land through field offices that serve every county in the
state.
1. NRCS has developed numerous technical tools such as the Cropland
Energy Estimator that will be important in calculating many of the E3
metrics.
2. NRCS also has funding sources such as the Environmental Quality
Incentives Program (EQIP). This is our highest bar, so we must ensure our
assessments are compliant with EQIP technical service provider
requirements.
22Rural Development (RD) – Montana (Region 8) is almost entirely a rural state
and the mission of RD is to improve the quality of life for rural Montanans.
The grants and loan opportunities that RD has available for agricultural
producers include:
• Renewable Energy for America (REAP) program,
• Value added producer grants, and
• Loan guarantee programs.
Farm Services Agency (FSA) – FSA makes guarantee loans to family farmers
and ranchers to promote, build, and sustain family farms in support of a
thriving agricultural economy.
• Guaranteed Conservation Loan - provides a maximum loan amount of over
a million dollars to implement any conservation practice in an NRCS
approved conservation plan.
23Photo Courtesy of USDA NRCS
24Photo Courtesy of USDA NRCS
25Photos Courtesy of USDA NRCS
26Back to making it happen
We need access to farmers’ land
We need lots of boots on the ground
• Farmers need to tell farmers that this is a
worthwhile process
27Photos Courtesy of USDA NRCS
Myla Kelly, Coordinator Peaks to Prairies at Montana State University
myla.kelly@montana.edu 406-994-6948 28Questions for Participants
1. With regard to the base suite of E3 Assessments
(Environment, Energy, Economy) what is the appropriate level
of overall subsidy? (What percentage should the client pay?)
– a. Pilot Stage
– b. Long run
2. What is the most appropriate source of funds or combination
of sources to sustain the E3 initiative?
3. Describe the ideal process to secure funds for an E3 client
engagement.
29Generation and Engagement of
Clients
30Wisconsin Programs
Profitable Sustainability
Initiative (PSI) Milwaukee E3 (ME3)
• PSI – April 2010 • ME3 – December 2010
– State wide (unofficial E3) – City of Milwaukee
– 93 participants to date – 20 participants to date
– Add 32+ in 2013 – Add 5 to 7 in 2013
– $3,600,000 funding to date – Blended PSI & E3
– $400,000 funding to date
31WI Engagement Model
OECD Indicator Based
Implementation Diagnostic
Up to: $10,000 $3,000
25% Match No Match
Assessment
$12,000
No Match
32PSI/ME3 Participation
180
160 161
140
120
98 113
100 Companies
75
80 85
60 Projects To
Date
40 50
20
0
2010 2011 2012Investment & Annualized Savings
$18.0
$16.0
$16.0
$14.0
$13.3
$12.0
$10.0 M$ Saved To Date
$8.0 $6.4 M$ Invested To Date
$6.0 $4.1 $5.9
$4.0
$2.0 $3.6
$0.0
2010 2011 2012Average Project
$120,000
$99,378
$100,000
$80,000 $82,608
$65,306
$60,000 $54,667 Avg Project $
$60,204 Saved
$40,000 $48,000 Avg Project $
Invested
$20,000
$0
2010 2011 2012Annual Revenue Growth
(Millions)
$18.0
$16.0
$15.8
$14.0
$12.0
$10.0
$9.0
$8.0
$6.0
$4.0 $4.7
$2.0
$0.0
2010 2011 2012PSI/ME3 Jobs Created
500
400
300
Direct
200 Indirect
100
0
2010 2011 2012
37Reduction in Annual Electrical Use
10,000,000
9,000,000 9,300,000
8,000,000
7,000,000
6,000,000
5,000,000
Reduced kWh
4,000,000 4,100,000
3,000,000 3,600,000
2,000,000
1,000,000
0
2010 2011 2012Annual GHG Reduction
7,000
6,421
6,000
5,000
4,000 Metric Tons
3,000 3,034
2,000 2,540
1,000
0
2010 2011 2012Annual Solid Waste Elimination
10,000
9,000 8,997
8,000 8,931
7,000
6,000
5,000 Tons
4,000
3,000
2,000 2,249
1,000
0
2010 2011 2012PSI & ME3 in Wisconsin To Assume WI is Scalable & $36M Fed +
Category/Benefit to Funding Ratio Date $36M States are Invested
Public Funding $4,000,000 $72,000,000
Participant Private Capital Investment $13,300,000 $239,400,000
Private Capital Investment per Dollar of Public Funding 3.33 3.33
Annual Realized Savings (Impact) $16,000,000 $288,000,000.00
Savings Realized per Dollar of Public Funding 4.00 4.00
Annual Realized Revenue Increase $15,800,000 $284,400,000.00
Increased Revenue per Dollar of Public Funding 3.95 3.95
Jobs Created 486.00 8,748
Jobs per Dollar of Public Funding 0.00012 0.00012
Annual Realized Electrical Reduction (kWh) 9,300,000 167,400,000
Reduction in kWH per Dollar of Public Funding 2.33 2.33
Projected outcomes are extrapolated based on WI experience to date. Calculations assume blended model is scalable and federal funding is used to leverage state funds.
Provide federal funds to any state willing to match dollar for dollar. Cap the amount available or let the states determine their investment and match that amount. Will need
to monitor (audit) performance @ some predetermined frequency.
Deployment of $36 M in federal funding will result in projects with 3,000 manufacturers and provide 3 years of state support to build out and develop E3 communities.
41For more information:
www.wmep.org
bertram@wmep.org
42E3: Strengthening Manufacturing in
North Carolina
Through Sustainable, Best Business PracticesE3: Economy, Energy, and the Environment
E3 is an innovative, community-based effort to
establish self-sustaining initiatives that
simultaneously increase the sustainable practices
and profitability of manufacturers.
44E3: Strengthening Manufacturing in
North Carolina
200+ partners
20 communities
39 manufacturers
150+ technical assessments
300+ workers trained
45Real Impact
$16.9 million in discovered savings
$15 million in economic impact
$9.2 million in realized savings
67 North Carolina jobs (4 manufacturers)
46E3 North Carolina
Framework for Impact
Assess Transform Sustain
47E3 Monroe: Local Team Effort
Community Team:
Keys to Success:
Local Leadership
Team trust and by-in
Leverage partner relationships
Strategic conversations
Sustain relationships
Learn and adapt
48Technical Assessments
• Business Excellence Assessment
• Lean and Green Review
• Energy Systems Assessment
• Greenhouse Gas Evaluation
• Worker Safety Review
49Transformation Support
• Executive summary report
• Incorporating partner resources
• Aligning incentives and grants
• Recommended implementation plan and ROI
• Fostering a long-term relationship
50Sustaining Impact
• Establishing an industry advocate team
• Creating local manufacturing council
• Access to additional technical resources
51Economic Ripple E3 Project
Effect Implementation
Strengthened
E3 Improved
Retention, Expansion, Engagement, Efficiencies,
& Marketing Strategy Productivity & Profitability
Best Practice Sharing
& Sustainability Council
52E3 NC Contact -
http://e3.ies.ncsu.edu/
Anna Mangum
Lead, E3 North Carolina
NC State University
Industrial Extension Service
919-210-6050
anna_mangum@ncsu.edu
53Standardizing Metrics and Tools
54E3 Evaluation & Metrics
Goal: Demonstrate efficacy of E3 technical assessments
as strategic manufacturing “intervention”
Standardize metric collection process within an E3
team.
Communicate metrics responsibilities across E3
team AND with E3 clients.
Include quantitative and qualitative results in
reporting.
Focus on lessons learned to help improve deliver
of E3 services.
3Understanding what E3 teams are doing How many E3 teams follow up with the client post NIST survey? No follow up 60 days? 90 days? 180 days? >180 days? How do you follow up with E3 clients post NIST survey? Involves formal tracking Informal email, phone, or face to face contact On average, how would you rate how responsive are E3 clients to post NIST follow up? Rarely responsive Somewhat responsive Very responsive To what extent does the NIST survey meet the needs of your E3 team? Limited extent—does not adequately meet information needs Adequately meets the information needs Greatly exceeds information needs 6
Continuing Today’s Conversation
- Need for additional webinars? Topics?
- Volunteers for E3 Discussion Workgroups focusing on today’s
  panel topics:
   –   Strategies to yield high implementation rates
   –   Program management structures
   –   Partnership development
   –   Business model development
   –   Opportunities for further collaboration
   –   Technical services and delivery models
- Please send names and ideas forward to Kelly Wedell:
  wedell.kelly@epa.gov

                                                                57
You can also read