Need for the Project - Brisbane Airport
←
→
Page content transcription
If your browser does not render page correctly, please read the page content below
VOLUME A: BACKGROUND AND NEED

A2   Need for the Project

           NEW PARALLEL RUNWAY DRAFT EIS/MDP
                                               A2-39
                  FOR PUBLIC COMMENT
VOLUME A: BACKGROUND AND NEED

        A2                Need for the Project

        CONTENTS                                            2.8   Economic Characteristics                 70
                                                                  2.8.1   Effect of the New Parallel Runway 70
        2.1   Introduction                            45
                                                                  2.8.2   Socio-Economic Characteristics   70
        2.2   Overview of Forecasts                   45          2.8.3   Current Economic Structure       71
        2.3   Passenger Demand                        46          2.8.4   Projected Population Growth
              2.3.1   Historical Trends in                                and Labour Force                 73
                      Passenger Demand                46          2.8.5   Projected Economic Structure     74
              2.3.2   Annual Passenger                      2.9   Economic Assessment Methodology          75
                      Forecasting Methodology         47
                                                                  2.9.1   Overview of Methodology          75
              2.3.3   Forecast Passenger Demand       48
                                                                  2.9.2   Financial Modelling              76
        2.4   Aircraft Movements                      48
                                                                  2.9.3   Air Transport Sector Modelling   76
              2.4.1   Historical Trends in
                      Aircraft Movements              48          2.9.4   General Equilibrium Modelling    76

              2.4.2   Freight and General Aviation    49          2.9.5   Cost Benefit Analysis             77

              2.4.3   Annual Aircraft Movement              2.10 Direct Economic Impacts of the
                      Forecasting Methodology         50         NPR - Financial Modelling                 77
              2.4.4   Forecast Aircraft Movements     51          2.10.1 Project Characteristics and
                                                                         Construction Costs                77
        2.5   Daily Profile                            52
                                                                  2.10.2 Passenger Forecasts               78
              2.5.1   Busy Day Profiles                54
                                                                  2.10.3 Revenues and Operating Costs      79
              2.5.2   Busy Day Profile
                      Forecasting Methodology         56    2.11 Direct Economic Impacts of the
                                                                 NPR - Air Transport Sector                80
              2.5.3   Forecast Busy Day Profiles       56
                                                                  2.11.1 Effects of Congestion             80
        2.6   Capacity at Brisbane Airport            58
                                                                  2.11.2 Flight Demand Profile              80
              2.6.1   Existing Capacity               58
                                                                  2.11.3 Origin and Destination of
              2.6.2   Impacts on Travel Without                          Air Travellers                    81
                      New Parallel Runway             60
                                                                  2.11.4 Benefits to the Rest of Queensland
              2.6.3   Temporary Closure of                               and the Rest of Australia        81
                      14/32 Runway                    64
                                                                  2.11.5 Impact of Reducing Congestion     82
        2.7   Factors Affecting Forecasts             64
                                                            2.12 Economic Impacts                          82
              2.7.1   Sensitivity of Forecasts        64
                                                                  2.12.1 Multiplier Effects                82
              2.7.2   Population Growth               66
                                                                  2.12.2 Crowding Out
              2.7.3   Economic Outlook                67                 (Displacement Effects)            84
              2.7.4   Airline Costs and Fares         68          2.12.3 Australia Wide Economic Impacts 84
              2.7.5   Regulatory Environment          68    2.13 Property                                  86
              2.7.6   Comparison to 2003 Master                   2.13.1 Area Profile                       86
                      Plan Forecasts                  69
                                                                  2.13.2 Property Values                   86
              2.7.7   Key Assumptions                 70
                                                            2.14 Conclusions of Economic
                                                                 Assessment                                90

                                          NEW PARALLEL RUNWAY DRAFT EIS/MDP
A2-40                                            FOR PUBLIC COMMENT
VOLUME A: BACKGROUND AND NEED

A2              Need for the Project

FIGURES AND TABLES                                   Figure 2.12b: Projected Real Household
                                                                   Consumption-Welfare Net Present
Figures                                                            Value in 2006 ($ Million)

Figure 2.3a: Passenger Movements through             Figure 2.12c: Projected Real Household
             Brisbane Airport from 1996/97 to                      Consumption-Welfare Impacts
             2004/05                                               Against 2006 ($ Million)

Figure 2.4a: Monthly Aircraft Movements Brisbane     Figure 2.13a: Weighted Average House Price for
             Airport                                               All Suburbs Within 10 km of
                                                                   Brisbane Airport
Figure 2.4b: General Aviation (GA) Movements at
             Brisbane Airport 1991/92 to 2004/05     Figure 2.13b: Weighted Average House Price for
                                                                   Suburbs within Current N70 Noise
Figure 2.5a: Typical Busy Weekday Profile                           Contour
             Brisbane Airport June 2005
                                                     Figure 2.13c: Weighted Average House Price for
Figure 2.5b: Busy Weekday Profile for International                 Suburbs within 10 km of Brisbane
             and Domestic June 2005                                Airport and Outside Current N70
Figure 2.5c: Movement Profile by Hour, Selected                     Noise Contour
             Typical Days                            Figure 2.13d: Comparative Price Growth for
Figure 2.5d: Brisbane Movements – Arrivals by                      Suburbs within 10 km of Brisbane
             Hour – Forecasts                                      Airport

Figure 2.5e: Brisbane Movements – Departures by      Tables
             Hour – Forecasts
                                                     Table 2.2:    Summary of Existing and Forecast
Figure 2.5f: Brisbane Movements – Arrivals Plus                    Passenger and Aircraft Movements
             Departures by Hour – Forecasts
                                                     Table 2.3a:   Average Annual Percentage Growth
Figure 2.6a: Morning Peak Hour Runway Usage                        in Air Passengers
             (%) at Brisbane Airport June 2002 to
                                                     Table 2.3b:   Brisbane Airport Passenger Forecasts
             November 2005
                                                                   (‘000s Passengers) with New Parallel
Figure 2.7a: Central, High and Low Demand in                       Runway
             Evening Peak Hour (1800 hour)
                                                     Table 2.4a:   Aircraft Movements at Brisbane
Figure 2.7b: Annual Change (%) in Australian and                   Airport 1997 to 2005 (Years end 30
             OECD GDP, 1984/85 to 2004/05                          June)
Figure 2.7c: Comparison of Passenger Forecasts       Table 2.4b:   Key Assumptions for International
             with Master Plan 2003                                 Aircraft Movements
Figure 2.7d: Comparison of Aircraft Forecasts with   Table 2.4c:   Key Assumptions for Domestic
             Master Plan 2003                                      Aircraft Movements
Figure 2.8a: Profile of Employment by Industry,       Table 2.4d:   Brisbane Airport Aircraft Movement
             2006, Brisbane-Moreton and                            Forecasts (‘000s) with New Parallel
             Australia                                             Runway
Figure 2.8b: Projected Population Growth by          Table 2.5a:   Busiest Hours by Day
             Region
                                                     Table 2.5b:   Busiest Hours by Hour
Figure 2.8c: Projected Population, Labour Force
                                                     Table 2.6a:   Existing Agreed Arrival Rates for
             and Output Growth for Brisbane-
                                                                   Brisbane Airport
             Moreton
                                                     Table 2.6b:   TAAM Capacity for Existing Runway
Figure 2.8d: Profile of Employment by Industry,
                                                                   System at Brisbane Airport
             Brisbane-Moreton, 2006 and 2035
                                                     Table 2.6c:   Current Movements at Brisbane
Figure 2.12a: Projected Change in Key
                                                                   Airport and Available Capacity
              Macroeconomic Variable, Brisbane-
              Moreton ($ Million)

                               NEW PARALLEL RUNWAY DRAFT EIS/MDP
                                      FOR PUBLIC COMMENT                                                  A2-41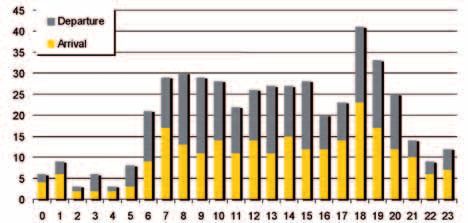
VOLUME A: BACKGROUND AND NEED

        A2                Need for the Project

        Table 2.6d:   Delay Results for 2005 Traffic
        Table 2.6e:   Delay Results for 2015 Traffic
                      (No New Parallel Runway)
        Table 2.6f:   Delay Results for 2035 Traffic
                      (No New Parallel Runway)
        Table 2.6g:   Aircraft Movement Impacts of
                      Capacity Constraints With No
                      Additional Runway
        Table 2.6h:   Passenger Movement Impacts of
                      Capacity Constraints With
                      No Additional Runway
        Table 2.6j:   Passenger Movement Impacts of
                      Capacity Constraints With
                      No Additional Runway
        Table 2.6k:   Delay Results for 2009 Traffic
        Table 2.7a:   Passenger Movement Forecasts for
                      Higher and Lower Cases
        Table 2.7b:   Aircraft Movement Forecasts for
                      Higher and Lower Cases
        Table 2.10:   Profile of the Source of Non-Labour
                      Costs During Investment, Nominal
                      $ Million
        Table 2.11a: Purpose of Trip, Domestic Air
                     Travellers
        Table 2.11b: Purpose of Trip at Brisbane Airport,
                     International Air Travellers
        Table 2.12a: Key Brisbane-Moreton
                     Macroeconomic Results From
                     Constructing NPR
        Table 2.12b: Key Brisbane-Moreton
                     Macroeconomic Results ($) From
                     Constructing NPR
        Table 2.13:   Comparison of Average Prices and
                      Annual Price Growth.

        APPENDICES

        Appendix 2.1: Detailed Socio-Economic Profiles
                      and Forecasts

                                        NEW PARALLEL RUNWAY DRAFT EIS/MDP
A2-42                                          FOR PUBLIC COMMENT
VOLUME A: BACKGROUND AND NEED

A2                Need for the Project

SUMMARY OF KEY FINDINGS

Aircraft and Passenger Demand

•   Brisbane Airport has experienced strong passenger growth of around 7.5 percent per annum over the
    15 years between 1989/90 and 2004/05.

•   Annual aircraft movements are forecast to grow from the existing (2005) 160,000 movements to 227,000
    in 2015 and 393,000 in 2035.

•   Annual passenger movements are forecast to grow from the existing (2005) 15.6 million movements to
    25.3 million in 2015 and 50.0 million in 2035.

•   The existing runway system has a modelled capacity of 59 movements (departures and arrivals) per
    hour. The existing busier peak hours have around 40 movements (departures and arrivals). Based on the
    forecasts of air travel growth, demand will exceed existing runway capacity around 2014.

•   If no additional runway capacity was added at Brisbane Airport, it is estimated that there would be a loss
    of around 35 percent of regular airline movements by 2035. This equates to an annual loss of around
    3.2 million international passengers and 8.8 million domestic passengers by 2035.

Economic Conditions

•   Tourism is a key driver of economic activity for the Brisbane-Moreton region. The region currently has a
    greater proportion of tourism-driven service industries such as retail trade, accommodation, cafes and
    restaurants, and cultural services, compared with the rest of Australia. Those industries, along with the
    property and business services sectors, are expected to continue to become more important over time,
    continuing to increase their share of the region’s employment.

•   The relatively stronger emphasis on tourism over time highlights the importance of having the appropriate
    infrastructure in place in order to facilitate such growth.

•   The Brisbane-Moreton region is also expected to experience more rapid population and economic growth
    than Australia as a whole will experience over the next 30 years, with population growth at around twice
    the national average.

Economic Assessment Methodology

•   The economic assessment considers a future growth path for the Brisbane-Moreton, Queensland and
    Australian economies in an ‘unconstrained world’, then overlays on this the constraints to growth that
    would occur if the New Parallel Runway (NPR) were not developed.

•   The key elements to the economic impact assessment methodology are analysis of the direct costs and
    benefits of the NPR using financial modelling and modelling of the air transport sector for the impact on
    airlines and passengers, and analysis of the economy-wide impacts of the NPR using general equilibrium
    modelling – this assesses the indirect economic impacts, including any crowding out (displacement) effects.

Direct Impacts

•   The cost estimates put the construction cost of the NPR at just over $970 Million (in nominal dollars
    allowing for inflation). Construction takes place over the period from 2008 to 2015.

•   The key benefits of the project come from avoiding constraints. Given the role of the airport in facilitating
    tourism to the Brisbane-Moreton region, the loss of passengers resulting from not providing additional
    runway capacity represents not only a loss of passengers for the airport and airlines, but a loss of other
    tourist spending which would otherwise have occurred. The loss of 3.2 million international passengers
    and 8.8 million domestic passengers equates to a direct loss of just under $5 Billion per annum in
    passenger spending in the wider economy (in today’s dollars).

                                  NEW PARALLEL RUNWAY DRAFT EIS/MDP
                                         FOR PUBLIC COMMENT                                                        A2-43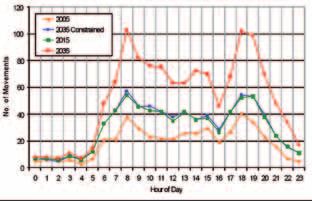
VOLUME A: BACKGROUND AND NEED

        A2                  Need for the Project

        Economy-Wide Impacts

        •   Allowing more passengers through Brisbane Airport means more economic activity for the Brisbane-
            Moreton region. The region’s output (as measured by Gross Regional Product or GRP) will be
            permanently higher. The net present value of the output gain (increase in GRP) is projected to be
            $4.8 Billion over the period 2006 to 2035 using a 4 percent real discount rate.

        •   The best measure of overall economic benefit or living standards is the increase in real private
            consumption which occurs – the ability of people to spend more. The net present value of the increase
            in economic benefit (increase in real private consumption) is projected to be just over $8.2 Billion over the
            period 2006 to 2035 using a 4 percent real discount rate.

        •   Significant economic benefits also accrue to the rest of Queensland and the rest of Australia, by ensuring
            that Brisbane remains accessible and uncongested for people living in these regions. The net present
            value of economic benefits to the rest of Queensland is estimated at $1.1 Billion, while for the rest of
            Australia it is $0.6 Billion.

        •   In the early years of the project employment increases relative to the business-as-usual case by around
            2,700 at 2009 (the peak of the increase). Over time, there are some permanent gains, with employment
            by 2035 being around 8,000 higher than without the new runway.

        •   In order to check the robustness of modelling results, a range of alternative assumptions were tested via
            sensitivity analysis (high traffic, high/low tourism expenditure, high/low airfare price elasticity and a tight
            labour market). In general, the results were quite stable, indicating that the economic benefits are robust
            to a range of alternative assumptions.

        •   Allowing airport capacity to grow, avoiding congestion and bottlenecks from arising, generates
            considerable positive economic benefits for the Brisbane region. The results reported here are the
            benefits from 2006 to 2035. The NPR will have considerable additional economic life beyond 2035,
            resulting in further potential benefits beyond this date.

                                           NEW PARALLEL RUNWAY DRAFT EIS/MDP
A2-44                                             FOR PUBLIC COMMENT
VOLUME A: BACKGROUND AND NEED
A2 Need for the Project
2.1 Introduction The ability of an airport’s runway and taxiway system
to service demand is dependent on the number of
aircraft arriving and departing at the airport. In turn
This chapter of the Draft Environmental Impact the number of aircraft movements is dependent
Statement and Major Development Plan (Draft on the number of passengers wishing to travel by
EIS/MDP) presents: air and the size of aircraft in operation. The travel
• The passenger and air traffic forecasts; patterns of people also govern the busier periods
for aircraft movements. Therefore the number of
• The findings of the capacity analysis of the passengers wishing to travel, and the time that they
existing Brisbane Airport; and wish to travel at, are the main factors in determining
• The economic effects of the NPR. the requirements for air related infrastructure.
Sections 2.2 to 2.5 provide the passenger The forecasts have been developed for two specific
movement, aircraft movement and daily profile purposes, as follows:
demand forecasts and details as to how they were
• Assessment of future demand in order to
determined. Factors affecting the forecasts, such as
identify timing for the new runway. This covers
population and economic growth and sensitivity of
the period up to 2015 when the new runway is
the forecasts are provided in section 2.7.
scheduled to open; and
Section 2.6 details the assessment of the capacity of • Assessment of the 20 years following opening
the existing runway system into the future providing of the runway. This is undertaken primarily for
delays and the resulting effect of a constrained assessment purposes, such as noise modelling,
capacity on the forecasts. road traffic modelling and to inform when staging
of the construction of the complete taxiway
Sections 2.8 to 2.14 provide the economic
system will be needed.
assessment of the effects of the NPR. This includes
a review of property prices in section 2.13. Brisbane Airport has experienced strong passenger
growth of around 7.5 percent per annum over the
15 years between 1989/90 and 2004/05 (Note: This
2.2 Overview of Forecasts
is the ‘Trend CAGR’ and is based on computing
the Compound Annual Growth Rate (CAGR) on
Forecasting growth in passenger and aircraft the trend line for the period analysed). Existing and
movements provides the basis for the long term forecast passenger and aircraft movements are
planning of airport facilities to meet future demand summarised in Table 2.2.
for air travel. The forecasts inform the type of
facilities required and the appropriate staging and
timing of these facilities.
Table 2.2: Summary of Existing and Forecast Passenger and Aircraft Movements.
Years ended 30 June All Passenger Movements All Aircraft Movements
2005 15.6 million 160,000
2015 25.3 million 227,000
2035 50.0 million 393,000
Compound Annual Growth Rate (CAGR)
2005 to 2015 4.9% 3.5%
2015 to 2035 3.5% 2.8%
NEW PARALLEL RUNWAY DRAFT EIS/MDP
FOR PUBLIC COMMENT A2-452.3 Passenger Demand
2.3.1 Historical Trends in Passenger Demand
When considering forecasts, it is important to analyse the trends that have occurred at Brisbane Airport.
Brisbane Airport has been experiencing strong passenger growth for a number of years and has consistently
been recording higher percentage growth than Sydney and Melbourne, refer Table 2.3a.
Table 2.3a: Average Annual Percentage Growth in Air Passengers.
Yearly Period Brisbane Sydney Melbourne
2005 on 1997 5.9% 3.9% 5.3%
2005 on 1977 6.9% 5.2% 5.3%
Historical annual passenger growth rates at Figure 2.3a shows the international and domestic
Brisbane Airport over the past 15 years have been passenger movements through Brisbane Airport
(all Trend CAGRs): since 1996/97.
• 7 percent international and 6.5 percent domestic In the 2003/04 and 2004/05 years, growth in air
over the five years between 1999/2000 and travel through Brisbane recorded double digit
2004/05; percentage growth in international traffic of
19 percent for both years, while domestic growth
• 5 percent international and 5.8 percent domestic
over the 10 years between 1994/95 and was 16 percent in 2003/04 and 9 percent in
2004/05; and 2004/05. This followed decreases in air traffic after
the September 2001 terrorist attacks in the USA,
• 7.4 percent international and 7.6 percent the Bali bombing in October 2002 and the Iraq war
domestic over the 15 years between 1989/90 and SARS in 2003.
and 2004/05.
Figure 2.3a: Passenger Movements through Brisbane Airport from 1996/97 to 2004/05.
18
16 Domestic
14 International
Passengers (Millions)
12
10
8
6
4
2
0
1997 1998 1999 2000 2001 2002 2003 2004 2005
Year End 30 June
NEW PARALLEL RUNWAY DRAFT EIS/MDP
A2-46
FOR PUBLIC COMMENTThese growth rates are unlikely to be maintained cases have also been developed as sensitivity tests.
over a long period of time, but do demonstrate
the resilience of air travel demand to rebound after The forecasting approach is to:
abnormal events. In terms of domestic travel, the • Review markets and establish trend growth
continued growth of all three domestic airlines, rates for Brisbane Airport traffic;
Qantas, Jetstar and Virgin Blue, has resulted in air
travel being increasingly used as a convenient and • Use quantitative analysis and review other
low cost form of travel. studies to establish relationships between traffic
drivers, such as GDP, and traffic demand.
2.3.2 Annual Passenger These are undertaken at a high ‘macro’ level
and compared with market based, or ‘micro’
Forecasting Methodology
reviews; and
A large number of factors influence the growth of
• Establish the ‘reasonableness’ of the forecasts
passenger movements at an airport. These include:
by reviewing other long term forecasts
• The incomes of travellers or potential travellers. (economic, population and traffic), and by
Both the level of income and confidence that comparing Brisbane with other airports.
these levels will be maintained and grow are A macro approach establishes relationships
important; between aggregate passenger numbers for
• The prices of air transport and the ground Brisbane Airport and economic factors such as
component of travel; Australian and/or Organisation for Economic
Co-operation and Development (OECD) GDP.
• The competitiveness (quality, product attributes
and prices) of a destination compared to The approach identifies specific markets for major
alternative destinations; tourism generating countries and/or regions. The
• The supply of airline services – frequency, ‘micro’ approach provides an additional perspective
reliability, quality of service; on growth and is more responsive to developments
in specific regions (e.g. the Asian economic crisis).
• Tourism promotion by governments, airlines and
industry bodies; From previous research and comparable studies
within Australia and overseas, estimates of various
• Consumer tastes and available time for travel; and elasticities have been established, mainly for income
• One-off factors such as wars, SARS, terrorism. and fares. This is used in forecasting passenger
traffic by travel type and route. While these elasticity
Whilst all of these types of factors have an estimates are not derived from Brisbane Airport
influence on demand only some can be measured data, experience indicates that they can be valuable
and factored into the type of modelling generally in preparing medium to longer term forecasts of air
undertaken in forecasting. traffic markets, particularly when used in conjunction
Of the factors listed above, income (generally with trend analysis for the specific market.
measured through an aggregate variable such as The results from the micro level models
Gross Domestic Product (GDP)) has the largest are compared with macro analyses of the
influence on growth rates for international travel. responsiveness of Brisbane Airport to movements in
However, forecasts of movements in the Australian OECD and world GDP levels.
and overseas economies are highly uncertain. So
too are developments in domestic and international For domestic passenger forecasts a similar
aviation. Airline alliances, code sharing, privatisation approach was adopted to that described above.
and the advent of new aircraft types can have a Macro (aggregate) passenger models are developed
material impact on market outcomes. For these to assess passenger responsiveness to movements
reasons a number of approaches have been used in in economic variables.
constructing the forecasts, lower and higher growth
NEW PARALLEL RUNWAY DRAFT EIS/MDP
A2-47
FOR PUBLIC COMMENTAvailable data does not allow the development 2.4 Aircraft Movements
of detailed models for domestic routes. Route
level data by travel purpose is not available for the
domestic sector. The Bureau of Transport and 2.4.1 Historical Trends in
Regional Economics (BTRE) publishes route level Aircraft Movements
data monthly for top Australian domestic routes only.
For the purpose of determining when additional
This route level data was used to establish trends.
airfield infrastructure such as a new runway,
The macro and route level trend outputs provide additional taxiways and apron stands for aircraft are
input to the domestic passenger forecasts. In the needed, the growth in aircraft movements through
shorter term time series analyses, airline views and an airport is a more relevant planning parameter
schedule reviews were used to modify the forecasts. than passenger movements.
The anticipated capacity expansion by the airlines
Aircraft movement growth is normally lower than
has an important influence on growth forecasts in
passenger growth due to airlines upgrading their
the short to medium term.
aircraft fleets to larger capacity aircraft. Air travel
2.3.3 Forecast Passenger Demand is not uniform over a year and the number of daily
flights will fluctuate on a monthly basis to account
Table 2.3b shows the forecast passenger demand for when passengers have a strong propensity
at Brisbane Airport. to travel such as school holidays, Easter and
Christmas periods.
This demand assumes that growth is not
constrained by the lack of available runway capacity Figure 2.4a shows the growth in aircraft movements
through the provision of the NPR. through Brisbane Airport since 1998/99 and the
monthly variation that occurs during the year.
Table 2.3b: Brisbane Airport Passenger Forecasts (‘000s Passengers) with New Parallel Runway.
Years ended 30 International Domestic All Passengers
June
Arriving & DOC1 Transit2 Total Int.
Departing (Excluding
Pax Transits)
2005 3,601 187 250 3,788 11,846 15,635
2010 4,721 138 237 4,859 15,470 20,330
2015 6,162 138 311 6,300 18,970 25,270
2020 7,899 138 400 8,037 23,144 31,182
2025 9,946 138 400 10,084 28,151 38,235
2030 12,442 138 400 12,580 33,086 45,667
2035 14,210 138 400 14,348 35,695 50,043
Compound Annual Growth Rate (CAGR)
2005 to 2015 5.5% -3.0% 2.2% 5.2% 4.8% 4.9%
2015 to 2035 4.3% 0.0% 1.3% 4.2% 3.2% 3.5%
1
DOC is Domestic On Carriage and represents domestic passengers travelling within Australia on an International Flight.
2
Transit are international passengers who are transferring from an arriving international flight and departing on another international flight
i.e. they are using Brisbane Airport as a hub.
NEW PARALLEL RUNWAY DRAFT EIS/MDP
A2-48
FOR PUBLIC COMMENTFigure 2.4a: Monthly Aircraft Movements at Brisbane Airport.
International travel also varies throughout the 2.4.2 Freight and General Aviation
year and is also influenced by seasonal weather
at overseas destinations e.g. strong travel to and The majority of freight that travels into and out of
from New Zealand occurs during the winter months Brisbane Airport currently is carried on passenger
due to Australian tourists visiting the NZ ski fields aircraft rather than dedicated freight aircraft.
and New Zealanders visiting Australia for warmer Australian Air Express (AAE) and Heavy Lift are two
weather. Travel is normally higher to Europe during companies that have regular dedicated freight flights
its summer months than winter. into and out of Brisbane Airport. AAE and Heavy Lift
have only a few jet freighter movements per day.
Table 2.4a shows the growth trends between
domestic, international and general aviation While BAC expects that dedicated freighter aircraft
movements at Brisbane Airport. flights will increase, their percentage of total aircraft
movements will remain very small.
It should also be noted that Brisbane Airport is
predominantly a domestic based airport i.e. some General Aviation (GA) traffic has been declining
86 percent of movements in 2004/05 were by at Brisbane Airport over recent years and now
domestic and general aviation aircraft. represents less than 10 percent of the aircraft
movements. It is envisaged that general aviation
In planning for additional airfield infrastructure, an movements at Brisbane Airport will not appreciably
airport operator has to take into account all grow over the next 20 – 30 years and its percentage
these variables. share of total aircraft movements will decline even
further. Figure 2.4b shows this decline in general
aviation movements at Brisbane Airport.
Table 2.4a: Aircraft Movements Brisbane Airport 1997 to 2005 (Years end 30 June).
Years end 1997 1998 1999 2000 2001 2002 2003 2004 2005 ‘97 to
30 June ‘05
CAGR*
Aircraft Movements (‘000s )
International 19.9 19.9 19.3 19.1 18.7 18.2 17.5 19.3 23.1 1.9%
Domestic 111.7 109.8 112.0 111.6 123.5 110.5 109.6 114.1 125.1 1.4%
Other (GA) 23.6 24.4 27.4 30.1 33.6 22.0 10.7 11.3 11.7 -8.4%
TOTAL 155.2 154.1 158.8 160.8 175.8 150.8 137.7 144.7 159.9 0.4%
* Compound Annual Growth Rate (CAGR)
NEW PARALLEL RUNWAY DRAFT EIS/MDP
A2-49
FOR PUBLIC COMMENTFigure 2.4b: General Aviation (GA) Movements at Brisbane Airport 1991/92 to 2004/05.
40.0
000s Movements
35.0 3 3 .6
3 0 .1
30.0
General Aviation Movements ('000s)
2 7 .4
2 4 .4
25.0 2 3 .5
2 2 .4
2 3 .6
2 2 .1 2 2 .0
2 0 .6 2 0 .1
20.0
15.0
1 1 .3 1 1 .7
1 0 .7
10.0
5.0
0.0
1992 1993 1994 1995 1996 1997 1998 1999 2000 2001 2002 2003 2004 2005
Years end 30 June
2.4.3 Annual Aircraft Movement 2.4.3.1 International Aircraft
Forecasting Methodology Movement Assumptions
Once forecasts of passengers have been developed Table 2.4b shows the key assumptions for
they become inputs to the forecasting of aircraft international aircraft movements for financial years
movements. Assumptions are developed for airline 2006, 2015 and 2035.
passenger load factors and forecasts of airline seats
The aircraft mix is influenced by an analysis of airline
are prepared.
routes and passenger growth. The main influence
Assumptions as to the aircraft mix are based on remains passenger growth although changes in
discussions with airlines, reviews of the Airbus aircraft mix can have major implications for the
Industrie and Boeing forecasts and orders as well as number of aircraft movements and landed tonnes.
detailed analyses of airline schedules for Brisbane
The following approach was adopted for changes in
and other Australian airports. Aircraft mix is used to
aircraft mix:
determine the average number of seats per aircraft
movement and landed tonnes per movement. • For the international market the B767 size
aircraft is expected be replaced by B787 or
A350 aircraft; and
• The A380 aircraft is expected to operate in the
international sector from 2007/08 and is likely
to operate on a regular basis to Brisbane in the
period from 2009/10.
NEW PARALLEL RUNWAY DRAFT EIS/MDP
A2-50
FOR PUBLIC COMMENT2.4.3.2 Domestic Aircraft Movement development. Wide body movements are forecast
Assumptions to increase their share by 2014/15. However strong
growth is expected in the larger turboprop/smaller
Table 2.4c shows the key assumptions for domestic
jet aircraft over the period from 2014/15.
aircraft movements for financial years 2006, 2015
and 2035. 2.4.4 Forecast Aircraft Movements
As with the international sector, the domestic aircraft Table 2.4d shows the international, domestic and
mix is influenced by an analysis of airline routes and general aviation annual aircraft movement forecasts
passenger growth. for 2004/05 to 2034/35 at five yearly intervals.
A conservative stance was adopted with the aircraft By 2014/15 the air traffic is expected to grow to
size for domestic mix. This results from the collapse 227,000 movements at a rate of 3.5 percent per
of Ansett and the emergence of three domestic annum based on the 160,000 movements achieved
airlines and the focus on narrow body aircraft. in 2004/05. From 2014/15 to 2034/35 the number of
The growth in larger B737 aircraft and Jetstar’s aircraft movements is forecast to grow by an average
move from B717s (approx. 110 seat capacity) to 2.8 percent per annum to 393,000 movements.
A320s (approx. 180 seat capacity) is a significant
Table 2.4b: Key Assumptions for International Aircraft Movements.
Years ended 30 June 2005 2015 2035
Aircraft Mix (Share of Movements)
Large and Medium Wide Body (B777, A330, B747, A380) 51% 52% 56%
Smaller Wide Body (B767, B787, A350) 8% 16% 19%
Narrow Body (B737, A320) 41% 32% 25%
TOTAL 100% 100% 100%
Average Pax per Movement 190 195 246
Table 2.4c: Key Assumptions for Domestic Aircraft Movements.
Years ended 30 June 2005 2015 2035
Aircraft Mix (Share of Movements)
Wide Body (B747, B767, A330, B787, A350) 6% 9% 14%
Narrow Body Jets (B737, A320, B717) 68% 64% 56%
Turboprop and Smaller Aircraft 26% 27% 30%
TOTAL 100% 100% 100%
Average Pax per Movement 95 106 112
Table 2.4d: Brisbane Airport Aircraft Movement Forecasts (‘000s) with New Parallel Runway.
Years ended 30 June Movements Total
International Domestic GA
2005 23 125 12 160
2010 28 150 12 190
2015 35 179 12 227
2020 43 216 13 272
2025 50 261 13 324
2030 58 302 13 373
2035 62 318 14 393
Compound Annual Growth Rate
2005 to 2015 4.4% 3.6% 0.6% 3.5%
2015 to 2035 2.8% 2.9% 0.5% 2.8%
NEW PARALLEL RUNWAY DRAFT EIS/MDP
A2-51
FOR PUBLIC COMMENT2.5 Daily Profile In terms of international travel, the morning peak
does have a higher percentage of international
arrivals than the evening peak. It is critical for the
As stated previously, aircraft movements through continued growth of Queensland’s and Brisbane’s
Brisbane Airport vary on an hourly, daily and monthly tourism and commercial development that Brisbane
basis. In terms of planning for the new parallel Airport provides sufficient runway capacity to enable
runway, Brisbane Airport has a particular daily profile continued growth in this international traffic.
which shows two peak periods during the day,
namely a morning peak between 0700 and In considering airport (runway) capacity issues it is
1000 hours and an evening peak between 1700 and normal industry practice to reject those days that
2000 hours. It is management of the growth of have the maximum number of movements and to
these peaks that is necessitating the need for plan around a typical or representative busy day.
the NPR. As stated in BAC’s 2003 Master Plan, BAC adopts
the 95 percentile as being relevant to aviation
Brisbane Airport has a peak operating period profile infrastructure capacity assessment.
that is largely controlled by the requirement of
business travellers on domestic routes and by the Figure 2.5a shows a typical busy weekday profile at
availability of overseas airport arrival and departure Brisbane Airport.
slots (slots at the busy Asian hub airports at
Figure 2.5b shows the domestic and international
Singapore, Bangkok and Hong Kong are limited and
profile for this same busy day.
in high demand) for international routes. Brisbane
Airport’s peak hourly periods in the morning and
evening are reasonably balanced in proportion of
arrival and departure movements allowing for a high
level of system utilisation.
Figure 2.5a: Typical Busy Weekday Profile Brisbane Airport.
NEW PARALLEL RUNWAY DRAFT EIS/MDP
A2-52
FOR PUBLIC COMMENTFigure 2.5b: Typical Busy Weekday Profile for International & Domestic.
It is evident that many airports including Brisbane Further, in the case of Brisbane, a large number
have daily peaks. If the demand within these peaks of regional flights from elsewhere in Queensland
could be spread across other hours of the day, the operate to Brisbane carrying business passengers
need for additional runway capacity and associated wishing to connect to interstate flights. For this
capital expenditure could be reduced. This would reason the regional airlines service also contribute to
be ideal for airlines (as they could improve the morning and afternoon peaks at Brisbane Airport.
utilisation of their aircraft and airport operators as
they could increase the revenue achieved for their International peaks result from a complex array of
aeronautical infrastructure investment). However issues. There are a number of significant influences
underestimating the peak can lead to congestion, and constraints affecting airline schedules.
delays and ultimately to capacity constraints that These include:
restrict growth and development. • Passenger preferences to commence or complete
their journey at ‘friendly’ times – not too early in the
The peaks arise due to passenger preferences and
morning and not too late in the evening;
a number of airline operating constraints.
• Slot limitations at airports in Asia and Europe
Domestic airline peaks arise around 7am to 9am which will limit when aircraft can arrive at or
each weekday morning and around 6pm to 8pm depart from Brisbane; and
each evening. For airports such as Sydney,
Melbourne and Brisbane these runway peaks are • The hubbing role played by some airports. This
driven largely by domestic business traffic. It is means that longer haul flights operating via Asia
estimated that business accounts for between need to connect with flights in the hub port
60 percent and 65 percent of the domestic traffic to carry passengers from an incoming port to
and that between one-third and 40 percent of their different ultimate destinations. Thus the
incoming flight needs to arrive in time to catch a
domestic passengers travel from or to Brisbane and
‘bank’ of outgoing flights.
return in the same day. As Brisbane’s population
grows so too will its business traffic. For this As a result of these factors, airlines cannot schedule
reason it is reasonable to expect that the airlines will arrivals and departures on an unconstrained
continue to serve the needs of the higher yielding 24 hour basis. Rather they are confronted with
business passengers with services operating at limited scheduling opportunities or ‘windows’.
current peak times.
This is why many Asian flights arrive at Brisbane
in the early morning adding to the domestic peak
described earlier.
NEW PARALLEL RUNWAY DRAFT EIS/MDP
A2-53
FOR PUBLIC COMMENTThus whilst there are some opportunities for airlines Accordingly, four representative days were
and airports to spread their peaks there is a limit determined for Brisbane Airport representing
and little scope to spread traffic evenly across the the following:
operating day.
1) Weekday summer (corresponding to northern
When demand starts to exceed capacity during hemisphere winter);
peak periods, airlines either have to move flights
2) Weekend summer (corresponding to northern
into the shoulder period, change aircraft to a larger
hemisphere winter);
seating capacity aircraft, or simply allow passengers
to alter their travel patterns (e.g. travel earlier or 3) Weekday winter (corresponding to northern
later, use alternative airports, or not travel by air). hemisphere summer); and
This is not an ideal situation as for many reasons, 4) Weekend winter (corresponding to northern
passengers particularly the business traveller, have hemisphere summer).
a particular time when they must travel. This is
discussed further in section 2.6. The following steps were followed to derive typical
busy weekdays. The busy day was identified as this
2.5.1 Busy Day Profiles was then used as the representative day on which
forecast airline traffic growth would be based.
Busy day air traffic movement profiles were
developed from an analysis of busy days through 1) The 30th Busy Hour (the hourly rate surpassed
the year. The review was completed for weekdays only by the rate of 29 other hours through the
and weekends, and was based on a very year) and the 95th Percentile Hour (the hourly
comprehensive dataset of aircraft movements rate above which 5 percent of the airports traffic
from 1998 to 2005. Profiles assessed from this is handled) were identified as they are important
comprehensive dataset included: indicators of the busier periods at the airport.
2) Analyse the busiest 300 weekdays from this
• Daily movements over a whole year;
dataset. Days were chosen for further analysis
• Monthly (seasonal) variations in demand; if the:
• Hourly variation in demand across the day; • Busy hour for the day closely matched the
30th Busy Hour, and to a lesser extent the
• The occurrence of busy periods – day of the
95th percentile hour, in size and time of day;
week, time of the day;
• Total movements for that day were equal to
• Split of hourly demand between arrival and
or above the median of the busiest 300 week
departures;
days; and
• Split of hourly demand between international
• Aviation activity followed a ‘typical’ profile for
and domestic movements; and
the day. i.e. morning and afternoon peaks.
• Split of hourly demand between aircraft types.
For airline forecasting at a major airport such as
Brisbane which has a predominance of business
traffic particularly during the busy periods, it is
normal to analyse both week days and weekends.
Additionally, for international traffic, airline schedules
are set worldwide around the Northern Hemisphere
winter (November – March) and the Northern
Hemisphere summer (April – October).
NEW PARALLEL RUNWAY DRAFT EIS/MDP
A2-54
FOR PUBLIC COMMENTDays were omitted if they did not conform with a Table 2.5a shows the top 100, 200 and 300 hours
typical daily profile (i.e. if they had excessive peaks/ in terms of movements for each day of the week.
troughs outside typical peak hours). Monday has 23 percent of the top 100 hours.
However when the top 200 and 300 hours are
A similar analysis was used to derive the typical considered Friday becomes the busiest day.
busy weekends.
Table 2.5b compares the top 100, 200 and 300
1) Analysing all Saturdays and Sundays for the year.
hours across hours of the day. The significance of
Days were chosen for further analysis if the:
the hours 0800 and 1800 is evident from this table.
• Busy hour for the day was above the median Some 70 percent of the top 100 hours over a year
and amongst the busiest ‘weekend’ hours of occur in the 1800 to 1900 hour time period.
the year;
The outcome of this busy day analysis is the following
• Total movements for that day were equal to representative busy days on which forecasting were
or above the median for all weekends for the based:
year; and
• Weekday Brisbane summer –
• Aviation activity followed a ‘typical’ profile for Friday 3 December 2004;
the day.
• Weekend Brisbane summer –
2) The days chosen for further analysis were then Sunday 5 December 2004;
further analysed. Days were omitted if they did
not conform to a typical daily profile (i.e. if they • Weekday Brisbane winter –
had excessive peaks/troughs outside typical Friday 8 April 2005; and
peak hours).
• Weekend Brisbane winter –
Sunday 5 June 2005.
Table 2.5a: Busiest Hours by Day.
Day Mon. Tue. Wed. Thu. Fri. Sat. Sun.
Top 100 23.0% 19.0% 15.0% 18.0% 20.0% 0.0% 5.0%
Top 200 20.0% 17.0% 13.5% 18.5% 23.0% 2.0% 6.0%
Top 300 19.3% 16.7% 13.7% 19.7% 20.0% 4.3% 6.3%
Table 2.5b: Busiest Hours by Hour.
Hour 6 7 8 9 10 11 12 17 18 19 20
Top 100 29.0% 70.0% 1.0%
Top 200 0.5% 0.5% 34.0% 1.5% 0.5% 0.5% 2.0% 1.0% 57.5% 2.0%
Top 300 0.3% 0.3% 35.3% 1.7% 0.7% 0.3% 1.3% 1.7% 53.3% 4.7% 0.3%
NEW PARALLEL RUNWAY DRAFT EIS/MDP
A2-55
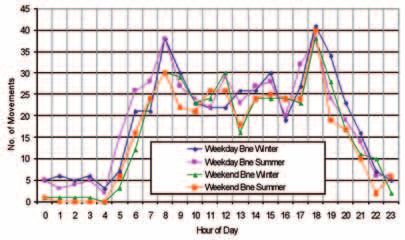
FOR PUBLIC COMMENTFigure 2.5c shows the hourly movement profile for these identified representative days.
Figure 2.5c: Movement Profile by Hour, Selected Typical Days.
2.5.2 Busy Day Profile arrivals on the cross runway. If no further capacity was
Forecasting Methodology provided (e.g. the new runway was not constructed),
the number of flights able to arrive and depart would
The busy day profile forecasts take into account: be constrained during certain times of the day. This is
• The annual movement forecasts; discussed in further detail in section 2.6.
• The market growth for domestic and The capacity limitations would be most reflected
international aircraft; and in later years. Therefore, two daily profiles were
developed for 2034/35. The first is unconstrained
• The mix of aircraft types.
and assumes that the additional runway is
The busy day projections reflect a growing volume constructed. The second profile, constrained, is
of movements, a representative mix of movements built on the assumption that no additional capacity
and a distribution across the day consistent with is constructed.
market and domestic business demands.
2.5.3 Forecast Busy Day Profiles
Movements are added to the base ‘representative
days’ where the type of traffic did not exist on that Profiles for 2004/05, 2014/15 and 2034/35
day. For example, there are few freight movements (unconstrained and constrained) are provided in the
that take place on Fridays with most domestic figures that follow.
freight carried Tuesday, Wednesday and Thursday. The constrained profile has taken the 2014/15 profile
Freighter movements were therefore added to the and allowed growth until capacity limits were reached.
projected days. For the same reason General Aviation
movements were also added to the daily profile. Figure 2.5d shows the arrivals by hour for 2004/05,
2014/15 and 2034/35. Figure 2.5e shows the
The existing runway system has a defined peak departures by hour and Figure 2.5f shows the
hour capacity of up to 59 aircraft movements. This aggregated arrivals and departures across hours.
comprises 27 jet arrivals and 27 jet departures on These figures show the base and projections for the
the main runway with an additional five turbo prop Brisbane winter weekday.
NEW PARALLEL RUNWAY DRAFT EIS/MDP
A2-56
FOR PUBLIC COMMENTFigure 2.5d: Brisbane Movements – Arrivals by Hour – Forecasts.
Figure 2.5e: Brisbane Movements – Departures by Hour – Forecasts.
Figure 2.5f: Brisbane Movements – Arrivals Plus Departures by Hour – Forecasts.
NEW PARALLEL RUNWAY DRAFT EIS/MDP
A2-57
FOR PUBLIC COMMENT2.6 Capacity at Brisbane Airport AsA has established agreed arrival rates for the
Australia’s three major east coast Airports (Brisbane,
Sydney and Melbourne) to ensure that aircraft can
2.6.1 Existing Capacity be safely controlled and which enables airlines to
understand potential constraints when considering
Brisbane Airport currently has a single main runway
scheduling additional flights.
of 3,600 m length that is suitable for all size of aircraft
to take-off and land, including the new Airbus A380. AsA has established a Capacity and Service
There is a shorter (1,760 m in length) cross runway Improvement Forum (CASIF) with airlines and
which is used predominately by smaller aircraft Brisbane, Sydney and Melbourne airports to set
(typically turbo prop aircraft) operated by General and review arrival capacity. This capacity takes
Aviation and regional airlines such as Qantas Link, into account operational limitations in terms of
Sunshine Express and Macair. This cross runway runways (length and layout configuration) as well
also can be used under limited circumstances by as meteorological conditions. Arrival capacity is
B737 aircraft operating under weight restrictions. The greater under visual conditions than under instrument
majority of international and domestic aircraft currently conditions (low visibility due to rain, fog or low level
operating at Brisbane Airport cannot use this smaller cloud). Departures are usually scheduled in
cross runway. between arrivals.
The capacity of the existing runway system at For Brisbane Airport, the existing agreed CASIF arrival
Brisbane Airport is dependent on: capacities are shown in Table 2.6a.
• Aircraft demand and mix during the peak Under these agreed arrival rates and allowing for a
operating periods; departure between each arrival on the main runway,
• The proportion of arrival and departure the existing capacity rates for Brisbane Airport are:
movements; • For main runway only, 50 total movements under
• The operating mode during the peak operating visual conditions;
periods (meteorologically dependent) and the • For main and cross-runway, 55–60 total
capacity of that mode; and movements under visual conditions.
• The duration of the peak operating periods. In the case of when both the main and cross runways
As previously stated, it is necessary for an airport are being used, capacity varies due to the cross
operator and the airlines to closely monitor growth runway being limited to usually turbo prop aircraft only.
during the busy periods to determine when demand Often these are directed to land on the cross runway
is likely to reach capacity. Once demand exceeds but are slotted in for a departure off the main runway.
capacity, delays will occur.
Meteorological conditions will determine when the
Departures and arrivals at Brisbane Airport are different runway operating modes can be used.
handled by Air Traffic Controllers employed by Figure 2.6a shows the percentage use of the various
Airservices Australia (AsA). modes over recent years.
Table 2.6a: Existing Agreed Arrival Rates for Brisbane Airport.
Runway Used Visual Conditions (movements Instrument Conditions
per hour) (movements per hour)
01 only 25 22
01A & 14A; 01D 30 Not applicable *
01A & 32A; 01D 30 Not applicable *
19 only 25 22
19A & 14A; 19D 30 Not applicable *
* ‘A’ denotes arrival runway;’ D’ denotes departure runway; * instrument landing system is available only for arrivals on main runway (01/19).
NEW PARALLEL RUNWAY DRAFT EIS/MDP
A2-58
FOR PUBLIC COMMENTFigure 2.6a: Morning Peak Hour Arrivals: Runway Usage (%) at Brisbane Airport June 2002 to November
2005 (Source: Airservices Australia).
Computer simulation modelling was also completed pilots will be flying slightly different speeds to that
to assess the capacity of the existing runway and assumed in the model, and air traffic controllers
taxiway layout. This simulation uses a workstation may provide a larger separation distance between
computer software system, the Total Airspace and certain types of aircraft to always ensure optimal
Airport Modeller (TAAM) which is used widely both safety. Nevertheless, TAAM has been used to assist
within Australia (by Airservices Australia) as well in determining the appropriate timing for the new
as at overseas airports. This computer modelling parallel runway. TAAM modelling was undertaken
by TAAM provides what can be described as the for visual conditions only as these occur for the
theoretical maximum capacity of the airfield system majority of the time at Brisbane Airport and used the
as it assumes constant flow of presenting aircraft traffic mix for a typical busy day at Brisbane Airport.
and provides for minimum separation clearances
between aircraft to be maintained at all times. TAAM capacity determination for the existing system
is shown in Table 2.6b. Only the 19/14 runway
In reality, actual capacity achieved at an airport combination was used (and not also 01/14) as this is
would normally be less than that predicted by the dominant mode used (see Figure 2.6a).
TAAM as aircraft don’t present in a uniform manner,
Table 2.6b: TAAM Capacity for Existing Runway System at Brisbane Airport.
Runway Used Capacity
01 only 54 (27 arrivals and 27 departures)
19 only 54 (27 arrivals and 27 departures)
19A and 14A; 19D 63 (27 arrivals and 31 departures on runway 19, 5 arrivals
of turbo props on runway 14)
NEW PARALLEL RUNWAY DRAFT EIS/MDP
A2-59
FOR PUBLIC COMMENTAs can be seen from TAAM, the modelling confirms Delay is defined as the difference between the time
that the agreed CASIF rates for Brisbane Airport taken for an aircraft to pass through the system in
are reasonable. the unconstrained and the constrained situations.
Table 2.6c shows existing movements during the The US Federal Aviation Administration (FAA) has
morning and evening peaks at Brisbane for a typical shown that at jet airline dominant airports, delay
busy day in 2005. This shows the available spare increases rapidly once demand exceeds the level
movement capacity before the existing system would corresponding to an average delay of four minutes.
reach capacity. This is indicative only as it assumes The expected number of movements that can be
that aircraft will present uniformly across the hour. performed in one hour with an average delay per
The reality is that there are often noticeable peaks movement of four minutes has therefore been defined
within the busy hour where demand is close to as the practical hourly capacity. The four-minute
existing capacity at Brisbane Airport and aircraft are average delay criterion is typically adopted when
already starting to incur some delays. calculating both airport and airspace capacity
within Australia.
Based on the forecasts of air travel growth at
Brisbane Airport (see section 2.5), demand will The TAAM modelling referred to earlier was used to
exceed existing runway capacity around 2014. ascertain what happens to delay if the NPR doesn’t
proceed or is delayed.
2.6.2 Impacts on Travel Without
New Parallel Runway Tables 2.6d to 2.6f show the delays during the
morning and evening busy periods for 2005
2.6.2.1 Delays (current), in 2015 without the new runway and in
2035 without the new runway.
As stated above, demand is anticipated to exceed
the existing runway capacity by 2014 for the
busy periods of the day. After this, delays can be
expected to increase which causes disruption to the
travelling public, extra costs to airlines, and ultimately
a reduction in the number of people that would
otherwise have travelled to and from Brisbane by
air with consequent economic losses to commerce,
industry and tourism of the region and State.
Table 2.6c: Current Movements at Brisbane Airport and Available Capacity.
Busy Hours Current Movements
Aircraft Existing Spare Existing Spare
Arrivals & Runway Capacity Runway Capacity
Departures Capacity (TAAM) Capacity CASIF
(TAAM) CASIF agreed rates
agreed
rates
Morning Hours
0700 21 54 33 50 29
0800 38 54 16 50 12
0900 30 54 24 50 20
Evening Hours
1700 27 54 27 50 23
1800 41 54 13 50 9
1900 34 54 20 50 16
NEW PARALLEL RUNWAY DRAFT EIS/MDP
A2-60
FOR PUBLIC COMMENTTable 2.6d: Delay Results for 2005 Traffic.
2005 0700 – 1200 hours 1700 – 2200 hours
Operating Mode Average Maximum Average Maximum
Delay (mins) Observed Delay (mins) Modelled
Delay (mins) Delay (mins)
RWY 01/14 1.67 7.08 1.68 10.45
RWY 19 1.62 7.19 2.98 15.15
RWY 19/14 1.44 7.73 1.38 9.29
Table 2.6e: Delay Results for 2015 Traffic (No New Parallel Runway).
2015 0700 – 1000 hours 1700 – 2000 hours
Operating Mode Average Maximum Average Maximum
Delay (mins) Observed Delay (mins) Modelled
Delay (mins) Delay (mins)
RWY 01/14 4.20 18.49 2.82 18.00
RWY 19 6.16 31.56 5.18 38.06
RWY 19/14 2.92 17.54 2.50 16.18
Table 2.6f: Delay Results for 2035 Traffic (No New Parallel Runway).
2035 0700 – 1000 hours 1700 – 2000 hours
Operating Mode Average Maximum Average Maximum
Delay (mins) Observed Delay (mins) Modelled
Delay (mins) Delay (mins)
RWY 01/14 22.84 149.91 63.97 248.79
For the 2035 delay scenario (Table 2.6f), only one 2.6.2.2 Net Passenger Loss
model run was undertaken as it became obvious
The hourly, daily and annual capacity constraints
that delays of between 2.5 to 4 hours were starting
of traffic for 2034/35 were applied assuming no
to occur. No airline would tolerate such delays and
additional runway. Applying the capacity limits
would alter their schedule accordingly by either
generates the losses in aircraft movements
changing flight times (where possible) or by not
(compared to the unconstrained 2034/35 forecasts)
scheduling the flights (more likely) leading to loss of
shown in Table 2.6g.
airline passengers through Brisbane.
It is estimated that 35 percent of aircraft movements
would be lost in 2034/35.
NEW PARALLEL RUNWAY DRAFT EIS/MDP
A2-61
FOR PUBLIC COMMENTTable 2.6g: Aircraft Movement Impacts of Capacity Constraints With No Additional Runway.
Year end Aircraft Movements (‘000s)
June 30 International Domestic GA Total
Unconstrained Movements (‘000s)
2005 23 125 12 160
2015 35 179 12 227
2020 43 216 13 272
2025 50 261 13 324
2030 58 302 13 373
2035 62 318 14 393
Constrained Movements (‘000s)
2005 23 125 12 160
2015 35 179 12 227
2020 42 208 6 256
2025 42 208 5 256
2030 42 209 5 256
2035 42 209 5 256
Impact of Capacity Constraints on Movements
2005 0.0% 0.0% 0.0% 0.0%
2015 0.0% 0.0% 0.0% 0.0%
2020 -1.6% -3.7% -55.1% -5.8%
2025 -15.2% -20.1% -58.1% -20.9%
2030 -27.7% -30.8% -61.0% -31.4%
2035 -31.6% -34.3% -63.8% -34.9%
Based on the loss of aircraft movements shown in The required number of aircraft movements was
Table 2.6g, the loss of passengers could be up to estimated by dividing passenger numbers by an
35 percent. However in the event that an additional assumed average number of passengers per
runway was not available the progressive tightening movement. Table 2.6h shows the assumed
of runway slot capacity would lead the airlines to changes to passenger load factors and seats per
add larger aircraft where feasible and they would movement in the no runway case compared to the
operate with higher average loads. ‘unconstrained’ forecasts for 2034/35. The result
for 2034/35 is an:
• Increase in the average number of passengers
per international movement from 246 to 279;
and
• Increase in the average number of passengers
per domestic movement from 112 to 129.
NEW PARALLEL RUNWAY DRAFT EIS/MDP
A2-62
FOR PUBLIC COMMENTTable 2.6h: Passenger Movement Impacts of Capacity Constraints With No Additional Runaway.
Years International Domestic
end 30 Change in Change in Average No. Change in Change in Average No.
June Load Factors the Average Passengers Load Factors the Average Passengers
(percentage No. Seats per (percentage No. Seats per per
points) per Aircraft Movement points) Aircraft (%) Movement
(%) from to from from to
2020 0.0% 0.0% 207 207 0.0% 0.0% 107 107
2025 2.5% 5.0% 220 240 2.5% 2.5% 108 114
2030 5.0% 5.0% 230 261 5.0% 5.0% 110 123
2035 5.0% 5.0% 246 279 5.0% 7.5% 112 129
Based on the changed assumptions the loss of passengers in the no runway case is reduced to the levels
shown in Table 2.6j. The overall passenger loss is around 12 million passenger movements in 2035/35 or
24 percent of the unconstrained demand.
Table 2.6j: Passenger Movement Impacts of Capacity Constraints With No Additional Runaway.
Year end International (Excluding Domestic All Passengers
June 30 Transits)
Unconstrained Passenger Movements (‘000s)
2005 3,788 11,846 15,635
2015 6,300 18,970 25,270
2020 8,037 23,144 31,182
2025 10,084 28,151 38,235
2030 12,580 33,086 45,667
2035 14,348 35,695 50,043
Constrained Passenger Movements (‘000s)
2005 3,788 11,846 15,634
2015 6,300 18,970 25,270
2020 7,940 22,283 30,223
2025 9,353 23,830 33,183
2030 10,332 25,629 35,961
2035 11,130 26,875 38,005
Impact of Capacity Constraints on Passenger Movements
2005 0.0% 0.0% 0.0%
2015 0.0% 0.0% 0.0%
2020 -1.1% -3.7% -3.1%
2025 -7.2% -15.4% -13.2%
2030 -18.0% -22.5% -21.2%
2035 -22.5% -24.7% -24.1%
Whilst some Brisbane residents conveniently In addition both the Gold Coast and Sunshine
located to the Gold Coast or Sunshine Airports Coast airports can be expected to grow strongly
and travelling for business may be prepared to use due to the population growth in South East
those airports they are not likely to find the same Queensland. The addition of peak hour traffic would
range of destinations and frequencies provided at increase substantially their own needs for capacity
convenient times. expansion.
NEW PARALLEL RUNWAY DRAFT EIS/MDP
A2-63
FOR PUBLIC COMMENT2.6.3 Temporary Closure of 14/32 However, it is not anticipated that a variation in the
Runway forecast growth rates would change the new runway
layout or the need for the new runway. Rather,
During construction of the new parallel runway, the it would affect the time at which the new runway
cross runway (14/32) will need to be closed for an and taxiways would be required. If air traffic grows
extended period to enable works to be carried out. faster (higher case) than the forecasts, the new
This cross runway closure is likely to be in late 2008/ runway would be required earlier than identified.
early 2009 for around two years. Refer to Chapter Conversely, if air traffic grows at a slower rate (lower
A5 for further details on construction staging. case) than the forecast, the new runway would be
During this period, capacity will be reduced to the required later than identified.
single main runway. Capacity could be reduced The existing runway configuration is forecast to
even further below the TAAM upper limit of 54 reach capacity in the busier hours of the day around
depending on how many turbo prop aircraft are 2014, being one of the factors contributing to
operating during the peak periods. Separation 2015 being identified as the opening year for the
distances between a turbo prop and a large jet new runway. However, the higher growth case
aircraft need to be at least five nautical miles due to would result in a greater number of instances of
the effects of wake turbulence. demand exceeding capacity with additional delays
The TAAM modelling considered what happens to experienced in the period after 2012/13 and prior to
delay when the cross runway is closed, and includes the new runway opening.
the typical aircraft mix (jets and turbo props) currently A number of assessments included in Volumes
in the busy hour. These delay results are given in A, B, C and D of the Draft EIS/MDP are based
Table 2.6k. on these forecasts. These include aircraft noise,
aircraft emissions, road traffic, road traffic noise and
2.7 Factors Affecting Forecasts emissions and economics. The air traffic forecasts
are the main input in identifying the effect of the
new runway in these assessments. Therefore, as
2.7.1 Sensitivity of Forecasts with the timing of the need for the runway, variation
in actual growth would also bring forward or
It is recognised that the passenger and aircraft
delay the effects of the new runway in these other
forecasts are the result of the estimation of a
assessments.
number of factors and how these factors will
change in the future. The actual growth in the Tables 2.7a and 2.7b provide the passenger and
passenger and aircraft movements may vary from aircraft movement forecasts for higher and lower
the forecasts. For this reason, lower and higher cases. The forecasts previously discussed in this
growth cases have also been developed to provide chapter are referred to as the ‘central’ forecast.
a sensitivity test on the forecasts.
Table 2.6k: Delay results for 2009 traffic.
2009 0700 – 1200 hours 1700 – 2200 hours
Operating Mode Average Maximum Average Maximum
Delay (mins) Observed Delay (mins) Observed
Delay (mins) Delay (mins)
RWY 01/14 3.00 15.74 2.82 18.98
RWY 19 4.86 21.09 3.81 25.67
RWY 19/14 2.91 14.80 2.16 17.26
NEW PARALLEL RUNWAY DRAFT EIS/MDP
A2-64
FOR PUBLIC COMMENTYou can also read