NO 1 AVOL 24 - A Milk SA publication compiled by the Milk Producers' Organisation - Milk Producers Organisation
←
→
Page content transcription
If your browser does not render page correctly, please read the page content below
VOL 24

                                                                                      LACTO DATA
                   NO 1
                 May 2021

                A Milk SA publication compiled by
                 the Milk Producers’ Organisation

                                      Suid-Afrikaanse Melkprosesseerdersorganisasie
                                      South African Milk Processors’ Organisation

AA - P105-136 LACTO DATA.indd 1                                                              2021/04/16 14:01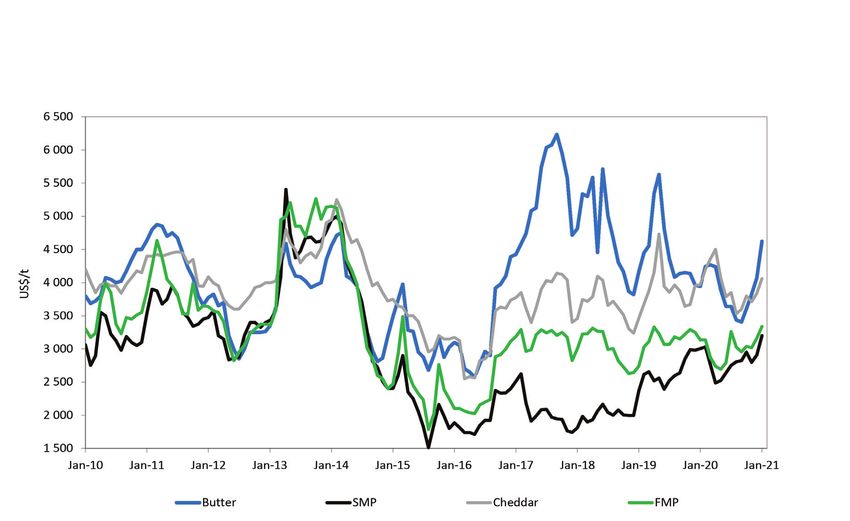
AA - P105-136 LACTO DATA.indd 2 2021/04/16 14:01
L ACTO DATA
Milk SA foreword
The purpose of this publication is to provide information on the structure and performance of
the dairy industry, with a view to promoting optimal development for the benefit of the South
African dairy industry and consumers.
Milk South Africa (Milk SA) is proud to present this publication, which was made possible through the
contributions of the persons or entities sharing their information via statutory regulations. The SA Milk
Processors’ Organisation (SAMPRO), the Milk Producers’ Organisation (MPO), and the Milk SA work
group comprises messrs Nico Fouché, De Wet Jonker, Alwyn Kraamwinkel, and Bertus van Heerden.
Executive summary Contents
The estimated 3,5% contraction of the global Milk SA foreword 3
economy for 2020 is better than that projected Executive summary 3
in the previous World Economic Outlook report INTERNATIONAL SITUATION 4
(October 2020), due to a stronger than expected Global economic growth 4
recovery, on average, across regions in the second Another surge in the FAO Food Price Index 5
half of 2020. The 2021 growth forecast of 5,5% is International dairy product prices 6
reflecting additional policy support in a few large
International unprocessed milk
economies and expectations of a vaccine-powered producer prices 7
strengthening of activity later in the year, which World production of unprocessed milk 7
outweighs the drag on near-term momentum due
Manufacturing of dairy products globally 9
to rising infections in some regions.
Consumption of dairy products 11
International dairy trade 13
The Food Price Index of the Food and Agricultural
Organization (FAO) of the UN indicates that global International primary sector 15
food prices increased by 11% from January 2020 Cost of milk production internationally 15
to January 2021, while the index for dairy products International producer price of
increased by 7% over the same period. Comparing unprocessed milk 19
January 2021 with January 2020, skimmed milk SOUTH AFRICAN SITUATION 21
powder (SMP) increased by 6,1%, butter prices by 17%, South African primary dairy sector 21
cheddar prices by 2,4%, and full-cream milk powder South African secondary dairy sector 27
(FMP) by 6,4%. ACRONYMS AND ABBREVIATIONS 32
The OECD-FAO Agricultural Outlook 2020–2029
report, a collaborative effort between the Organisation
for Economic Co-operation and Development (OECD) Compiled by Bertus van Heerden
and the FAO, finds that over the next ten years, supply for Milk SA.
growth is going to outpace demand growth, causing
Milk Producers’ Organisation
real prices of most commodities to remain at or below
PO Box 1284 | Pretoria | 0001
their current levels. Tel +27 (0)12 843 5600
Comparing the average unprocessed milk price in Design and layout by
Europe from January 2020 to December 2020, the The Dairy Mail (Pty) Ltd
price, in terms of euros, basically moved sideways, and Lacto Data Vol. 24 is also
from March 2020, at lower levels than 2019. In January available on milksa.co.za and
2020, the price was €0,34 (R5,62) and in December mpo.co.za/information/lactodata.
2020, €0,35 (R6,27) per litre. In rand terms, however,
This is a publication of Milk SA.
the price increased by 12%, illustrating the effect of the Lacto Data is compiled from
depreciated rand. Over the same period, the average sources that are deemed to be
unprocessed milk price in South Africa increased reliable. However, the compilers
and publisher accept no responsibility for
by 15%, from R4,50 to R5,19. In South Africa, the
any errors, or the effect of any decisions
production of unprocessed milk registered a negative based on this publication.
growth of 0,16% in 2020.
VOL 24 • NO 1 • MAY 2021 3
AA - P105-136 LACTO DATA.indd 3 2021/04/16 14:01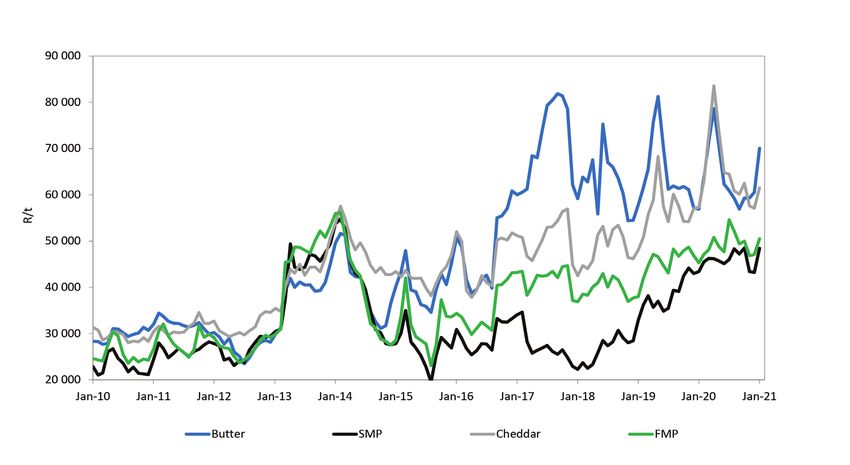
INTERNATIONAL SITUATION
Global economic growth
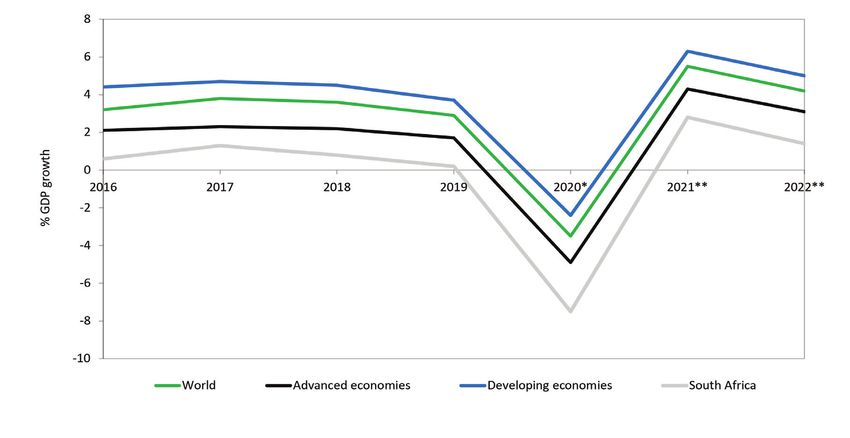
After an estimated 3,5% contraction in 2020, the than merchandise volumes, however, which is
global economy is projected to grow at 5,5% in consistent with subdued cross-border tourism
2021 and 4,2% in 2022. The estimate for 2020 is 0,9 and business travel until transmission declines
percentage points higher than that projected in everywhere.
the International Monetary Fund's October 2020
survey, entitled World Economic Outlook: A long Inflation
and difficult ascent. This reflects the stronger than Even with the anticipated recovery in 2021–2022,
expected recovery, on average, across regions output gaps are not expected to close until after
in the second half of the year. The 2021 growth 2022. Consistent with persistent negative output
forecast is reflecting additional policy support gaps, inflation is expected to remain subdued
in a few large economies and expectations of a during 2021–2022. In advanced economies, it is
vaccine-powered strengthening of activity later in projected to remain generally below central bank
the year, which outweighs the drag on near-term targets, at 1,5%. Among emerging markets and
momentum due to rising infections. The upgrade developing economies, inflation is projected at
is particularly large for the advanced economy just over 4%, which is lower than the historical
group, reflecting additional fiscal support – mostly average of the group.
in the United States (US) and Japan – together
with expectations of earlier widespread vaccine Advanced economies
availability, compared to the emerging market In general, advanced economies have been
and developing economy group. able to provide expansive fiscal support to
households and firms (direct tax and spending
Global trade measures, as well as equity injections, loans,
Consistent with the recovery in global activity, and guarantees), and central banks have
global trade volumes are forecast to grow about reinforced this with expanded asset purchase
8% in 2021, before moderating to 6% in 2022. programmes, funding-for-lending facilities,
Services trade is expected to recover more slowly and, for some, interest rate cuts. Reflecting
Figure 1 International economic growth and expected growth, 2016–2022 (source: IMF,
2020* estimate, 2021**, and 2022** projections)
4 VOL 24 • NO 1 • MAY 2021
AA - P105-136 LACTO DATA.indd 4 2021/04/16 14:01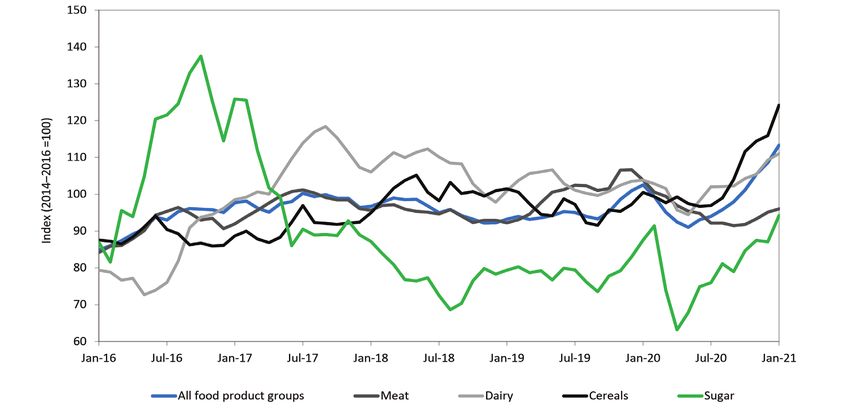
L ACTO DATA

          the strong policy support and the anticipated         the sugar and cereals sub-indices, while meat and
          widespread availability of vaccines in the            dairy values were also up, but to a lesser extent.
          summer of 2021, the projected output loss                 The FAO Dairy Price Index (FDPI) averaged
          compared with the pre-COVID-19 forecast is            111,0 points in January 2021, up 1,7 points
          relatively smaller for advanced economies than        (1,6%) from December 2020, rising for the
          other countries.                                      eighth consecutive month and placing the
                                                                index at 7,1 points (6,9%) above its value in the
          Emerging markets and developing economies             corresponding month the previous year. In
          Emerging markets and developing economies are         January, butter and whole milk powder (WMP)
          also projected to trace diverging recovery paths.     price quotations increased, underpinned by
          Considerable differentiation is expected between      China’s high purchases in the wake of the
          China – where effective containment measures, a       country’s upcoming New Year holiday festivities,
          forceful public investment response, and central      amid seasonally lower exportable supplies in
          bank liquidity support have facilitated a strong      New Zealand. Price quotations for skimmed
          recovery – and other economies. Oil exporters and     milk powder (SMP) rose too, pressured by high
          tourism-based economies within the group face         import demand for spot supplies and lagging
          particularly difficult prospects considering the      production activities in Western Europe. By
          expected slow normalisation of cross-border travel    contrast, cheese prices fell slightly from the
          and subdued outlook for oil prices. As noted in       highs registered in December 2020, due to
          the IMF's October 2020 world economic outlook         limited internal sales in Europe, coupled with
          survey, the pandemic is expected to reverse the       stock build-up in the US.
          progress made in poverty reduction over the past          The FAO Cereal Price Index (FCPI) averaged
          two decades.                                          124,2 points in January 2021, marking a sharp
                                                                increase of 8,3 point (7,1%) from December
          Another surge in the FAO Food Price Index             2020 and the seventh consecutive monthly rise.
          The FAO Food Price Index (FFPI) averaged              International maize prices increased significantly,
          113,3 points in January 2021, 4,7 points (4,3%)       surging by 11,2% in January, up 42,3% above their
          higher than in December 2020, not only marking        January 2020 level, reflecting increasingly tight
          the eighth month of consecutive rise, but also        global supply with lower-than-earlier-expected
          registering its highest monthly average since July    production and stock estimates in the US and
          2014. The latest increase reflected strong gains in   substantial purchases by China.

         Figure 2 FAO food price indices of internationally traded product groups, 2016–2021
         (source: FAO Food Price Index, 2021)

                                                                               VOL 24 • NO 1 • MAY 2021 5

AA - P105-136 LACTO DATA.indd 5                                                                                2021/04/16 14:01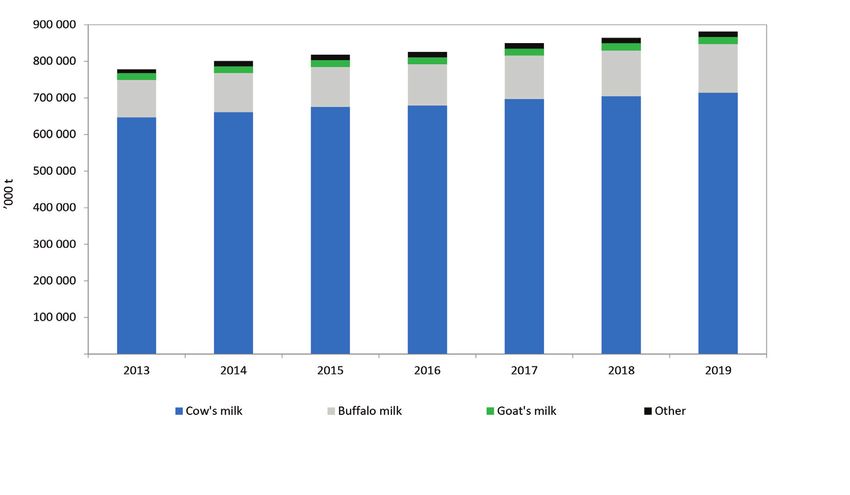
International dairy product prices
At the beginning of 2016, the narrow price band beginning of 2016, indicating that a high animal
in which dairy products typically traded changed fat diet is beneficial. The research took a negative
into a divergent, wider price band. The wider stance towards plant fats and introduced several
price band continued since then and, although high animal fat diets, with Banting probably the
less pronounced, is still evident today. The main most well-known; essentially a low carbohydrate
driver behind this phenomenon is new research and high animal fat diet. This development
that was published towards the end of 2015 and created an increased demand for animal fats that
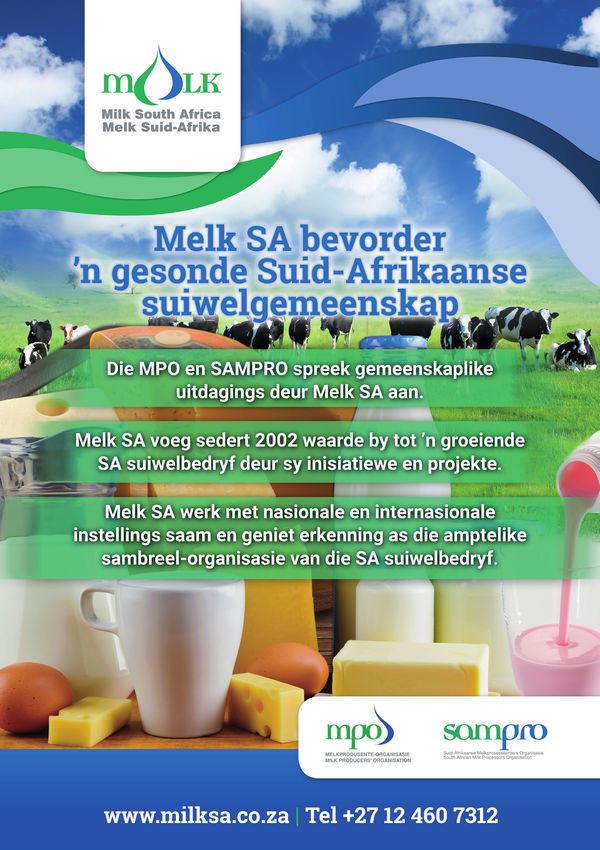
Figure 3a International FOB dairy product prices, US$/t, Jan 2010–Jan 2021 (source: USDA)
Figure 3b International FOB dairy product prices, R/t, Jan 2010–Jan 2021 (source: USDA,
Reserve Bank)
6 VOL 24 • NO 1 • MAY 2021
AA - P105-136 LACTO DATA.indd 6 2021/04/16 14:01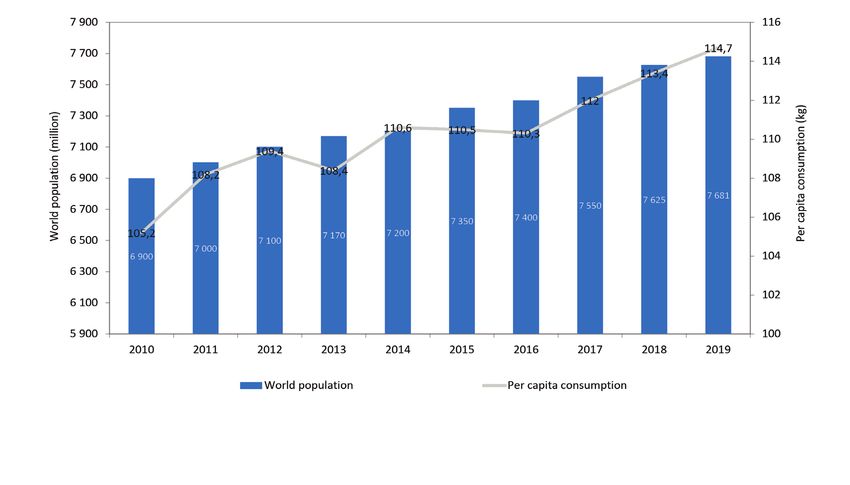
L ACTO DATA

          resulted in an explosion in the prices of butter,        International unprocessed milk
          cheese, and full-cream milk powder (FMP).                producer prices
             The start of 2021 saw hardened dairy product          The calculated average monthly unprocessed
          prices due to robust import demand, with                 milk price for Europe in December 2020 was
          tight export availability being reinforced by the        €0,35 (R6,27) per litre of standardised milk.
          seasonal decline in production in Oceania.               During 2020, the average unprocessed milk
             During 2020, the trading price range for butter       price in Europe decreased by 2%, compared to
          was between US$3 406 (R56 914) and US$4 269              2019. There was little difference in the average
          (R71 463), a 25% variance between the highest            unprocessed milk price in Europe (in euros) from
          and lowest prices. The butter price in January           January 2020 to December 2020; it basically
          2021, increased to US$4 625 (R70 023), a rise of         moved sideways. In January 2020, the price was
          17% on January 2020.                                     €0,34 (R5,62) and in December 2020, €0,35
             Through 2020, the trading price of SMP was            (R6,27) per litre. In rand terms, however, the
          between US$2 488 (R46 202) and US$3 031                  price increased by 12%, illustrating the effect of
          (R45 556), a 22% variance between the highest            the depreciated rand. Over the same period, the
          and lowest prices. The SMP price in January 2021         average unprocessed milk price in South Africa
          climbed to US$3 200 (R48 448), an increase of            increased by 15%, from R4,50 to R5,19.
          6,1% on January 2020.                                       Although the dairy market has improved,
             The trading price range of FMP during 2020            as shown by the higher price quotations of
          was between US$2 694 (R48 788) and US$3 263              dairy commodities in January 2021, the picture
          (R54 623), a 21% variance between the highest            of unprocessed milk prices in January and
          and lowest prices. The FMP price in January 2021         February is mixed. For example, according to
          increased to US$3 338 (R50 530), a rise of 6,4% on       early indications, the unprocessed milk price
          January 2020.                                            for January and February 2021 decreased in
             During 2020, the trading price range of               Denmark, increased in Belgium, and remained
          cheddar was between US$3 531 (R60 839) and               unchanged in the United Kingdom (UK).
          US$4 500 (R83 565), a 27% variance between the
          highest and lowest prices. The cheddar price in          World production of unprocessed milk
          January 2021 increased to US$4 063 (R61 506), a          During 2019, global unprocessed milk production
          2,4% escalation on January 2020.                         (cow’s milk 81%, buffalo milk 15%, and goat’s,

          Table 1 International calculated standardised unprocessed milk producer prices,
          2015–2020 (R/ℓ) (source: LTO Nederland. Based on 4,2% fat-corrected milk. For a detailed
          definition of LTO-standardised calculated price, see milkprices.nl. Exchange rates: Reserve
          Bank monthly middle rates)
              Country             Jan 2015   Jan 2016   Jan 2017    Jan 2018     Jan 2019    Jan 2020    Dec 2020

           Belgium                  3,85       4,55       4,60         4,32         5,17        5,05        5,36

           Germany                  3,72       4,72       4,18         5,04         5,14        4,76        6,12

           Denmark                  3,82       4,51       4,45         5,06         5,17        4,83        6,22

           France                   4,38       5,55       4,42         4,89         5,51        5,19        6,40

           Great Britain            4,69       5,29       4,08         5,04        5,32         5,05        6,14

           Ireland                  3,95       4,41       4,09         5,20         5,11        4,76        6,15

           Netherland               3,84       4,90       4,41         5,23        5,65         5,15        6,37

           New Zealand              3,26       3,66       4,38         4,49        4,74         5,05        5,79

           United States            4,47       5,55       5,23         4,21        4,90         5,63        5,97

           South Africa*            4,45       4,11       4,65         5,00         4,15        4,50        5,19
          *Based on MPO price survey

                                                                                  VOL 24 • NO 1 • MAY 2021 7

AA - P105-136 LACTO DATA.indd 7                                                                                    2021/04/16 14:01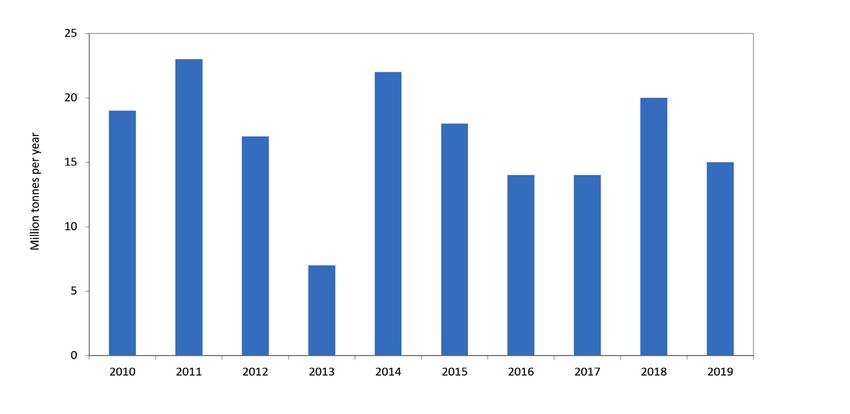
Figure 4 Global milk production per species, 2013–2019 (source: IDF Bull. 506/2020)

         Figure 5 Cattle cow’s milk production per region, 2011–2019 (source: IDF Bull. 506/2020)

          Table 2 Milk production growth: 2016 compared to 2015, 2017 compared to 2016, 2018
          compared to 2017, 2019 compared to 2018, and 2020 compared to 2019 (source: CLAL,
          2020)
           Country                2016/2015   2017/2016     2018/2017    2019/2018     2020/2019
           Australia               −6,2%        +0,0%         +2,7%        −6,6%         +2,8%
           European Union          +0,3%        +2,2%         +1,8%        +0,5%         +1,6%
           New Zealand             −2,0%        +1,7%         −0,6%        −0,7%         +0,4%
           United States            +1,6%       +1,7%          +1,1%       +0,4%         +2,1%
           Uruguay                 −10,3%       +6,3%         +6,3%        −4,2%         +5,8%
           Argentina               −12,8%       −1,6%         +6,8%        −1,8%         +7,4%

          8 VOL 24 • NO 1 • MAY 2021

AA - P105-136 LACTO DATA.indd 8                                                                     2021/04/16 14:01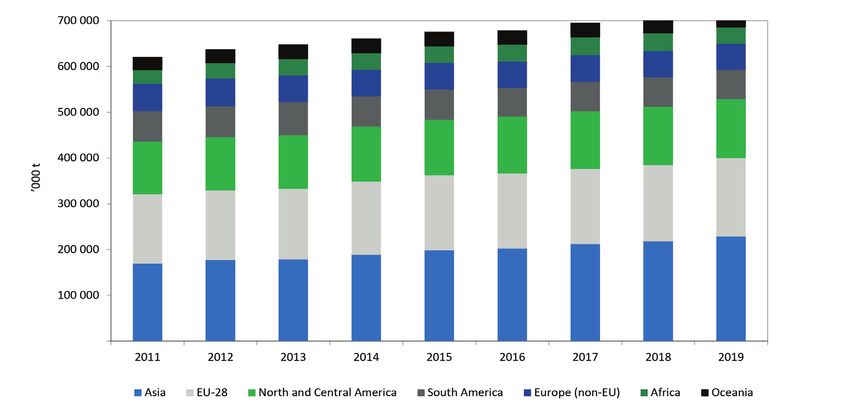
L ACTO DATA
sheep’s, and camel’s milk 4%, combined) (0,8% per annum) is slightly higher than the
remained on a steady growth path of 2,2%, projected average yield growth (0,7%), as cow
totalling 902 million tonnes solid corrected herds are expected to expand faster in countries
milk (SCM). Underlying growth factors have been with low yield. India and Pakistan, important
consistent over the past few years. Production milk producers, are expected to contribute
in the milk-deficient regions in Asia and other more than half the growth in world production
emerging dairy markets was pushed forward by of unprocessed milk over the next ten years,
strong local demand growth, as well as favourable and will account for more than 30% of world
average unprocessed milk prices. The other production in 2029. Production by the second
growth factor is buffalo milk production, which largest milk producer, the European Union (EU),
experienced an annual growth rate of 4% over the is expected to grow more slowly than the world
period 2010–2019, more than twice the growth rate average, due to environmental restrictions and
of cow’s milk at 1,9% (source: IDF Bull. 506/2020). limited domestic demand growth.
Milk production in the major dairy export
countries improved significantly in 2020, com Manufacturing of dairy products globally
pared to 2019. As domestic consumption of During 2019, the total output of dairy products
dairy products in these countries is stable, the showed limited growth, compared to the long-
availability of fresh dairy products and processed term trend, due to lower growth in deliveries.
products for export increased. Output growth differed significantly between
The OECD–FAO Agricultural Outlook 2020– product categories. Global production of packaged
2029 report predicts world production of un milk fell in 2019, for a second consecutive year
processed milk to grow at 1,6% per annum over (−0,3%), whereas it had grown by 1,1% per year,
the projection period (to 997 million tonnes by on average, since 2010. China’s production rose
2029, faster than most other main agricultural again (1,3%), Indian cooperatives’ production kept
commodities). In contrast to the previous growing (3,8%), while liquid milk production
decade, the projected growth of cow herds declined in most western countries and Russia.
Table 3 Major dairy companies, 2019 (source: IDF Bull. 506/2020)
Dairy turnover
Rank Company name Country
US$ billion
1 Lactalis France 22,4
2 Dairy Farmers of America United States 15,9
3 Danone France 14,8
4 Fonterra New Zealand 13,5
5 Nestlé Switzerland 13,4
6 Yili China 13,1
7 Friesland Campina Netherlands 12,6
8 Arla Foods Denmark 11,8
9 Mengniu China 11,4
10 Saputo Canada 11,2
11 DMK Germany 6,5
12 Sodiaal France 5,7
13 Savencia France 5,6
14 Agropur Canada 5,5
15 Amul India 5,4
16 Kraft Heinz United States 5,3
17 Morinaga Milk Industry Japan 5,3
18 Müller Germany 5,1
19 Schreiber Foods United States 5,0
20 Megmilk Snow Brand Japan 4,8
VOL 24 • NO 1 • MAY 2021 9
AA - P105-136 LACTO DATA.indd 9 2021/04/16 14:01
The butter and other milk fats market grew by Global production of condensed and evapo
3% in 2019, in line with the average growth rate rated milk was estimated at 5 million tonnes in
since 2010. Production is dominated by India, 2019. The market is dominated by the US, where
who alone accounts for 53% of the world’s dairy output continued its negative trend. The EU in-
fat production. creased output by 3,5%, returning to the same
Total global cheese production was estimated level as in 2015. Liquid whey is mostly a cheese
slightly under 24 million tonnes for 2019 (ex manufacturing by-product, produced in the lead-
cluding processed cheese), and grew by 1,4%, ing cheese-producing countries in the world.
significantly under the average long-term growth According to the OECD-FAO Agricultural
rate of 2,2% since 2010. The EU accounts for 44% Outlook 2020–2029 report, the fight against the
of global cow’s milk cheese production and the global COVID-19 pandemic is causing unprece
US for 27%. In 2019, cheese output increased dented uncertainties in global food supply
by 1,2% in the EU and 0,8% in the US. Brazil chains. The report finds that, over the next
consolidated its position as the third largest ten years, supply growth is going to outpace
producer of cheese, increasing output by 2,4%. demand growth, causing real prices of most
In 2019, WMP production dropped by 2,2%, commodities to remain at or below their current
down to 4,68 million tonnes. It is the first decrease levels. Fluctuations in the driving factors of
since 2016. Production in New Zealand, the supply and demand could lead to strong price
main producer in the world, increased by 3,4%, variations around this general path. At the same
while production in China (the second largest
“Total global cow’s milk cheese
producer) declined by 13,0%.
The world’s SMP production remained at
4,8 million tonnes in 2019 (0,1% increase on
2018). The EU increased production slightly, by
production was estimated at
0,4%, and the US by 3,7%, while output in New 24 million tonnes in 2019,
Zealand and Australia reduced by −8,5% and
25,6%, respectively. excluding processed cheese.
”
10 VOL 24 • NO 1 • MAY 2021
AA - P105-136 LACTO DATA.indd 10 2021/04/16 14:01L ACTO DATA
time, a decrease in disposable incomes in low- Consumption of dairy products
income countries and households, caused by Per capita consumption of dairy products in 2019
the COVID-19 pandemic, is expected to depress increased by 1,2% to 114,7 kg dairy products per
demand in the early years of this outlook and capita, in milk equivalent. The global annual per
could further undermine food security. European capita consumption does not reflect the regional
domestic consumption is declining, as changes differences in consumption patterns. Although
in diet lead to lower per capita consumption. this can be explained by the difference in income
The picture is similar in the US (−2,0%) and, to a per capita, whether regionally or per country,
lesser extent, in Canada (−0,6%), also due to a fall there is a broad range of consumer habits and
in consumption. trends. For example, more milk and fermented
Figure 6 World population and per capita consumption of dairy products, 2010–2019
(source: IDF Bull. 506/2020)
Figure 7 Annual increase in dairy demand, 2010–2019 (source: IFCN Dairy Report, 2020)
VOL 24 • NO 1 • MAY 2021 11
AA - P105-136 LACTO DATA.indd 11 2021/04/16 14:01Figure 8 Percentage breakdown of global dairy consumption, 2018 (source: IDF Bull.
501/2019)
-
Figure 9 Share of key exporting countries in total trade in dairy products (milk equivalent
basis), 2015, 2016, 2017, 2018, and 2019 (source: IDF Bull. 506/2020)
12 VOL 24 • NO 1 • MAY 2021
AA - P105-136 LACTO DATA.indd 12 2021/04/16 14:01L ACTO DATA
products are consumed in India than in some EU-intra trade) in 2019 was somewhat limited
European countries, but very little cheese, by stagnating milk production development
compared to the EU average. Annual average per in several leading dairy exporting regions.
capita consumption ranges from 42 kg in Africa Meanwhile, overall demand on international
to almost 275 kg in Europe and North America. markets increased, especially from milk-deficient
According to the IMF’s OECD–FAO Agricultural regions like Africa and Asia.
Outlook 2020–2029, demand for dairy products In 2019, the dairy market was largely
will continue to grow, backed by population up- determined by a strong recovery in protein prices,
swing, increasing income, and dietary changes. which quickly depleted the intervention stocks
The COVID-19 pandemic will introduce a lagged of SMP in Europe and helped normalise supply
effect to projections. An increase of 25% is ex- and demand mechanisms. Butterfat prices, on
pected in total dairy consumption between 2017 the other hand, were under pressure for most of
and 2029, with a higher pace for fresh products the year.
(30%) and butter (26%). Growth will be more In the same year, world dairy trade grew
sustainable in developing countries (2,5% per modestly by just over 1%, reaching a volume of
year) due to an increase in income and income 82,1 million tonnes milk equivalent. Since 2015,
per capita. On the other hand, in developed world trade has expanded by more than 9%
countries, dairy consumption is already high (7 million tonnes milk equivalent). Among the
and impacted by increasing sustainability and main traditional world trade categories, the
responsibility concerns, as well as rising competi- biggest growth was observed for butter and
tion from plant-based beverages and products. butter oil (3,9%), while cheese (2,8%) and WMP
(2,1%) also showed solid increases. Meanwhile,
International dairy trade SMP trade remained stagnant (−0,8%). A strong
The development of world trade (excluding growth was observed for milk and cream (11,5%).
VOL 24 • NO 1 • MAY 2021 13
AA - P105-136 LACTO DATA.indd 13 2021/04/16 14:01Table 4 Average herd size, selected countries, 2018 (source: IFCN 2019 for international
data, MPO survey 2019 for South African data)
Average number of cows in herd
Country (cows in herd = cows in milk plus
dry cows)
Saudi Arabia 7 139
South Africa 459
New Zealand 416
Australia 274
Czech Republic 239
United States 241
Denmark 204
Israel 186
Argentina 149
United Kingdom 148
Uruguay 136
Canada 92
Uganda 2
Kenya 2
India 2
Table 5 Unprocessed milk production for the top 10 milk-producing countries and South
Africa, 2019 (source: IFCN, 2020)
Country Milk produced (million tonnes SCM)
1 India 206
2 United States 96
3 Pakistan 47
4 Germany 34
5 Brazil 33
6 China 27
7 France 25
8 New Zealand 25
9 Turkey 18
10 Russian Federation 18
South Africa 3,4
SCM = solid corrected milk
14 VOL 24 • NO 1 • MAY 2021
AA - P105-136 LACTO DATA.indd 14 2021/04/16 14:01L ACTO DATA
International primary sector
MORE INFO
There are 118 million dairy farms worldwide, with
more than 59% of these in South Asia. With an
average per farm population of five, this implies that
590 million people live on dairy farms. Globally, the
World unprocessed milk
average dairy farmer milks three cows. Some of the production 2019
902 million
largest average herd sizes are found in Saudi Arabia,
New Zealand, and South Africa. In South Africa,
the average number of cows in a herd was 459 in tonnes scm
2018. Average herd sizes (cows in herd) for various [96% = cow’s milk + buffalo milk]
countries are shown in Table 4. After increasing to
125 million in 2013, dairy farm numbers are now
decreasing at a rate of 1,4% per year.
In 2018, 61% of all dairy animals were kept on
household farms, 22% on family farms, and 17%
on larger commercial farms. Household farms are
the dominant type in South Asia and Africa. In
Latin America, East Asia, and the EU, family farms
predominate, with the larger commercial farms
the dominant type in Oceanic countries and the SA produces
0,4% of
US. South African dairy farms also fall into the
commercial farm category.
global milk
“Globally, the average dairy production
farmer milks three cows. Some
of the largest average herd sizes
are found in Saudi Arabia, New
Zealand, and South Africa.
”
Cost of milk production internationally
This section is based on the analysis of typical dairy
farms within the International Farm Comparison
Network (IFCN). The IFCN is a network of dairy
experts in many countries who strive to create Main producing
a better understanding of milk production countries (2019 change)
worldwide.
Scientists from 100 countries contributed to
the work of the IFCN in 2020. The organisation INDIA (206 MILLION TONNES SCM)
analysed the production and cost of 120 typical
dairy farms in 52 countries and published the UNITED STATES (96 MILLION
results in the IFCN Dairy Report 2020. The TONNES SCM)
comparison of farms is based on the actual PAKISTAN (47 MILLION TONNES SCM)
income and cost figures for 2019. The MPO’s
participation in the work of the IFCN is financially GERMANY (34 MILLION TONNES SCM)
supported by Milk SA as part of the Economics
and Market Project of Milk SA. BRAZIL (33 MILLION TONNES SCM)
The IFCN’s cost comparisons are based on full
economic cost. Farm-produced feed is valued at a
VOL 24 • NO 1 • MAY 2021 15
AA - P105-136 LACTO DATA.indd 15 2021/04/16 14:01Figure 10 Estimated unprocessed milk production cost (US$/100 kg SCM) per average
farm in participating countries, 2019 (source: IFCN, 2020)
Figure 11 Estimated cost of unprocessed milk production per farm in US$/100 kg SCM for
average farms in IFCN analysis, 2019 (source: IFCN, 2020)
P&L – profit and loss account
Country by international country code and herd size, ZA 520 = ZA 520-cow herd.
16 VOL 24 • NO 1 • MAY 2021
AA - P105-136 LACTO DATA.indd 16 2021/04/16 14:01L ACTO DATA
farm-gate price and not at production cost levels, opportunity costs of labour and lower feed prices.
and the farmer’s own labour and management are the main drivers of cost competitiveness. In
time is valued at comparable industrial rates. most of these cases, milk is produced for own use
The inclusion of opportunity costs creates and not for the market.
a bias towards countries with very little or no
opportunity costs for labour and without a viable
market for feed. NEED TO KNOW
The average cost level of the 120 farms
evaluated by the IFCN in 2019 stood at US$41,90
(R604,58) per 100 kilograms of solid-corrected milk Feed costs and the efficient
(100 kg SCM), which is 4,2% lower than in 2018. See management of feeding practices
Table 6 for countries providing a mix of the have a big impact on total costs and
differences in cost.
play a huge role in determining cost
“Farm-produced feed is
competitiveness.
valued at a farm-gate price
and not at production cost
levels, and the farmer’s own
labour and management time
is valued at comparable
industrial rates.
”
Feed is the highest single cost component,
contributing about 60% to total cost. Feed
costs and the efficient management of feeding
practices have a big impact on total costs and play
a huge role in determining cost competitiveness.
Milk production costs for typical dairy farms, as
analysed by the IFCN, are shown in Figure 11. In
countries with very low milk production costs, low
Table 6 The following countries provide a mix of the differences in the cost of unpro-
cessed milk production and the change from 2018 to 2019 (source: IFCN, 2020)
2018 2018 2019 2019
US$ per R per US$ per R per Increase/
Country
100 kg 100 kg 100 kg 100 kg decrease
SCM SCM SCM SCM
France 40,26 533,45 40,09 579,30 decrease
United States 39,39 521,92 39,16 565,86 decrease
Uruguay 31,18 413,13 28,88 417,32 decrease
China 53,20 704,90 51,71 747,21 decrease
New Zealand 29,37 389,15 29,48 412,85 increase
Australia 30,48 403,86 33,31 481,33 increase
VOL 24 • NO 1 • MAY 2021 17
AA - P105-136 LACTO DATA.indd 17 2021/04/16 14:01Figure 12 Estimated producer milk prices in various regions (US$/100 kg SCM), 2019
(source: IFCN, 2020)
18 VOL 24 • NO 1 • MAY 2021
AA - P105-136 LACTO DATA.indd 18 2021/04/16 14:01L ACTO DATA
International producer price of
unprocessed milk
The IFCN world milk price indicator of unprocessed
milk stood at an average level of US$37,3 (R538,98)
per 100 kg SCM in 2019, which is an increase of
8,9% over the previous year. After reaching a peak
of US$42,1 (R608,34) per 100 kg SCM, it dropped
to a level of US$36,0 (R520,20) per 100 kg SCM,
before climbing to US$37,4 (R540,43) per 100 kg
SCM in December 2019.
During 2019, the performance of the milk
price was essentially a continuation of the zigzag
trend observed in the price since 2016. The IFCN
identified three key factors responsible for the
price increase in 2019.
Firstly, unprocessed milk supply growth was MORE INFO
very low in 2019. In most of the key exporting
countries, unprocessed milk production deceased
or grew only marginally due to drought and
other adverse climatic conditions. Oceania was
impacted negatively and South Asia experienced LOWEST and
lower than normal rainfall. These conditions HIGHEST cost countries
resulted in lower unprocessed milk availability,
which, in turn, stimulated the world milk price for in the world
unprocessed milk.
“The IFCN world milk price Top 5 lowest cost
indicator of unprocessed milk
CAMEROON
stood at an average level of
UGANDA
US$37,3 (R538,98) per
100 kg SCM in 2019, which is UKRAINE
an increase of 8,9% over the ARMINIA
previous year.
” BELARUS
5 highest cost
Secondly, the IFCN world price for unprocessed
milk continued to be boosted by the strong
demand for fat in 2019, which becomes visible
Top
in the premium price for butter and cheese as SWITZERLAND
traded diary commodities. The price for butter
and cheese rose at the start of 2019. Although JAPAN
the price spread narrowed towards the end
of 2019, the strong demand and price for fat FINLAND
impacted positively on the world price.
Thirdly, considering the poor supply growth AUSTRIA
and strong demand growth, the question is,
why did the world milk price not react stronger?
NORWAY
Total supply, inclusive of carry-over stocks, was
adequately in balance with total demand.
VOL 24 • NO 1 • MAY 2021 19
AA - P105-136 LACTO DATA.indd 19 2021/04/16 14:01SOUTH AFRICAN SITUATION
The COVID-19 pandemic that caused major
disruptions in most markets had a limited
NEED TO KNOW
effect in the South African dairy market. Some
specific dairy products were affected, but most
dairy products performed well, under the
circumstances. The value chain, starting at input
suppliers right through to the retail segment, Number of producers
succeeded in satisfying market demand. Where
consumer demand shifted away from some dairy
(43%)
products to other dairy products because of the
restriction on human movement, role players
Jan 2015 Jan 2021
downstream from the farmer were nimble and 1 834 1 053
dynamic enough to channel unprocessed milk
towards those dairy products. The end result is
that all milk was absorbed into the market and Milk production
utilised toward nutrition.
The latest market research conducted in
(26%)
2020, indicates that growth in the quantity of
dairy sales for the products being monitored
2011 2020
are solid, with the exception of fresh milk and 2 720 000 t 3 427 000 t
flavoured milk, registering negative growth for
all the time periods being measured in 2020.
Dairy product price movements are mostly Milk production per
negative when comparing nearer months with producer
each other, which could be the result of the
weakening of the South African economy.
(220%)
2011 2020
South African primary dairy sector
Structure of the primary dairy sector 1 013 t 3 241 t
The number of milk producers in South Africa
decreased from 1 834 in January 2015 to 1 053
Table 7 Number of milk producers per province, January month, 2015–2021 (source: MPO)
Province 2015 2016 2017 2018 2019 2020 2021
Western Cape 533 502 481 419 402 379 348
Eastern Cape 262 251 244 212 201 206 172
Northern Cape 14 14 7 7 6 4 4
KwaZulu-Natal 267 253 247 221 212 208 207
Free State 328 280 249 206 165 145 130
North West 222 181 165 135 117 100 84
Gauteng 100 97 98 84 83 65 56
Mpumalanga 94 93 87 69 56 50 46
Limpopo 14 12 15 12 11 7 6
TOTAL 1 834 1 683 1 593 1 365 1 253 1 164 1 053
20 VOL 24 • NO 1 • MAY 2021
AA - P105-136 LACTO DATA.indd 20 2021/04/16 14:01L ACTO DATA
Figure 13 Unprocessed milk production density (ℓ/km2) per district, 2016 (source: MPO
estimates from October 2016 statutory survey)
0–2
2,1–5
5,1–10
10,1–15
15,1–25
25,1–50
50,1–120
120,1–200
200,1–350
Figure 14 Size distribution of dairy cows per herd, 2020 (source: MPO October 2020 statutory
survey)
VOL 24 • NO 1 • MAY 2021 21
AA - P105-136 LACTO DATA.indd 21 2021/04/16 14:01Figure 15 Cow density per district (cows/km2), 2016 (source: MPO estimates from October
2016 statutory survey)
0–0,2
0,3–0,4
0,5–0,7
0,8–1
1,1–2
2,1–4
4,1–7
7,1–10
10,1–17,5
Figure 16 Distribution of herds based on daily production per cow in herd, 2017–2020
(source: MPO October 2020 statutory survey)
Average daily yield (litres) per cow in a herd, for yield category
22 VOL 24 • NO 1 • MAY 2021
AA - P105-136 LACTO DATA.indd 22 2021/04/16 14:01L ACTO DATA
in January 2021. The number of producers per
province is shown in Table 7. Since 2015, this
NEED TO KNOW
number has decreased by 43%. The largest
percentage decrease in producer numbers
occurred in the Northern Cape.
The trend towards higher production
in pasture-based areas has continued. The
concentration of milk production per district is
shown in Figure 13. Milk production per province,
according to the MPO’s estimates, considering
the results of the October 2020 statutory survey, is
shown in Table 8.
Cow numbers vary widely among producers.
The percentage distribution of herd size is shown
in Figure 14. Milk production per
The average number of cows in milk per province, 2020 (%)
producer in the different provinces is shown in
Table 8, and the concentration of cows per district h Western Cape 31,0
in Figure 15. h Eastern Cape 26,2
Average milk production per cow per day was
h Northern Cape 0,0
18,1 ℓ in 2019. Ninety-nine per cent of unprocessed
milk was delivered to the market. The balance was h KwaZulu-Natal 27,0
used for on-farm consumption. The distribution h Free State 5,9
of herds on a production basis is shown in
Figure 16. h North West 2,1
h Gauteng 4,1
Milk production
h Mpumalanga 3,2
Annual milk production shows a steady linear
upward trend over time. The total milk to market h Limpopo 0,4
for 2020 is 3 427 000 t, down 0,16% from the
Table 8 Unprocessed milk production per province, and cows in herd per producer, spe-
cific month in specific year (source: MPO from October 2020 statutory survey)
Percentage distribution of milk Number of cows in herd per
Province production producer, 2020
Sep 2009 Oct 2020 Average
Western Cape 27,1 31,0 438
Eastern Cape 25,0 26,2 880
Northern Cape 0,4 0,0 107
KwaZulu-Natal 19,8 27,0 732
Free State 14,0 5,9 258
North West 5,3 2,1 154
Gauteng 3,4 4,1 361
Mpumalanga 4,5 3,2 285
Limpopo 0,3 0,4 271
TOTAL 100,0 100,0 510
VOL 24 • NO 1 • MAY 2021 23
AA - P105-136 LACTO DATA.indd 23 2021/04/16 14:01previous year (December 2020). Monthly milk climatic conditions prevailing over certain parts
purchases in 2017 to July 2020 are shown in of South Africa. Summer rain was late in 2020.
Figure 17. The cost-price squeeze farmers experienced,
The growth in the intake of unprocessed due to high levels of grain prices (yellow maize
milk for 2020 was subdued, due to farm and soya), deepened the level of negative farm
economics being under pressure and adverse economics.
Figure 17 South African monthly unprocessed milk purchases 2018–2021 (source: Milk SA)
*Estimate based on Milk SA sample
Figure 18 Annual unprocessed milk purchases, 2010–2020 (source: Milk SA)
24 VOL 24 • NO 1 • MAY 2021
AA - P105-136 LACTO DATA.indd 24 2021/04/16 14:01L ACTO DATA
Table 9 Farm requisite price indices, base 2010 = 100 (source: DAFF)
Material Intermediate
Machinery and All farming
Period for fixed goods and
implements requisites
improvements services
2012 123,0 115,5 126,3 125,4
2013 132,2 122,5 134,9 134,0
2014 142,5 129,5 142,9 142,3
2015 150,2 138,9 147,4 147,3
2016 162,6 149,1 155,7 156,2
2017 169,1 155,6 162,5 162,9
2018 177,1 164,4 168,5 169,2
2019 183,0 171,9 174,2 175,1
CAGR*
2012– 5,8% 5,9% 4,7% 4,9%
2020
Jan ’15 145,9 137,9 144,2 144,1
Apr ’15 148,7 146,7 146,1 146,5
Jul ’15 150,4 138,5 148,5 147,9
Oct ’15 159,4 138,9 149,8 150,4
Jan ’16 157,8 144,5 152,0 152,0
Apr ’16 161,2 154,5 154,5 155,3
Jul ’16 161,8 148,7 156,9 157,1
Oct ’16 171,8 148,7 159,3 160,3
Jan ’17 164,8 150,0 159,9 160,0
Apr ’17 166,1 163,7 158,7 159,8
Jul ’17 166,7 154,1 163,0 163,0
Oct ’17 178,9 154,8 168,5 169,0
Jan ’18 171,0 156,5 165,8 166,0
Apr ’18 169,3 170,0 162,9 164,1
Jul ’18 179,2 166,2 170,8 171,6
Oct ’18 186,5 164,6 175,2 175,5
Jan ’19 178,3 163,5 171,8 172,1
Apr ’19 176,9 179,9 169,3 170,7
Jul ’19 186,1 173,7 175,2 176,4
Oct ’19 190,7 170,4 180,6 181,3
Jan ’20 179,5 169,9 178,6 178,3
Apr ’20 183,6 174,9 173,0 173,6
CAGR*
Jan ’15– 1,10% 1,14% 0,87% 0,89%
Apr ’20
*Compound annual growth rate
VOL 24 • NO 1 • MAY 2021 25
AA - P105-136 LACTO DATA.indd 25 2021/04/16 14:01Figure 19 Composition of the South African liquid products market on a volume basis,
2020 (source: industry estimate supplied by Milk SA)
Figure 20 Composition of the South African concentrated products market on a mass
basis, 2020 (source: industry estimate supplied by Milk SA)
26 VOL 24 • NO 1 • MAY 2021
AA - P105-136 LACTO DATA.indd 26 2021/04/16 14:01L ACTO DATA
South African secondary dairy sector
NEED TO KNOW
Structure of the secondary dairy sector
The South African secondary dairy industry
consists of a few large processors operating
nationally, a growing number of processors who Number of producers-distributors
operate in more than one region, a large number (39%)
of smaller processors who operate in specific
areas, and a number of milk producers who sell Jan 2015 Jan 2021
their own produce to retailers and consumers
– known as producer-distributors (PDs). The
110 67
number of PDs and milk buyers (processors) per
province is shown in Table 10. Number of milk processors
From January 2015 to January 2021, the
number of producer-distributors de creased by
(18%)
39% and milk buyers by 18% over the same period. Jan 2015 Jan 2021
Production and consumption 160 132
In 2019, the South African dairy products
market was divided into 62% liquid and 38%
Dairy market composition
concentrated products. Pasteurised liquid milk
and ultra-high temperature (UHT) processed 62% liquid
milk were the major liquid products, with hard
2020
cheese the main concentrated product. The
38% concentrated
estimated composition of the markets for liquid
and concentrated products is shown in Figure 19
and 20.
Table 10 Number of producer-distributors (PDs) and processors (Proc) per province
(indicated according to position of head office), as registered with Milk SA, Jan 2015–Jan
2021 (source: Milk SA)
Jan 2015 Jan 2016 Jan 2017 Jan 2018 Jan 2019 Jan 2020 Jan 2021
Province
Proc PD Proc PD Proc PD Proc PD Proc PD Proc PD Proc PD
Eastern Cape 12 15 13 14 12 13 8 9 9 7 9 7 7 6
Free State 15 11 13 10 13 9 12 7 12 7 12 6 11 4
Gauteng 51 21 48 21 46 22 42 17 39 15 40 15 39 16
KwaZulu-Natal 16 9 18 10 21 10 20 8 20 7 19 7 19 7
Limpopo 4 7 4 8 4 9 4 10 3 10 4 10 4 11
Mpumalanga 6 9 6 9 6 8 5 9 4 8 4 8 4 7
North West 16 4 16 4 14 4 11 3 11 3 10 1 11 2
Northern Cape 1 9 1 8 1 8 1 7 2 6 2 3 2 2
Western Cape 39 25 39 24 38 23 35 18 31 14 33 12 35 12
Total 160 110 158 108 145 106 138 88 131 77 133 69 132 67
Milk processors refer to producers of processed milk and manufacturers of other dairy products.
Producer-distributors (PDs) refer to producers who sell their own produce to retailers and consumers.
VOL 24 • NO 1 • MAY 2021 27
AA - P105-136 LACTO DATA.indd 27 2021/04/16 14:01Imports and exports
Total dairy product imports and exports are shown exports in 2020 is shown in Figure 23 and Figure
in Figure 21 and Figure 22. In 2020, 60 600 tonnes 24. On a mass basis, milk and cream were the
of products were imported and 46 700 tonnes most important products being exported, while
exported. The total composition of imports and whey was the most important product imported.
Figure 21 Dairy product imports and exports, 2011–2020 (source: SARS data, as supplied by
SAMPRO)
Figure 22 Dairy product imports and exports on milk-equivalent basis, 2011–2020
(source: SARS data, as supplied by SAMPRO)
28 VOL 24 • NO 1 • MAY 2021
AA - P105-136 LACTO DATA.indd 28 2021/04/16 14:01L ACTO DATA
Figure 23 Percentage composition of imports on a mass basis, 2020 (source: SARS data, as
supplied by SAMPRO)
Figure 24 Percentage composition of exports on a mass basis, 2020 (source: SARS data, as
supplied by SAMPRO)
VOL 24 • NO 1 • MAY 2021 29
AA - P105-136 LACTO DATA.indd 29 2021/04/16 14:01Figure 25 Price index of unprocessed milk at farm level, dairy products at processor level,
and milk and eggs at consumer level, Jan 2012–Feb 2021 (source: Stats SA)
Figure 25 shows the trend in the price indices The Nielsen Company provides information
of unprocessed milk at farm level, dairy products based on monthly surveys of the retail sales of
at processor level, and milk, cheese, and eggs at milk and other dairy products. Non-retail sales,
consumer level. For most of the period, prices such as sales to wholesalers and industrial buyers,
follow the same general trend, but since the which form significant parts of the total sales of
end of 2017, the indices for unprocessed milk dairy products, are not part of the Nielsen surveys.
(farmer prices) developed a different trend and The sales quantities of both fresh milk and
the magnitude of negative price changes for this flavoured milk decreased in all five of the different
index resulted in it significantly lagging behind periods. Sales quantities of the other seven dairy
the other indices. products increased in all of the five different
During 2020, this index managed to increase periods. Of the eight general food products
by 10,6%, from December 2019 to December measured, the sales quantity of maize meal and
2020, and increased by 18,1% from December short-life juice decreased in all five periods. The
2020 to January 2021. Over the same time period, sales quantities for bread and rice decreased in
the producer price indices for dairy products the periods for one month, three months, and six
only increased by 1,6%. The index peaked in months.
May 2020 at 151,6 index points (up by 6,0% from The average retail price of all nine dairy products
December 2019), but then started falling back for the 12-month period from September 2019
and reduced to 145,3 index points in December to September 2020 increased, with six products
2020, down by 4,2%. During 2020, the consumer increasing by an amount less than inflation.
price index (CPI) for milk, cheese, and eggs The average retail price of all eight general
managed to increase by 6,4%, from December food products for the 12-month period from
2019 to December 2020. The index exhibited a September 2019 to September 2020 increased.
continuous positive growth trend, with only one One of the general food products increased by an
month reducing marginally. amount less than inflation.
Tables 11 to 14 indicate trends of retail sales The sales quantities for yoghurt and pre-
(quantity and average price) of nine dairy packed cheese over the 12-month period from
products and eight other generally used food October 2018 to September 2019 versus October
products (consisting of four starch products, one 2019 to September 2020, increased the most,
fat product, and three beverages), as reported by by 10,1% and 14%, respectively. The average
Nielsen South Africa and collated by SAMPRO. retail price of two products, yoghurts and pre-
30 VOL 24 • NO 1 • MAY 2021
AA - P105-136 LACTO DATA.indd 30 2021/04/16 14:01L ACTO DATA
packed cheese, increased, by only 3,2% and 2,4%, increased the most for the general food products,
respectively, for the 12-month period September by 12,2% and 10,6%, respectively. The average
2019 to September 2020. retail price of the two products, coffee and tea,
Sales quantities for coffee and tea over the increased by 7,3% and 1,8%, respectively, for the
12-month period from October 2018 to September 12-month period September 2019 to September
2019 versus October 2019 to September 2020, 2020.
Table 11 Changes in quantities of retail demand of specific dairy products (source: Nielsen
as supplied by SAMPRO)
Sales in the Sales in the Sales in the Sales in the
3 months 6 months 9 months 12 months
Sales in from from from from
the month Jul ’20– Apr ’20– Jan ’20– Oct ’19–
of Sept ’20 Sep ’20 Sept ’20 Sept ’20 Sept ’20
Product versus sales versus versus versus versus sales
in the month sales in the sales in the sales in the in the
of Sept ’19 3 months 6 months 9 months 12 months
from Jul ’19– from Apr ’19– from Jan ’19– from Oct ’18–
Sept ’19 Sept ’19 Sept ’19 Sept ’19
Fresh milk −10,5 −8,5 −8,9 −7,8 −6,2
Ultra-high
temp erature 9,5 12,3 12,4 9,6 5,5
treated milk
Flavoured milk −13,3 −17,8 −14,8 −12,7 −10,6
Yoghurt 5,1 9,5 13,7 10,9 10,1
Maas 3,6 5,4 8,3 9,1 9,6
Pre-packaged
16,2 16,4 19,4 16,8 14,0
cheese
Cream cheese 3,8 7,7 10,1 5,9 3,6
Butter 13,0 16,6 16,0 10,9 7,8
Cream 14,8 15,3 19,1 11,0 6,4
Table 12 Changes in the average retail prices of specific dairy products (source: Nielsen as
supplied by SAMPRO)
Sept ’20 Sept ’20 Sept ’20 Sept ’20 Sept ’20 Sept ’20 Sept ’20
versus versus versus versus versus versus versus
Product Aug ’20 Jun ’20 Mar ’20 Dec ’19 Sept ’19 Mar ’19 Sept ’18
(1 month (3 months (6 months (9 months (12 months (18 months (24 months
ago) ago) ago) ago) ago) ago) ago)
Fresh milk −0,3 −0,5 0,5 1,8 2,4 5,8 8,0
Ultra-high
temperature −1,4 −1,1 5,5 7,6 2,9 12,6 17,2
treated milk
Flavoured
−1,4 −2,0 1,2 12,0 0,5 6,6 9,6
milk
Yoghurt −0,1 1,5 0,8 8,6 3,2 2,9 5,6
Maas −0,6 −1,6 −1,6 2,2 0,8 3,0 2,8
Pre-packaged
−1,8 −0,9 1,5 3,5 2,4 3,7 8,3
cheese
Cream cheese −1,1 −1,9 4,5 5,4 6,4 9,6 9,6
Butter −1,7 2,2 −1,7 11,3 7,9 8,2 6,7
Cream 0,2 −0,4 0,5 0,6 2,4 10,8 11,4
VOL 24 • NO 1 • MAY 2021 31
AA - P105-136 LACTO DATA.indd 31 2021/04/16 14:01Table 13 Changes in quantities of retail demand of other products (source: Nielsen as
supplied by SAMPRO)
Sales in the Sales in the Sales in the Sales in the
3 months 6 months 9 months 12 months
Sales in
from from from from
the month
Jul ’20– Apr ’20– Jan ’20– Oct ’19–
of Sept
Sept ’20 Sept ’20 Sept ’20 Sept ’20
Product ’19 versus
versus versus versus versus sales
sales in the
sales in the sales in the sales in the in the
month of
3 months 6 months 9 months 12 months
Sept’19
from Jul ’19– from Apr ’19– from Jan ’19– from Oct ’18–
Sept ’19 Sept ’19 Sept ’19 Sept ’19
Instant cereal 6,4 7,5 8,6 8,8 7,8
Bread −6,5 −4,0 −1,2 1,1 1,5
Rice −9,2 −3,1 −3,2 2,0 3,2
Maize meal −4,5 −0,9 −3,6 −1,5 −1,8
Margarine 6,4 8,8 11,4 11,4 9,5
Tea 10,2 13,7 14,7 13,8 10,6
Coffee 11,0 13,8 13,0 13,6 12,2
Short-life juice −21,5 −16,4 −15,2 −11,9 −9,5
Table 14 Changes in the average retail prices of other products (source: Nielsen as
supplied by SAMPRO)
Sept ’20 Sept ’20 Sept ’20 Sept ’20 Sept ’20 Sept ’20 Sept ’20
versus versus versus versus versus versus versus
Product Aug ’20 Jun ’20 Mar ’20 Dec ’19 Sept ’19 Mar ’19 Sept ’18
(1 month (3 months (6 months (9 months (12 months (18 months (24 months
ago) ago) ago) ago) ago) ago) ago)
Instant cereal −0,9 −0,5 −0,3 6,4 3,4 5,5 13,3
Bread 0,2 3,9 6,8 9,6 7,9 5,9 13,3
Rice 3,0 10,9 24,4 34,9 32,8 32,3 37,1
Maize meal −1,1 −5,5 −1,9 4,0 6,2 12,7 30,6
Margarine −1,2 −2,2 4,6 5,2 3,5 3,5 7,3
Tea 0,8 1,3 −0,2 7,2 1,8 1,6 5,9
Coffee 1,7 5,8 0,8 15,1 7,3 1,1 9,3
Short-life juice −0,3 5,1 7,4 13,6 8,8 15,7 14,8
ACRONYMS AND ABBREVIATIONS
CAGR compound annual growth rate OECD - FAO Organization for Economic Co-operation and
DALRRD Department of Agriculture, Land Reform and Rural Development and the Food and Agricultural
Development Organization of the United Nations
EU European Union PD producer-distributor
FAO Food and Agricultural Organization of the United SAMPRO South African Milk Processors’ Organisation
Nations SARS South African Revenue Service
FMP full-cream milk powder SCM solid-corrected milk
FOB free on board SMP skimmed milk powder
IDF International Dairy Federation t tonnes (a metric tonne, equal to 1 000 kilograms)
IFCN International Farm Comparison Network UHT ultra-high temperature
IMF International Monetary Fund UK United Kingdom
LTO Nederland Land- en Tuinbouw Organisatie US United States
(Dutch Federation of Agriculture and Horticulture) USDA Unites States Department of Agriculture
Milk SA Milk South Africa WEO World Economic Outlook
MPO Milk Producers’ Organisation WMP whole milk powder
AA - P105-136 LACTO DATA.indd 32 2021/04/16 14:01You can also read