Using Machine Learning Algorithms for Housing Price Prediction: The Case of Islamabad Housing Data
←
→
Page content transcription
If your browser does not render page correctly, please read the page content below
Soft Computing and Machine Intelligence Journal, Vol (1), Issue (1), 2021

Using Machine Learning Algorithms for Housing Price
Prediction: The Case of Islamabad Housing Data
Imran 1,∗ , Umar Zaman 2 ,Muhammad Waqar1 and Atif Zaman 1
 1   Department of Computer Science, Bahria University Islamabad, Pakistan
 2   Department of Computer Science, Iqra University Islamabad, Pakistan
 *   Correspondence: imranjejunu@gmail.com; Tel.: ***-****-****

 Abstract: House price prediction is a significant financial decision for individuals
working in the housing market as well as for potential buyers. From investment to
buying a house for residence, a person investing in the housing market is interested in the
potential gain. This paper presents machine learning algorithms to develop intelligent
regressions models for House price prediction. The proposed research methodology
consists of four stages, namely Data Collection, Pre Processing the data collected and
transforming it to the best format, developing intelligent models using machine learning
algorithms, training, testing, and validating the model on house prices of the housing
market in the Capital, Islamabad. The data used for model validation and testing is the
asking price from online property stores, which provide a reasonable estimate of the city
housing market. The prediction model can significantly assist in the prediction of future
housing prices in Pakistan. The regression results are encouraging and give promising
directions for future prediction work on the collected dataset.

 Keywords: machine learning for regression; housing dataset; Property stores; house
price prediction; housing property value; real estate market;

1. Introduction
     The real estate market in Pakistan is a widespread trade, and with Projects like CPEC, the property
dynamics are changing quickly. Investors, as well as individuals, want to invest money in the housing
sector. Buyers and owners observe real estate trends, particularly in the housing market; these
trends also reflect the economic situation and social sentiment of any developing country. House
price estimation is a significant financial decision for individuals working in the housing market and
potential buyers. From investment to buying a house for residence, a person investing in the housing
market is interested in the potential gain. To understand this study’s background, We first overview
the housing market of Pakistan and then give an overview of the dataset used in this study.
     There are many factors which determine the houses prices. If we look into real estate in general,
then an increase in the real estate market is explained by the rise of the particular area’s inhabitants’
income. However, careful analysis suggests that we can only temporarily suggest that the prices of real
estate are increasing due to these factors, such as demand-oriented variables and others. Therefore, we
can conclude that the factors can be changed from time to time.The house prices are based on income
of the inhabitants of the area, house stock supply and the payment system, whether accept installment
or require cash payment.
     Other essential variables can include whether the price is the affordable, unemployment rate,
demographics, and others, but we can explain house prices as a general income function.In this study
do not consider all the possible variables that can be used to predict housing prices. In this study, we

Soft Computing and Machine Intelligence Journal, Vol (1), Issue (1), 2021                                Page: 11 of 52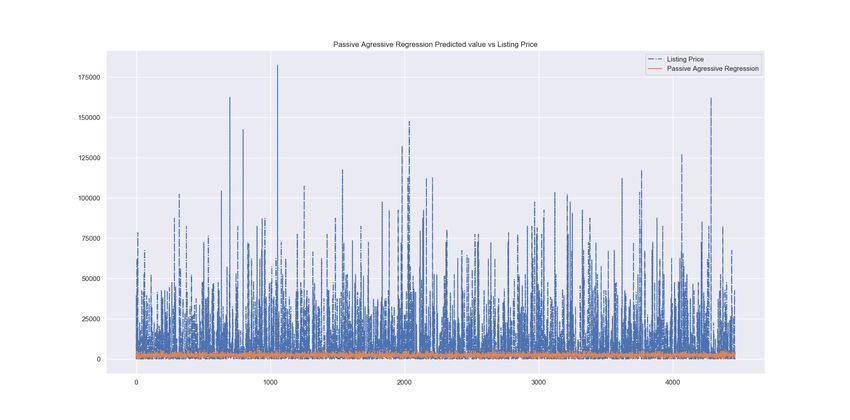
Vol (1), Issue (1), 2021

use only the housing data available from the property websites to predict the housing prices by looking
at the recent trends.Pakistan’s economy is slowly on the way towards recovery. The unemployment
rate is on a downwards stream, and consumer spending is going up. Nevertheless, the growth rate is
still struggling, which indicates that the Pakistan economy still has a long way to go before it is up and
running.
       In Europe and other advanced countries, real estate companies challenge developing algorithms
that can forecast real estate property prices more accurately. Researchers are using some well-known
housing datasets, e.g., Boston and King city USA datasets. One of the gaps for Pakistan is the absence
of a comprehensive housing dataset. Some real estate property sites in Pakistan provide a reasonable
estimate of the Pakistan housing market, but currently, they are not using house price forecasting tools.
Websites like Zillow1 , a US real estate market place organizes competitions on kaggle2 to encourage
researchers to come up with accurate house price forecasting algorithms. Since such challenges are not
part of the Pakistan housing market yet, making it very difficult for a research scholar to develop such
forecasting algorithms for the Pakistan real estate housing data, the only sources of housing data are
these online property stores.In the Pakistan real estate market, there are currently no Machine-based
forecasting tools used to estimate houses or any other real estate properties. There are some blogs
and magazines where human real estate market experts advise Pakistan real estate forecasts. Lack of
scientific research competitions for forecasting Pakistan’s housing prices and hence lack of housing
dataset make housing Price prediction for Pakistan real estate a difficult and challenging task.

                             Figure 1. Properties count based on locations

      Figure 1 displays the Property counts of the dataset with respect to sectors of the capital Islamabad.
We collect the dataset for this study from the leading property websites in the country. The dataset for
this study is from online property stores based in Pakistan. These websites contain details of property
listings from various cities of Pakistan. The dataset for this study is of Islamabad. The dataset is in
tabular textual format consisting of 23 columns and 44647 rows collected over a period of one year.

1   www.zillow.com
2   www.kaggle.com

                                               Page: 12 of 52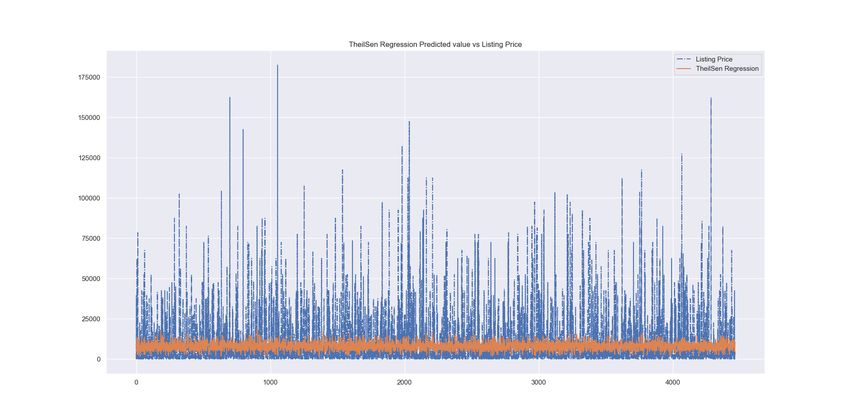
Vol (1), Issue (1), 2021

2. Related Work
      In literature, the approaches used for house price prediction can be classified as regression
models, machine learning models, and hybrid models.A variety of research work has been done
to estimate housing prices. Gaussian Processes (GP) for regression Model benefit from the London
housing dataset’s spatial structure; for this purpose, smaller local models are developed, which works
independently from each other. Once local models are trained, the overall predictions are obtained by
recombining predictions from local models. For generating visualization to clients through mobile [1],
the model is trained at the server-side, and prediction is generated for the user via a mobile app.
      Linear Regression and Gradient Boosting methods are used by sangani et al. [2] to predict Zillow
Estimation. Zillow is offering competition on Kaggle to develop the most accurate property value
forecasting algorithm. They used property data to train their linear regression and gradient boosting
models with which they make predictions about other properties. For gradient boosting models, they
use grid search to fine-tune their model’s hyperparameters. Oladunni et al. [3] reduce errors in the
Hedonic housing regression model by investigating Spatial Dependency substitutability of submarket
and geospatial attributes. The model is trained using best subset linear regression and regression
tree algorithms. Bayesian information criterion and residual mean deviance are used as performance
matrices.
      Ahmed et al. [4] design a neural network-based model for predicting housing Market Performance.
This model is trained through a historical market performance dataset to predict unforeseen future
performances. The model testing and validation show that the error in predicting his Neural Net
is in the range between –2 and +2 percent.To predict the Singapore housing market, Lim et al. [5]
design neural networks. They used two algorithms for prediction, the multilayer perceptron, and
autoregressive integrated moving average. The model with high accuracy score is used for prediction,
and the model with lower mean square error (MSE) of the ANN models shows that ANN is best
over other predictive tools. Chica et al.[6] designed Cokriging a Multivariate Spatial Method for
predicting Housing Location Price. This method estimates correlated spatial variables, interpolated
maps of house prices are created, providing information about house location prices to appraisers
and real estate agents. During the experiment, housing location price prediction value is estimated
using methods: isotopic data cokriging and heterotopic data cokriging. Results from both methods are
compared, and prediction from the best method is selected.
      Bahia et al. [7] used a data mining model using an Artificial Neural network to the real estate
market. Two network models were developed during the study FFB and CFBP. Both of these models
were trained using the Boston dataset, and the performance matrix used was regression value. The
CFBP prediction results are best, and the regressional value is .964; the study suggests that CFBP
prediction accuracy is 96 percent. Stevens et al. [8] used text mining to predict housing prices. His
prediction price involves pricing indicators, e.g., selling price, asking price, and price fluctuation. This
study shows that the SGD classifier performed best for all pricing indicators and achieved the best
results. The study uses stemmed n-grams for classification and regressions. R2 Matrix performance
value for prediction is 0.303. The study suggests that both of these results are good due to the task
complex nature.
      Nissan et al. [9] used various algorithms to Predict real estate property prices in Montreal. The
study suggests a prediction model that predicts asking and selling prices based on features, such as
location, area, rooms, nearest police station, fire station, etc. They used many regression models for
regression prediction. These regression methods include linear regression, SVR, kNN, regression Tree,
and Random Forest Regression. The proposed prediction models predict the Asking price with an
error of 0.0985 and the selling price with an error of 0.023.

                                               Page: 13 of 52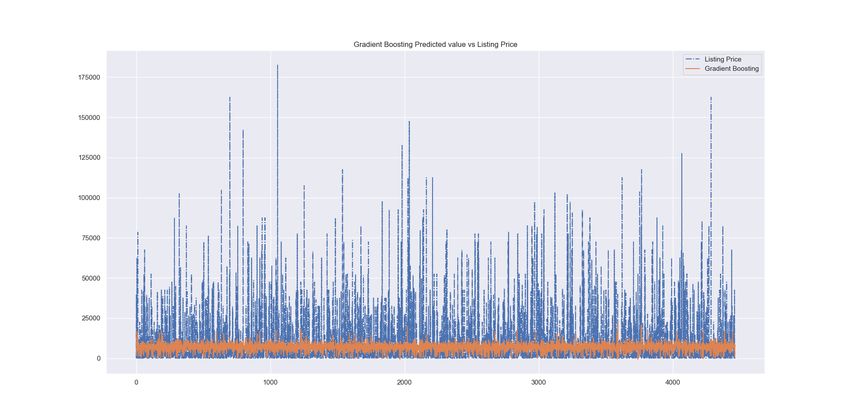
Vol (1), Issue (1), 2021
Nghiep et al.[10] compared multiple regression analysis to artificial neural networks (ANN) using
three different-sized training sets of single-family houses. The prediction Model uses features, e.g.,
area, number of bathrooms and bedrooms, the property build year, which shows how much property is
old in terms of years, number of quarters, selling status, and whether or not the property has a garage
or carport. The researchers proposed that while MRA performs best on smaller-sized training sets,
ANN was found to outperform as the dataset size increases.Byeonghwa and Jae [11] applied various
prediction techniques to predict prices of houses in Fairfax County, VA. They build various models on
5359 townhouses. They evaluated and compared these models and proposed that RIPPER, Bayesian,
and AdaBoost. RIPPER is best than other prediction models. They also applied Naive Bayesian to the
same dataset, but RIPPER algorithm performance is outstanding for housing price prediction.
3. Materials and Methods
We present the experimental design in three stages, where the former presents data collection,
and second presents Preprocessing steps, and the third presents regression models for house prices
prediction.
Data Collection Layer Pre-Processing Layer
Smoothing
Handling Moving
Missing Value Average
Simple Data OR Batch
House features variables Normalized Data Normalization
I= 4
H=10
Neuron
P4
O=1
P3
Output
Root Mean Square Error
Evaluation Layer
P2
Prediction Layer
P1
Performance
Layer Layer Layer
Output Hidden Input
I=8
Mean Absolute Error Neuron
H=20
P8
P7
O=1
P6
P5
Output
P4
P3
P2
Mean Absolute P1
Percentage Error Layer
Output
Layer
Hidden
Layer
Input
Figure 2. Experimental Design.
3.1. Data Collection
Data is collected using scraping software that collects data from the internet in a format that the
machine learning model can use. When parsing, the output data is interpreted by a machine, but
the human can not understand it easily. Data scrapping is also referred to as data extraction.Data
scrapping is very useful as if humans perform the data collection from the internet, and there are
many chances of error as machines transfer data between programs in the form of data structures that
provide high integrity of the data. However, the script is written for a pre-determined format, and it
may not be necessary that the data is always in the given format. The data may have issues in terms
of data consistency and correctness. Therefore, data scrapping only collects raw data and requires
extensive preprocessing and, in some situations, also requires human involvement.The data scrapping
activity is primarily dependant on the Internet sources from where data is being collected and can not
be fully automated. For example, in the case of you scraping data from the website, the best format
is that if the developer has assigned to each unique HTML element, an attribute ID and an attribute
Page: 14 of 52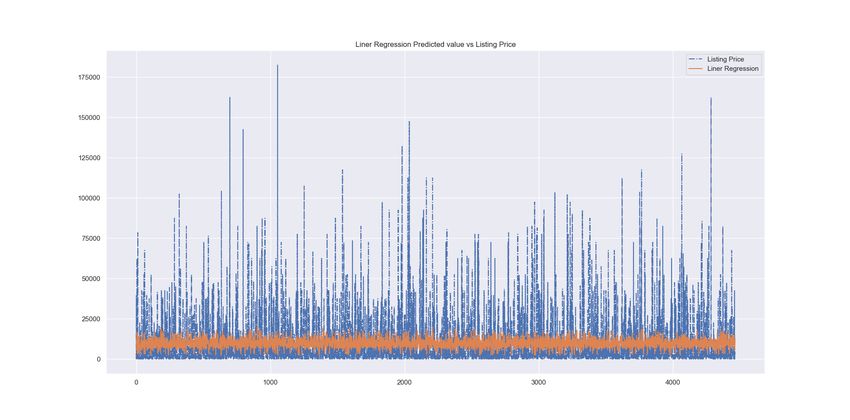
Vol (1), Issue (1), 2021

of the class are assigned to each item of the same group. This helps to create a script in almost any
programming language. Comparative study[12] of open-source scraping tools suggests that scrapy is
the best open-source tool for scrapping, So in this study, We use Python scrapy library for creating our
crawler.
     However, note that web scraping from well-settled companies is not trivial as the companies
use defensive algorithms and software to protect un-wanted access to their website. Most of them
are blocking any type of script in their robots.txt. So the idea is to write a script that can scrap data
intelligently like a human being. This is achieved by automating human behavior when browsing a
website. For example, if scrapping an entry is delayed by 5 seconds or 10 seconds, the system may not
recognize data extraction from the website and could consider it a regular activity.
     Data scraping is done on publicly available data via browser either without login or after
authentication to their website. In the case of using SQL Injection to hack their database is a saviors
internet offense.
     Web search engines, e.g., Google, yahoo, bing, and others, play an essential role in reaching a
website. For example, we type a keyword, and after the query is entertained, the search engine gives
us results based on that query. This helps find a data host, and it gives both benefits to the data host
and the person who is scraping. The Mechanism search engines use the same as web scraping, but
they are not blamed for data scraping as the data is used for the user’s convenience.
     If we consider Google, Google has two part of their search engine, one Googlebot a software bot
which crawls billions of web pages from the websites on the internet and is stored in the Google data
hosts and another part of the system is an algorithm which entertains the user-queries based on the
data crawled and displays results to user with the help of a ranking algorithm.
     In regard to whether web scraping is legal or illegal, Michael Mahoney observes [13] that legal
action is taken against airline price aggregators such as Orbitz Kayak and Expedia. Another example
in this regard is Facebook. Facebook has a history of suing third-party applications that have accessed
and republished Facebook user data[14].
     Another exciting example is Craigslist [15] which provides services like Padmapper, 3Taps of an
improper gathering of their information and reposting it as a map interface which is plotted as the
chart on the location of the user-generated ads. The author states there is "no direct legal protection for
databases. However, data hosts can file a case against scraper if they can prove the scraper has harmed
them in any way". One such example is Intel and Hamidi’s case that ruled that server inconveniences
do not constitute an actionable harm [16]. Scraping may consume the bandwidth of websites and, in
extreme cases, crash a website or server.
     In summary, the legality of scraping by [17]: multiple instances of data hosts pairing up with
scraper show that data host should seek ways to embrace scrapers that seek to improve their services.
Further, the scrapers should review their business model. If a data host thinks scraper is parasitic, then
he can sue the scraper. Table 1 and Table 2 presents physical, geographical and other features of the
collected dataset.

                                               Page: 15 of 52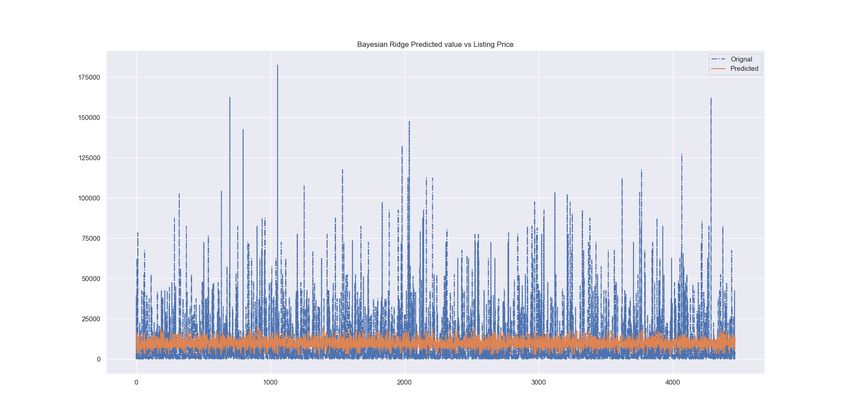
Vol (1), Issue (1), 2021

             Name of the attribute                     Description                   Data type
                      Area                      living area in Square feet           Numeric
                   Bedrooms                       number of bed rooms                Numeric
                   Bathrooms                      number of bath rooms               Numeric
                 Dining Room                     dining room? (yes/no)                Binary
                Drawing Room                   Drawing Room? (yes/no)                 Binary
                Laundry Room                   Laundry Room? (yes/no)                 Binary
                    Lounge                          Lounge? (yes/no)                  Binary
                     Garden                         Garden? (yes/no)                  Binary
                    Flooring                        Flooring? (yes/no)                Binary
                  Study Room                     Study Room? (yes/no)                 Binary
                Swimming Pool                  Swimming Pool? (yes/no)                Binary
            Central Air Conditioning   Central Air Conditioning system? (yes/no)      Binary
                      Build                   house build type? (old/new)             Binary
                      Table 1. List of physical features selected for the dataset.

                  Name of the attribute               Description             Data type
                        Location              sector name of the location     Nominal
                   Nearby Hospitals           Nearby Hospital? (yes/no)        Binary
                    Nearby Schools             Nearby School? (yes/no)         Binary
                 Nearby Shopping Malls     Nearby Shopping Malls? (yes/no)     Binary
                   Maintenance Staff         Maintenance Staff? (yes/no)       Binary
                      Security Staff            Security Staff? (yes/no)       Binary
                 Nearby Airport(yes/no)    Nearby Airport(yes/no)? (yes/no)    Binary
                          View             house View? (good/best/normal)     Nominal
                     Parking Spaces            Parking Spaces? (yes/no)        Binary
                          Price               price of the house in PKR?      Numeric
                       Table 2. List of geographic and environmental features.

3.2. Preprocessing

     Data preprocessing is done in order to transform the dataset into a clean dataset for better machine
learning models. Data preprocessing techniques are applied to data in raw format, which is not feasible
for analysis. As in our case, the data is collected from different property websites where property
agents entered it, so there are missing values, data in various formats, and incorrect data. We performed
data integration to combine the data from various sectors of the capital into an integrated dataset.
Data transformation methods were applied to transform the data records to a format that is good for
machine learning analysis.
     To perform iterative analysis on data, we cleaned the dataset from missing and incorrect
values. Data Wrangling, Data Munging are similar terms used in the Data Science community;
data wrangling/data munging are techniques used to convert raw data into a format that is best for
using the data. In our case, we converted the textual data such as yes and no to binary variables.
Locations, views, and other variables were encoded into numbers for better analysis results.
     We computed the binary variable Build from the year of construction of the house. The house’s
asking price was in various currencies and units, e.g., lacks, thousands, crore. We converted it into
lacks units and PKR currency. Machine learning algorithms such as neural networks perform best
on data values ranges from 0 to 1, so we scaled down our dataset values between 0 and 1 using the
Min-Max scaling algorithm. Later on, for performance evaluation, the values are scaled up to their
original range. Equation 1 shows how to scale down values between 0 and 1.

                                                   x − min( x )
                                          x0 =                                                              (1)
                                                 max ( x ) − min( x )

                                                 Page: 16 of 52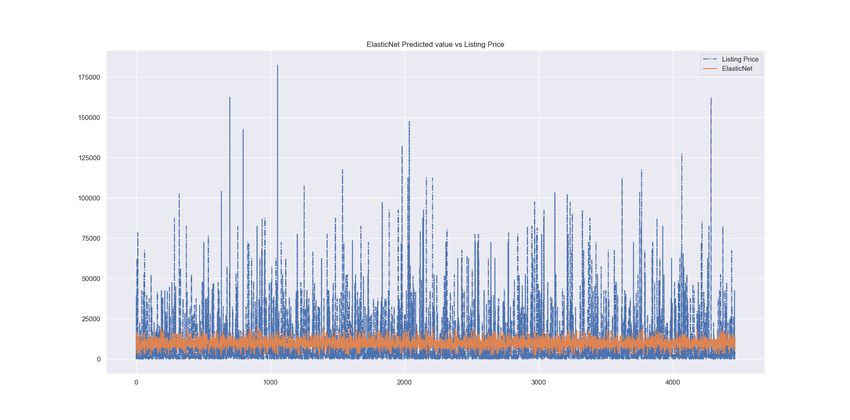
Vol (1), Issue (1), 2021

      Figure 3 shows the Correlation between housing features, it is used to calculate the strength of
the relationship of housing features i.e., Bedrooms and Bathrooms, Build, Dining Room with price
feature. The Correlation Coefficient value for Bedrooms and Bathrooms with respect to price features
is high than the rest of the features, which shows that price features having a strong relationship with
Bedrooms and Bathrooms features, and hence these will contribute more than other features in house
price prediction.
      Its clear from Figure 3 that all the features except Area, Central air conditioning, location, view
having some sort of relationship with the price feature. In this study, we used the Pearson correlation
coefficient to measure the strength of the features variables’ relationship. Pearson correlation coefficient
can be calculated using Equation 2.
                                                    cov( X, Y )
                                               ρ=                                                        (2)
                                                      σx σy

                                 Figure 3. Correlation between features

      After applying Preprocessing the dataset, we Partition the dataset into training, validation, and
testing subsets. Each of these partitioned datasets is further divided into dependent and independent
variables, set X and Y.

3.3. Analysis procedure

   This study developed various regression models, including Intelligent machine learning-based
models, and applied them to our dataset. The development toolkit used for developing our regression

                                                Page: 17 of 52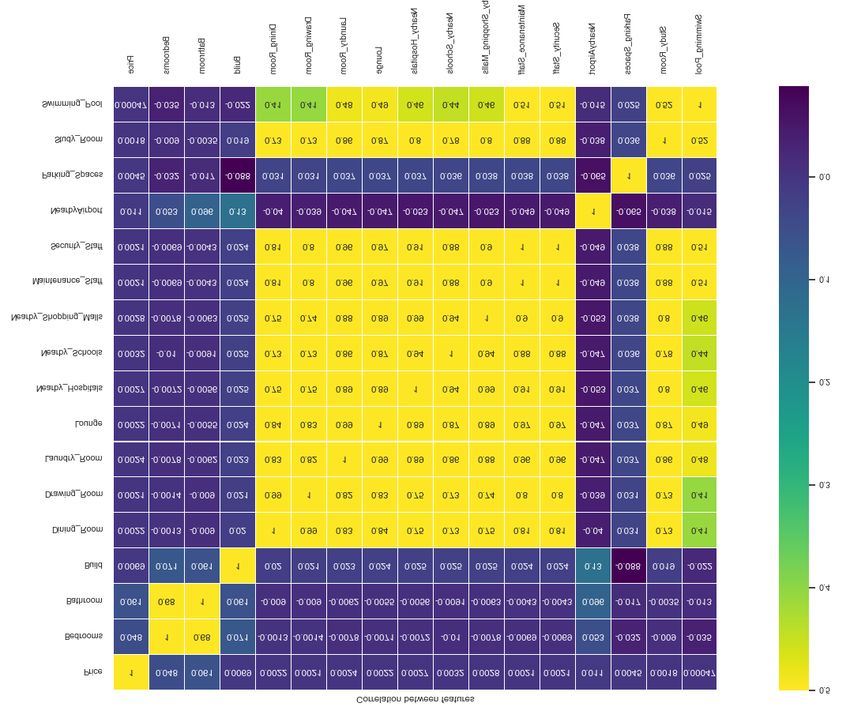
Vol (1), Issue (1), 2021

models is anaconda spyder. We now discuss ten machine learning regression procedures applied to
our dataset.

3.3.1. Machine Learning Regression Methods

       Linear regression (LR) [18] are used too much because its easy, straightforward to understand.
It is one of the most basic and popular algorithms in machine learning. In this study, we build a
multivariate LR Model to predict housing prices. LR Model will find the best possible line that fits the
training set and then predicts the unseen house price from the test set.
       We applied Support Vector Regression(SVR) [19] into the same housing dataset for housing price
prediction. SVR is slightly different from the famous machine learning algorithm Support Vector
Machine(SVM). The main difference is that SVM is used for classification, and SVR is used for a
regression problem. In SVM, a hyperplane is used as a separation line between classes. In SVR, we
define the hyperplane line for predicting the continuous value or housing price value. Other concepts,
i.e., boundary line and support vectors, are the same between SVM And SVR.
       We estimated the housing price prediction problem using a machine learning probabilistic model
called Bayesian Ridge Regression (BRR) [20]. We estimate the house prices t be Gaussian distributed
around the independent housing features. The main advantage of using BRR for house price prediction
or other regression problems is that it can adapt to the data at hand, and second that it can be used to
include regularization parameters in the housing price estimation procedure.
       LassoLars regression [21] is one of the simple techniques to reduce model complexity and prevent
over-fitting, resulting from simple linear regression. Lasso regression helps in reducing over-fitting
and in feature selection. Just like Ridge regression, the regularization parameters can be controlled for
better estimation of the housing prices. Elastic Net [22] first emerged as a result of critique on lasso
regression, whose variable selection can be too dependent on data and thus unstable. The solution is
to combine the penalties of ridge regression and lasso to get the best of both worlds. The elastic Net
main aim is minimizing the loss function.
       Gradient boosting regression(GBR) [23] is a machine learning that can be used to build a prediction
model for regression problems like house price prediction in the form of an ensemble of weak prediction
models. GBR repetitively leverages residuals patterns and strengthens a housing price prediction
model with weak predictions, and makes it better. The main aim is minimizing our loss function,
such that test loss reaches its minima. Random Forest(RF) [24] is an ensemble technique capable
of performing both regression and classification tasks with the use of multiple decision trees and a
technique called Bootstrap Aggregation, commonly known as bagging.
       Stochastic gradient descent (SGD) [25] is based on some addition to gradient descent. It
is an iterative method for optimizing an objective function and is mostly used as black-box
optimizers. SGD can be called a stochastic approximation of gradient descent optimization. Passive
Aggressive Algorithms [26] are a family of online learning algorithms. We use the Passive-Aggressive
regression(PAR) model for the house price prediction problem. The idea is elementary, and the house
price estimation using this regression model is better than many other alternative methods. Theil-Sen
estimator is a method used for simple linear regression, and it chooses the median of the slopes of all
lines through pairs of points.

4. Results
     This section of the study explains the experimental results of the machine learning models used
in the study for house price prediction.

                                               Page: 18 of 52
Vol (1), Issue (1), 2021
4.1. Performance matrices
The performance evaluation matrices used for the evaluation of the regression models are
MAPE(Mean absolute percentage error), RMSE(Root Mean Squared Error), and MAE(Mean absolute
error).
4.1.1. Mean absolute percentage error
This performance measure computes an average deviation found in predicted house price value
from actual listing house price values. MAPE is calculated by dividing the sum of absolute differences
between the actual house price values and predicted house values by the machine learning algorithm
we applied in this study with the total number of price value data items, i.e., n. Figure 4 represents the
performance of machine learning methods applied in this study using performance matrix MAPE.
100% n et
n t∑
MAPE = (3)
=1 y t
Figure 4. Performance Comparison of Machine Learning algorithms using MAPE
4.1.2. Root Mean Squared Error
MSE sometimes increases the actual error, making it difficult to realize and understand the actual
error amount. This problem is resolved by the RMSE measure, which is obtained by simply taking the
square root of MSE. Figure 5 represents the performance of machine learning methods applied in this
study using performance matrix RMSE.
s
1 n d i − f i 2
RMSE = Σ (4)
n i =1 σi
4.1.3. Mean absolute error
mean absolute error is a measure of difference between two continuous variables.In our case these
continuous variables are listing price value and predicted price value f the house property. Figure 6
Page: 19 of 52Vol (1), Issue (1), 2021
Figure 5. Performance Comparison of Machine Learning algorithms using RMSE
represents performance of machine learning methods applied in this study using performance matrix
MAE.
1 n
MAE = ∑ |et | (5)
n t =1
Figure 6. Performance Comparison of Machine Learning algorithms using MAE
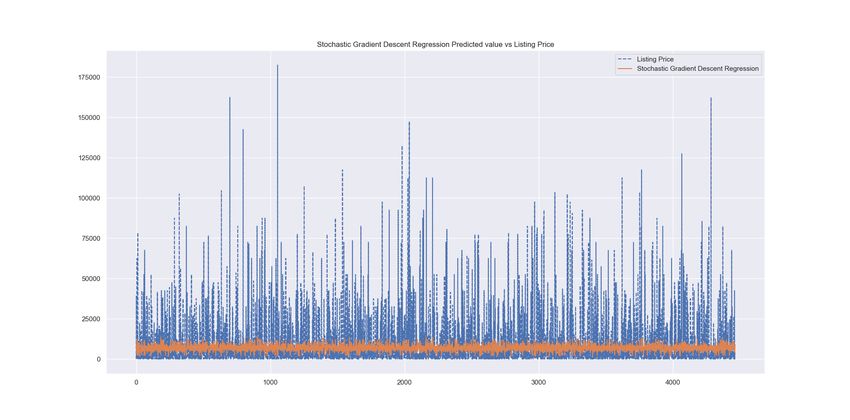
Figure 7 visualize the comparison of the house’s original listing price and predicted price values
by various Machine learning Algorithms. Each subfigure listing price is represented using a dashed
blue color line, whereas the machine learning algorithm’s predicted price value is represented using a
solid orange color line. Horizontal access of the chart represents the housing property instance, and
the Vertical axis represents price values.
Page: 20 of 52Vol (1), Issue (1), 2021
(a) Bayesian Regression (b) Linear Regression
(c) Support Vector Regression (d) Stochastic gradient descent
(e) ElasticNet Regression (f) Gradient Boosting Regression
Figure 7. Cont.
(c) Passive Aggressive Regression (d) Theil-Sen Regression
Figure 7. Feature importance with ML models.
5. Conclusions
In this study, We have explored eleven machine learning algorithms used to develop housing
price prediction models for estimating the future house pricing of the capital Islamabad. One of our
Page: 21 of 52Vol (1), Issue (1), 2021
Method MAPE MAE RMSE
LR 5627.9369 10928.2603 16658.4158
BRR 7383.9969 10930.6388 16661.3350
SVR 1918.4957 8595.6057 18209.5558
SGDR 10698.1442 13139.1928 17345.1444
ElasticNet 7388.1547 10927.7181 16658.2267
GBR 5267.4830 9563.4324 16772.3870
LassoLars 7382.6600 10938.5807 16670.3489
RF 7371.0746 10902.9762 17105.2596
PAR 2133.8370 8621.9391 18069.2298
Theil-Sen 6031.6336 10151.4884 16754.2930
Table 3. Comparison of regression methods performance
contributions in this study is collecting housing data and developing the first scientific housing dataset
for the Pakistan housing market. Machine learning algorithms such as Passive-aggressive Regression,
Support Vector Regression, and Deep learning Network can estimate the prices very close to the listing
price. The results show that SVR performs best than the rest of the machine learning algorithms. In
this study, we compare various machine learning regression models’ performance for finding best
model for a better housing price prediction. There is currently no Machine learning or other house
forecast tools used in the best of our knowledge. We strongly believe that machine learning house price
prediction models will help those who work in the real estate market and potential buyers in making
a good house purchasing decision. In the future, this work can be used as base for several types of
studies, including the real estate market, stock price prediction, oil and petroleum prices forecast. In
the future, this textual tabular dataset can be used with the houses’ visual features, such as images
of the houses’ interior and exteriors, to build a more robust, novel house price prediction. Lastly, the
housing market can be influenced by other macro-economic variables such as price of gold, stock price
index, property tax, and the appraised value of a property; considering these can help develop house
price prediction models that can accurately estimate the house prices.
Acknowledgments: We are thankful to Dr. Muhammad Muzammal, Associate professor Bahria
University for his supervision and valuable suggestions during this research study.
References
1. Ng, A.; Deisenroth, M. Machine learning for a London housing price prediction mobile application. Imperial
College London 2015.
2. Sangani, D.; Erickson, K.; Al Hasan, M. Predicting zillow estimation error using linear regression and
gradient boosting. 2017 IEEE 14th International Conference on Mobile Ad Hoc and Sensor Systems (MASS).
IEEE, 2017, pp. 530–534.
3. Oladunni, T.; Sharma, S. Spatial dependency and hedonic housing regression model. 2016 15th IEEE
International Conference on Machine Learning and Applications (ICMLA). IEEE, 2016, pp. 553–558.
4. Khalafallah, A. Neural network based model for predicting housing market performance. Tsinghua Science
and Technology 2008, 13, 325–328.
5. Lim, W.T.; Wang, L.; Wang, Y.; Chang, Q. Housing price prediction using neural networks. 2016 12th
International Conference on Natural Computation, Fuzzy Systems and Knowledge Discovery (ICNC-FSKD).
IEEE, 2016, pp. 518–522.
6. Chica-Olmo, J. Prediction of housing location price by a multivariate spatial method: Cokriging. Journal of
Real Estate Research 2007, 29, 91–114.
7. Bahia, I.S.H.; others. A Data Mining Model by Using ANN for Predicting Real Estate Market: Comparative
Study. International Journal of Intelligence Science 2013, 3, 162.
8. Stevens, D.; Wubben, S.; van Zaanen, M. Predicting real estate price using text mining. Department of
Communication and Information Sciences. Tilburg University 2014.
Page: 22 of 52Vol (1), Issue (1), 2021
9. Pow, N.; Janulewicz, E. Liu (Dave) Liu. Prediction of real estate property prices in Montreal.
10. Nghiep, N.; Al, C. Predicting housing value: A comparison of multiple regression analysis and artificial
neural networks. Journal of real estate research 2001, 22, 313–336.
11. Park, B.; Bae, J.K. Using machine learning algorithms for housing price prediction: The case of Fairfax
County, Virginia housing data. Expert systems with applications 2015, 42, 2928–2934.
12. Yadav, M.; Goyal, N. Comparison of Open Source Crawlers- A Review. International Journal of Scientific &
Engineering Research September, 2015, 6.
13. Mahoney, M. Orbitz Sued by Southwest Airlines. E-Commerce Times 2001.
14. Facebook. Facebook, Inc v. Power Ventures. 844 F.Supp.2d 1025 (E.D. Cal. ). Facebook, Inc v. Power Ventures
2012.
15. Gervais, D.J. The Protection of Databases. 92 CHI.-Kent L. Rev. 1109 2007.
16. v. Hamidi, I.C. Intel Corp. v. Hamidi. 71 P.3d 296 2003.
17. Hirschey, J. Symbiotic Relationships: Pragmatic Acceptance of Data Scraping. SSRN Electronic Journal 2014.
18. Weisberg, S. Applied linear regression. John Wiley & Sons 2005.
19. Panigrahi, S.; Mantri, J.K. Epsilon SVR and decision tree for stock market forecasting. Green Computing and
Internet of Things Oct. 2015.
20. Vinod, H.D. A survey of ridge regression and related techniques for improvements over ordinary least
squares. The Review of Economics and Statistics 1978.
21. Gluhovsky, I. Multinomial least angle regression. IEEE transactions on neural networks and learning systems
2011, 23, 169–174.
22. Li, Q.; Lin, N. The Bayesian elastic net. Bayesian analysis 2010.
23. Zemel, R.S.; Pitassi, T. A gradient-based boosting algorithm for regression problems. Advances in neural
information processing systems 2001, pp. 696–702.
24. Breiman, L. Random Forests. Machine Learning 2001, 45.
25. Ruder, S. An overview of gradient descent optimization algorithms. arXiv 2017, 1609.04747v2.
26. Crammer, K.; Dekel, O.; Keshet, J.; Shalev-Shwartz, S.; Singer, Y. Online passive aggressive algorithms 2006.
Page: 23 of 52You can also read