NO END IN SIGHT AMERICA'S ENDURING RELIANCE ON LIFE IMPRISONMENT
←
→
Page content transcription
If your browser does not render page correctly, please read the page content below
NO END IN SIGHT
AMERICA’S ENDURING
RELIANCE ON LIFE
IMPRISONMENT
For more information, contact:      This report was written by Ashley Nellis, Ph.D., Senior Research
                                    Analyst at The Sentencing Project. Savannah En, Research Fellow,
The Sentencing Project              provided significant research assistance for this report.
1705 DeSales Street NW
8th Floor                           The Sentencing Project works for a fair and effective U.S. criminal
Washington, D.C. 20036              justice system by producing groundbreaking research to promote
                                    reforms in sentencing policy, address unjust racial disparities and
(202) 628-0871                      practices, and to advocate for alternatives to incarceration.
sentencingproject.org               Copyright © 2021 by The Sentencing Project. Reproduction of this
twitter.com/sentencingproj
                                    document in full or in part, and in print or electronic format, only by
facebook.com/thesentencingproject
                                    permission of The Sentencing Project.

2 The Sentencing Project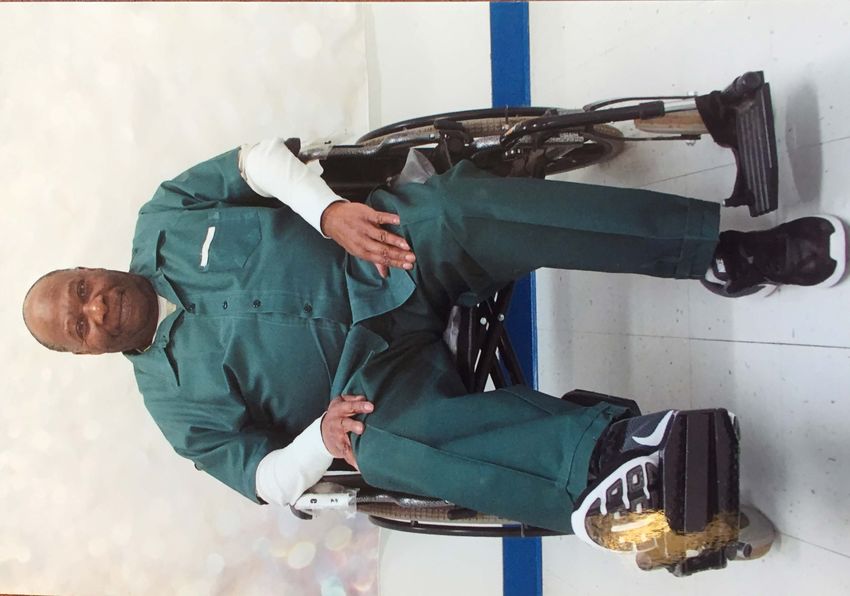
TABLE OF CONTENTS

 Findings and Recommendations                                                                     4

 I. Introduction                                                                                  8

 II. Life in Context                                                                            11

 III. The Facts of Life                                                                         13
   A. Long-term Trends                                                                          13
   B. Recent Trends                                                                             15
   C. Race and Gender                                                                           18
   D. Aging Lifers                                                                              20
   E. Crime of Conviction                                                                       22

 IV. Problems with Life Imprisonment                                                            25
   A. Aging Out: Young and Old                                                                  25
   B. Redemption and Reform                                                                     27
   C. Racial Prejudice		                                                                        28
   D. Parole Board Decisions                                                                    29
   E. Intimate Partner Violence                                                                 30

 V. Life Lessons: Where Do We Go From Here?                                                     32
   A. Abolish Life Without Parole                                                               32
   B. Impose a 20-Year Cap on All Life Sentences Except in Rare Circumstances                   34
   C. Accelerate and Broaden Release Opportunities                                              34
   D. Reorient Victim & Community Involvement Toward True Healing                               35

 VI. Methodology and Notes                                                                      37

 VII. Appendix: Survey Instrument                                                               39

 VIII. Endnotes                                                                                 42

                                       No End in Sight: America’s Enduring Reliance on Life Imprisonment 3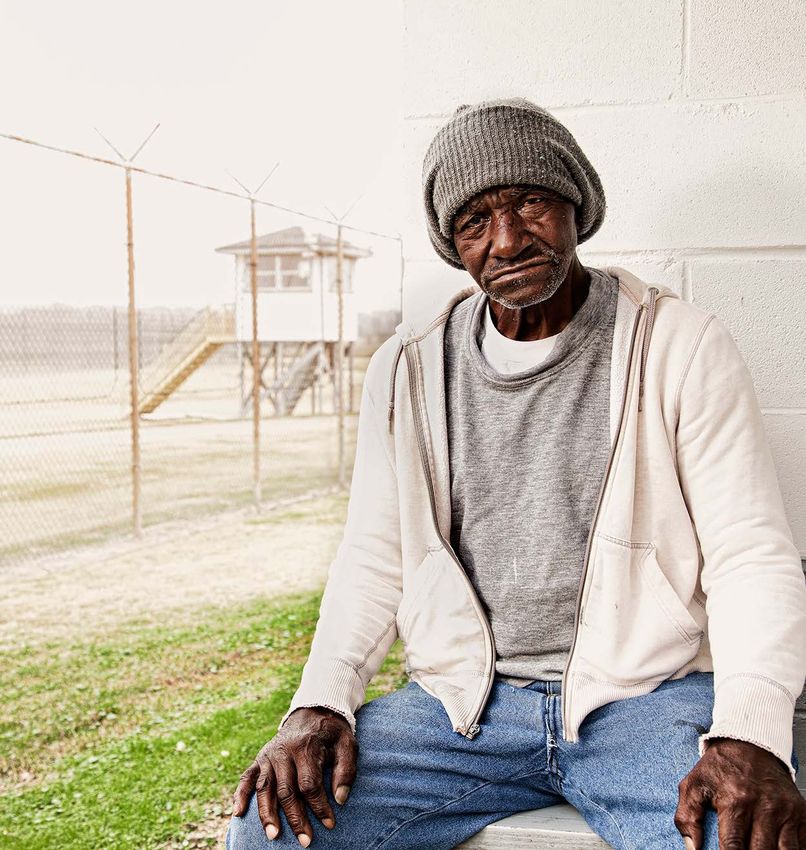
FINDINGS AND RECOMMENDATIONS
Before America’s era of mass incarceration took hold in the early 1970s, the number
of individuals in prison was less than 200,000. Today, it’s 1.4 million;1 and more than
200,000 people are serving life sentences – one out of every seven in prison. More
people are sentenced to life in prison in America than there were people in prison
serving any sentence in 1970.

Nearly five times the number of people are now serving          •   3,972 people serving life sentences have been
life sentences in the United States as were in 1984, a              convicted for a drug-related offense and 38% of
rate of growth that has outpaced even the sharp                     these are in the federal prison system;
expansion of the overall prison population during this
period.                                                         •   More than two-thirds of those serving life sentences
                                                                    are people of color;
The now commonplace use of life imprisonment
contradicts research on effective public safety strategies,     •   One in 5 Black men in prison is serving a life sentence;
exacerbates already extreme racial injustices in the
                                                                •   Latinx individuals comprise 16% of those serving
criminal justice system, and exemplifies the egregious
                                                                    life sentences;
consequences of mass incarceration.
                                                                •   One of every 15 women in prison is serving life;
In 2020, The Sentencing Project obtained official
corrections data from all states and the Federal Bureau         •   Women serving LWOP increased 43%, compared to
of Prisons to produce our 5th national census on life               a 29% increase among men, between 2008 and 2020;
imprisonment.
                                                                •   The population serving LWOP for crimes committed
                                                                    as youth is down 45% from its peak in 2016;
KEY FINDINGS
                                                                •   8,600 people nationwide are serving parole-eligible
•   One in 7 people in U.S. prisons is serving a life
                                                                    life or virtual life sentences for crimes committed
    sentence, either life without parole (LWOP), life with
                                                                    as minors.
    parole (LWP) or virtual life (50 years or more), totaling
    203,865 people;                                             The unyielding expansion of life imprisonment in recent
                                                                decades transpired because of changes in law, policy
•   The number of people serving life without parole
                                                                and practice that lengthened sentences and limited
    — the most extreme type of life sentence — is higher
                                                                parole. The downward trend in violence in America that
    than ever before, a 66% increase since our first
                                                                continues today was already underway when the country
    census in 2003;
                                                                adopted its most punitive policies, including the rapid
•   29 states had more people serving life in 2020 than         expansion of life sentences. The increase in life
    just four years earlier;                                    imprisonment and the growing extremity of our criminal
                                                                legal system was largely driven by policies enacted in
•   30% of lifers are 55 years old or more, amounting to        response to public fears about crime, often rooted in
    more than 61,417 people;                                    sensationalized media stories rather than the actual
                                                                prevalence of violent crime in most communities.

4 The Sentencing Project
Yet debate around the utility of long prison sentences         crimes are favored because they confront low-level and
often ends with the mention of violent crime, even though      nonviolent crimes; this emphasis has had the unintended
we know that life imprisonment does not make us safer.         consequence of further legitimizing the utility of long-
The vast majority of people “age out” of criminal conduct      term imprisonment.
by adulthood. Lengthy prison terms hold people well
after their risk of committing a new offense becomes           To reverse course on the nation’s 40-year prison buildup,
minimal.                                                       we must scale back all punishments and evaluate
                                                               individuals based on their current behavior and prospects
In this report, we reveal for the first time that 30% of the   for a crime-free life upon release. Since more than half
life-sentenced population is 55 or older. The imprisonment     of the people in prison are serving sentences for a crime
of an aging population has become a fiscal and                 of violence, we must not only reevaluate appropriate
humanitarian crisis the country must confront. The             sanctions in response to violent crime, but also how to
urgency of this crisis grows ever greater as the COVID-19      prevent violent crime in the first place.
pandemic disproportionately jeopardizes the lives of
older Americans in prison. Reoffending by persons              Some states are beginning to address overly long prison
released after serving long terms is rare, making the          terms through second-look legislation. In 2018, California
need for expediting releases for older lifers the only         passed a law to allow prosecutors to seek sentence
humane public health and public safety approach.               modifications from judges if sentences are believed to
                                                               be excessive. In 2020, the Council of the District of
Racial and ethnic disparities plague the entire criminal       Columbia passed legislation that provides people who
justice system from arrest to conviction and is even           were under 25 at the time of their offense and sentenced
more pronounced among those serving life sentences.            to a long term, the chance to petition the court for
One in 5 Black men in prison is serving a life sentence        resentencing and early release after 15 years. At the
and two thirds of all people serving life are people of        federal level, Senator Cory Booker of New Jersey
color. An abundance of scholarship finds evidence of           introduced the Second Look Act in 2019 which would
racial and ethnic disparities resulting in harsher             allow a federally incarcerated person to petition the court
sentencing outcomes because of race. Elevated rates            for a sentence modification after 10 years.
of Black and Latinx imprisonment are partly caused by
higher levels of engagement in violent crime, but are          These are important first steps. More must be done.
worsened by the racially disparate impacts of heavy-
handed policies initiated during the 1980s and 1990s.          RECOMMENDATIONS
Communities that are under-resourced and over-punished         Abolish Life Without Parole
need greater investment in evidence-based solutions
that interrupt crime at its root. Public investments for       Sentences of life without the possibility of parole (LWOP)
supporting youth, ensuring access to medical and mental        are virtually unheard of in the rest of the world. They are
health care, expanding living wage employment                  considered antithetical to personal transformation, the
opportunities and ensuring affordable housing are a            primary goal of many other corrections systems. Even
better use of public resources than lifelong imprisonment.     more, they violate fundamental principles of human
Lengthening prison sentences produces diminishing              dignity.2 Instead of serving the interests of justice, LWOP
returns on public safety and robs struggling communities       unnecessarily burdens systems with the heavy cost of
with necessary resources to fend off violence in the first     housing, feeding, and providing medical care for the
place.                                                         more than 55,000 people. This disproportionately elderly
                                                               population must live in institutions not well designed to
Despite a growing awareness that ratcheting up prison          care for them.
sentences, not crime trends, fueled mass incarceration,
many sentencing reform proposals fall short of                 The elimination of LWOP will recalibrate all sentences
addressing this head on. Indeed, changes directed at           underneath it. Public perceptions of incarceration
scaling back punishments for low-level and nonviolent          minimize the negative impact of a 5- or 10-year sentence

                                                     No End in Sight: America’s Enduring Reliance on Life Imprisonment 5
on an individual when compared to the extremes of a board hearing should be on the person’s development
life sentence. Creation of a more fair and just system while incarcerated, current public safety considerations,
depends on ending all extreme penalties. and identifying what supports are needed to ensure
success after release.
Limit All Life Sentences to 20 Years Except in Rare
Circumstances States should also adopt “second look” policies that
reconsider the appropriateness of continued incarceration
As with the country’s use of LWOP, virtually unheard of given the passage of time and changed circumstances
elsewhere in the world, imprisonment beyond 20 years within the individual. Beginning this review at 10 or 15
is a predominantly American phenomenon. Life years aligns the U.S. with the international community
sentences have been part of the American criminal legal and the American Law Institute, a national nonpartisan
system for decades, but only in the age of mass body of legal experts. It should not take the corrections
incarceration have they become part of the mainstream. system more than 20 years to empower an individual
In order to sensibly confront extreme sentencing, reduce with the skills necessary to live crime-free after release.
mass incarceration, and redistribute resources to
communities that would benefit from robust crime Reorient Victim and Community Involvement
prevention, we recommend a 20-year maximum for all Toward True Healing
life sentences. We arrive at this recommendation after
witnessing the continued expansion of America’s zeal In its present orientation, the justice system — and
for ever-harsher punishment while decades of practical prosecutors specifically — employ victim testimony from
experience, data, and social science support more individuals at high risk of retraumatization in order to
restorative approaches. obtain tough sanctions for the defendant. Survivors are
not provided with the tools and resources sufficient to
If, after 20 years of imprisonment, it is clear that the cope with the emotional, physical, and financial effects
individual continues to engage in conduct that would of having experienced crime. A reorientation of the role
put the public at risk if they were released, a period of of victims requires investing in restorative and community
civil confinement could be considered by a court. justice models that heal the harm caused by violence
Individuals potentially subjected to such confinement at their root, creating a system that is “survivor-centered,
would be entitled to strict due process rights and legal accountability-based, safety driven, and racially
representation. This is similar to the practice in Norway, equitable.”3 Experts in this space know that we are all
often held as the gold standard in corrections. The goal safer when we uplift victims, hold everyone accountable
here would still be rehabilitation and reintegration, not for their actions, and do so with empathy and compassion;
exclusion, and mandatory periodic review to assess not assume victims or communities are well-served by
readiness for release would continue. long-term imprisonment.
Accelerate and Expand Release Opportunities
America suffers from a broken parole system, or in some
jurisdictions, no parole system at all. In jurisdictions with
parole, the review process is mired in political jockeying
and often manipulates victim experiences to secure a
parole denial. A just parole system would operate
independently from the politics of the executive branch
both in the ultimate decision to release an individual, as
well as the composition of the parole board. The board
should be composed of professionals with expertise in
social work, psychology, the law, and corrections. Crime
of conviction should not be the determining factor in
the decision of the parole board. The focus of the parole
6 The Sentencing ProjectNAOMI BLOUNT WILSON
Naomi Blount Wilson is a Commutations Specialist for the Pennsylvania Board of Pardons,
the arm of the state that hears clemency pleas. She knows what’s involved in going before the
pardon board, having successfully done so in 2019 after serving 37 years of a life-without-pa-
role (LWOP) sentence for a 1982 homicide in which she played an indirect role. Blount Wilson
is one of only two women serving life whose sentences were commuted in the past two de-
cades. Pennsylvania Lieutenant Governor John Fetterman hired Blount Wilson and another
former lifer4 to assist as a liaison between his office and prisoners shortly after her release.
Photo Credit: Joshua Vaughn
No End in Sight: America’s Enduring Reliance on Life Imprisonment 7INTRODUCTION
Life sentences are the lifeblood of mass incarceration.
Pennsylvania is a good place to begin a discussion about than severity of punishment, is a more powerful influence
life sentences in America. The state is emblematic of on the decision to commit crime.6 Because of the nation’s
the political gamesmanship that has been at play in preference for the latter, state and federal prisons now
administering justice and mercy for many decades. As face a crisis of managing a growing population of elderly
a result, the state holds the second highest number of prisoners who are costly to house, feed, and provide
people serving life sentences — 8,242 individuals — both medical care for — but even more important, who pose
in the country and the world. Two thirds have no chance no serious threat to public safety. During the current
for release other than by a rare commutation by the COVID-19 pandemic, the immediate release of elderly
governor. Entire prisons are devoted to housing lifers in lifers should be a priority.
Pennsylvania, a sentence frequently termed “death by
incarceration.” Beyond the current public health crisis, states and the
federal government should implement a 20-year
The commonplace use of life imprisonment in the U.S. maximum to prison terms, except in rare circumstances.
places it at odds with practices in other industrialized Funds no longer directed at excessive incarceration
nations. The United States incarcerates people for life could be positively invested in disadvantaged
at a rate of 50 per 100,000, roughly equivalent to the communities with lacking sufficient economic and public
entire incarceration rates of the Scandinavian nations health support to improve both social outcomes and
of Denmark, Finland, and Sweden.5 Fifteen percent of public safety. America’s misguided investment in mass
people in U.S. state and federal prison are serving life incarceration has worsened life in the poorest
terms. communities and made these vulnerable communities
more prone to crime, not less. The path to strengthening
Life sentences are the lifeblood of mass incarceration, communities calls for a robust reinvestment of the
particularly given their dramatic growth in recent decades, dollars and lives previously wasted on mass incarceration.7
and there are good reasons to eliminate the punishment
entirely. Their mainstream use in the American justice Enacting a 20-year cap on life sentences in most cases
system, having far exceeded the crimes for which they could reverse the tough-on-crime policies debunked by
were once intended, deprives people of their dignity and years of social science. This cap would recalibrate all
perpetuates a system of extreme punishment across sentences downward, leading to substantial reductions
the entire sentencing spectrum. in incarceration and producing a more humane, effective,
just, and merciful system.
Despite a natural impulse to believe that applying ever-
harsher punishments will act as a deterrent, this is not
the case. Most people considering whether to commit
crime do not think they will be caught in the first place
and have little knowledge of the severity of punishment
During the COVID-19 pandemic,
for particular crimes. A sentence of 40 years will not the immediate release of elderly
deter a person any more so than a sentence of 20 years, lifers should be a priority.
especially if the individual does not believe he or she
will even be caught. Certainty of apprehension, rather
8 The Sentencing ProjectIn an evolved criminal legal system, far fewer people
would be in prison, and those who were imprisoned
would not stay nearly as long as they currently do. When
incarceration is required, the experience should be
devoted to preparation for release. A comprehensive
plan should be devised early on with the expectation
that individuals will be reintegrated and become
productive members of society. This is the successful
approach used by many other countries.
In 2020, The Sentencing Project undertook its fifth
census8 of people who have been sentenced to life.
Table 1 provides state and federal counts of those serving
life without the possibility of parole (LWOP), life with a
possibility for parole (LWP), and virtual (or “de facto”)
life, sentences of 50 years or longer before an opportunity
for parole.9 During the first eight months of 2020, we
obtained overall counts (as of January 1, 2020) of
persons serving time for each of these three life sentence
types. We also obtained disaggregated counts of lifers
by race, ethnicity, gender, juvenile status at the time of
the offense, and crime of conviction. For the first time,
our survey also captured counts of people serving LWP,
LWOP, and virtual life sentences who are now elderly
(age 55 or older at the time of the survey). We received
data from all jurisdictions to produce the summary
results in the following table.
No End in Sight: America’s Enduring Reliance on Life Imprisonment 9Table 1. State Totals: Life With Parole, Life Without Parole, and Virtual Life Sentences, 2020 State LWP LWOP Virtual Total Percent of Prison Population Alabama 3,413 1,533 714 5,660 26% Alaska - - 398 398 8% Arizona 1,231 531 808 2,570 6% Arkansas 713 542 958 2,213 12% California 33,867 5,134 1,877 40,878 33% Colorado 2,090 790 846 3,726 19% Connecticut 46 68 627 741 6% Delaware 101 377 214 692 19% Florida 3,147 10,438 1,531 15,116 16% Georgia 7,721 1,636 791 10,148 19% Hawaii 311 32 2 345 10% Idaho 521 130 22 673 7% Illinois 5 1,620 2,709 4,334 11% Indiana 85 131 3,724 3,940 14% Iowa 43 705 773 1,521 18% Kansas 1,279 35 173 1,487 15% Kentucky 759 118 462 1,339 6% Louisiana 247 4,377 1,373 5,997 19% Maine 3 62 57 122 6% Maryland 2,240 444 1,125 3,809 21% Massachusetts 977 1,057 57 2,091 28% Michigan 1,129 3,882 646 5,657 15% Minnesota 471 142 6 619 7% Mississippi 491 1,589 370 2,450 13% Missouri 1,740 1,002 584 3,326 13% Montana 52 55 57 164 6% Nebraska 95 262 613 970 18% Nevada 2,294 501 67 2,862 22% New Hampshire 154 77 21 252 11% New Jersey 1,055 94 566 1,715 9% New Mexico 782 2 14 798 13% New York 7,703 303 290 8,296 19% North Carolina 1,712 1,576 883 4,171 12% North Dakota 39 35 10 84 5% Ohio 6,672 699 1,095 8,466 18% Oklahoma 2,183 936 614 3,733 15% Oregon 713 218 143 1,074 7% Pennsylvania 60 5,375 2,807 8,242 18% Rhode Island 196 28 23 247 13% South Carolina 886 1,214 336 2,436 13% South Dakota - 173 218 391 11% Tennessee 1,855 286 690 2,831 6% Texas 8,156 1,267 9,039 18,462 13% Utah 2,200 47 - 2,247 35% Vermont 137 16 14 167 13% Virginia 1,239 1,628 1,326 4,193 14% Washington 2,320 643 251 3,214 19% West Virginia 314 290 123 727 11% Wisconsin 944 265 466 1,675 7% Wyoming 151 44 149 344 14% FEDERAL 1,025 3,536 1,691 6,252 4% TOTAL 105,567 55,945 42,353 203,865 15% Note: Alaska does not have a statutory category of LWP or LWOP but does use virtual life sentences of 50 years or more. 10 The Sentencing Project
LIFE IN CONTEXT

The U.S. has not always relied on life sentences as               Most recipients of life sentences have committed acts
heavily as it does now. Life sentences have been a part           of violence, which calls for great care in determining
of our corrections systems since the start, but only in           their readiness for release. Professionalized parole
recent decades did it become the expectation that “life           boards, judges, and sentencing review boards can be
means life.”10 The founding of our corrections system             effective in identifying those who are prepared to return
in the early 1800s was driven by a belief that wayward            to the community. Despite understandable concerns
individuals could be “saved” from permanent criminality           about reoffending, longitudinal studies suggest that
through a functional corrections system.11                        persons convicted of violent offenses are not any more
                                                                  likely to commit another violent crime than persons
Our prisons were initially designed with a focus on               convicted of nonviolent offenses. In fact, release from
reformation, correction, and reintegration, at least              a life sentence for homicide yields recommitment rates
theoretically if not in practice.12 Today, our system of          for a new homicide that are astonishingly low and these
“correction” has redefined itself as one of exclusion with        individuals are less likely to commit any act of violence
very little emphasis on rehabilitation. There is too little       than other individuals released from prison.13
accountability for today’s system to show that it is
providing effective rehabilitation programs and services          Before the era of hyperincarceration took hold, the
for individuals in its care. When confronted with high            number of individuals in prison was less than 200,000.
reoffending rates, officials fault the formerly incarcerated      Today it’s 1.4 million,14 with more than 200,000 people
and not the lack of sufficient programming to support             serving life sentences alone. One in 7 people in prison
rehabilitation while people are in prison and/or reentering       is serving a life sentence. There has been a remarkable
the community. This cycle disproportionately impacts              shift in our society’s willingness and even eagerness to
people and communities of color.                                  apply heavy punishments in the name of deterrence, and
                                                                  this applies even more so to people of color.15 Extreme
Just as life sentences are not what they used to be, the          punishment for punishment’s sake is now a hallmark of
parole process is not as it used to be either. Politicians        the justice system with little evidence that such an
have become increasingly responsive to public fears               approach produces better public safety outcomes.
about crime, distorted by media portrayals, rather than
reflective of the true prevalence of crime. In reality, violent   As states cope with the consequences of the 40-year
crime has been declining for nearly three decades and             incarceration buildup, modest sentencing reforms are
is now half its peak from the early 1990s.                        underway to scale back prison populations. The federal

    Extreme punishment for punishment’s sake is now a hallmark of
    the justice system with little evidence that such an approach produces
    better public safety outcomes.

                                                       No End in Sight: America’s Enduring Reliance on Life Imprisonment 11
system, too, is grappling with an overly large prison The Vinter case is remarkable because of the gruesome population as a result of draconian sentences imposed nature of the crimes committed by the three plaintiffs. mostly on people with drug convictions. The gradual In Vinter’s case, he had already been released twice downward tick of the prison population since 2009 is before from prison for serious crimes before committing the result of successful efforts focused on releasing his third serious offense. Despite the severity of these and diverting those convicted of mostly low-level crimes crimes, even these individuals were deemed by the court that exclude people convicted of violence and serving to be capable of reform.18 The concerns for upholding longer prison terms. Reforms at the low end of the human dignity and opportunities for transformation punishment scale are commendable and necessary, but prioritized by other nations, even for the most serious they alone will not make a meaningful dent in mass crimes, contradict the unmitigated harshness of the U.S. incarceration. A surgical focus on reducing sentences criminal legal system. for those convicted of nonviolent crimes leaves untouched the sentences of more than half the people in prison, including those serving life imprisonment. Until we mitigate the pervasive use of life and “life-like” terms as a sentencing response, progress toward a proportionate justice system will remain out of reach. Life sentences, particularly the most extreme of these types (LWOP), are often touted as the humane alternative to the death penalty. Yet many of the problematic aspects of the death penalty are also applicable to life sentences. The legal scrutiny bestowed on the death penalty should also encompass sentences so long that they cannot be outlived. For example, legitimate doubts exist about the accuracy of convictions that have ended with a death sentence. As of yearend 2020, 173 people had been exonerated. These errors raise serious questions about the legitimacy of all sentences, but mechanisms for legal review are not built in for life sentences as they are for death sentences. Other industrialized nations view life sentences, like the death penalty, as immoral and unethical.16 Consider a key decision by the European Court of Human Rights in 2013. In the case of Vinter and Others v. United Kingdom, the Court essentially barred the imposition of life without parole sentences in member nations.17 Based on the principle that all prisoners should have the “right to hope,” the decision requires that individuals who have transformed themselves in prison and have atoned for the harm they have caused should be considered for release. 12 The Sentencing Project
THE FACTS OF LIFE
LONG-TERM TRENDS
We should all be relieved with the downward trajectory                                   sentence, but also a 40% increase in the number of
of violent crime, but it isn’t our tough-on-crime response                               people serving life for a sex-related offense and another
that led to it. Most experts agree that sentencing policies,                             9% increase in the number of people serving life
rather than crime rates, fueled mass incarceration. Life                                 sentences for aggravated assault, robbery, or kidnapping.
imprisonment is a signature piece of mass incarceration,
intended to show how tough we can be on crime.19                                         To place the growth of life imprisonment in perspective,
                                                                                         the national lifer population now exceeds the size of the
As depicted in Figure 1 below, life sentences began to                                   entire prison population of 197,245 people in 1970, just
accrue even before violent crime rates rose somewhat                                     prior to its unyielding climb over the next four decades.
dramatically in the late 1980s and early 1990s, reaching                                 Though the growth in life sentences in all states has
their peak in 1992. By 1995, the violent crime rate in the                               been dramatic over the decades, states with the largest
United States was down 9% and has continued to drop                                      effects are in the South and West of the country.
in the years since. But many states had just begun to
ramp up their mandatory sentencing laws.                                                 Figure 2 provides a view of the states ranked by the
                                                                                         percent difference between the current number of life-
The dramatic expansion of life imprisonment has                                          sentenced prisoners and the total prison population in
occurred in part because of a growing list of allowable                                  1970. Utah and Nevada are at the top of the table because
crimes that authorize it. Between 2012 and 2020, we                                      the current life-sentenced populations in these states
observe growing numbers of lifers convicted of homicide,                                 are more than four times each state’s entire prison
the primary offense for which someone serves a life                                      population in 1970. The next two most dramatic shifts

                                                        Figure 1. Trends in Violent Crime and Life Imprisonment
                                      200,000                                                                                         800

                                      150,000                                                                                         650
      People Serving Life Sentences

                                                                                                                                            Violent crime rate per 100,000

                                      100,000                                                                                         500

                                       50,000                                                                                         350

                                           0                                                                                          200

                                                1984   1988   1992     1996       2000      2004    2008         2012   2016   2019

                                                                     Violent Crime Rate         Life Sentences
                                                                              No End in Sight: America’s Enduring Reliance on Life Imprisonment 13
Figure 2. Percent Difference in 2020 Life-Sentenced-Population and 1970 Prison Population
Utah 458%
Nevada 415%
Alaska 208%
Georgia 198%
Colorado 180%
Arizona 176%
Florida 165%
Idaho 164%
California 163%
Hawaii 151%
Alabama 149%
Wyoming 149%
Louisiana 143%
Mississippi 142%
Arkansas 133%
Pennsylvania 131%
Texas 129%
Delaware 116%
States above the dotted line have
Washington 112%
life-sentenced populations that
New Mexico 108%
New Hampshire 103% are greater than their total prison
Vermont 103% population in 1970.
Oklahoma 103%
Massachusetts 102%
South Dakota 100%
Missouri 97%
Nebraska 97%
Indiana 95%
Ohio 92%
Virginia 90%
South Carolina 89%
Iowa 87%
Tennessee 87%
Kansas 78%
West Virginia 78%
Maryland 73%
North Carolina 70%
New York 69%
Illinois 68%
Rhode Island 65%
Montana 63%
Michigan 62%
Oregon 60%
North Dakota 57%
Wisconsin 56%
Connecticut 47%
Kentucky 47%
Minnesota 39%
Federal 31%
New Jersey 30%
Maine 24%
Note: Prison population data was not provided in 1970 for Alaska, Arkansas, and Rhode Island. For these states we use prison population data for 1971.
14 The Sentencing Projectare in Alaska20 and Georgia, where the life-sentenced Life With the Possibility of Parole
population is approximately twice the entire prison
population of 1970. Further down, we see that in Ohio A total of 105,567 people were serving parole-eligible
there are 92% as many lifers today as total prisoners in life sentences in 2020. Nationally, we find a 3% decline
1970. And in Maine at the bottom, the growth in life- since 2016, led by declines in Florida (down 23%),
sentenced people is still notable: the number of lifers Mississippi (down 18%), New York (down 17%), and
today reflects 24% of the total prison population in 1970. South Carolina (down 19%). Altogether, 28 states report
fewer people serving LWP in 2020 than 2016.
Among the three types of life sentences, the most
Nevertheless, LWP is still a major segment of the prison
extreme, LWOP, has risen considerably faster than either
population in many states. As depicted in Table 2, in
life with parole or virtual life sentences. The number of
Alabama, California, Nevada, New York, and Utah,
people serving LWOP stands at 55,945. Since The
between 16% and 34% of the prison population has a
Sentencing Project first published analyses on the
life-with-parole sentence.
prevalence of life imprisonment in 2003, the number of
people serving LWOP has increased 66% while those A decline in the life with parole population is likely due
serving LWP increased 12%. to a few co-occurring trends: fewer individuals are being
sentenced to LWP (although some are likely receiving
Figure 3. Change Over Time in Life Without Parole and LWOP instead), more people are being released on parole,
Life with Parole, 2003-2020 and individuals are dying while awaiting parole.
80%
Table 2. States With Highest Percent of Persons Serving
66% Life With Parole Compared to Overall Prison Population
60%
LWP as Percent of
State
Prison Population
Utah 34%
40%
California 27%
20% Nevada 18%
12%
New York 17%
0%
Alabama 16%
Life With Parole Life Without Parole
RECENT TRENDS
The United States holds an estimated 40% of the world’s
life-sentenced population, including 83% of those serving
LWOP.21 In 2020, over half the states had more lifers of
any type (LWOP, LWP, or virtual life) than in 2016. Between
2016 and 2020, nationally, life with parole (LWP) dropped
slightly, virtual life imprisonment remained approximately
the same, and life without parole (LWOP) continued to
climb.
No End in Sight: America’s Enduring Reliance on Life Imprisonment 15In Georgia, 840 people are serving life with the possibility of parole
for crimes committed when they were under 18; 45 of these individuals
were 13 or 14 years old at the time of their crime.
Nearly 7,000 people nationwide are serving LWP for Table 3. States With Highest Percent of Persons Serving
crimes committed as minors. Such sentences are Life Without Parole Compared to Overall Prison Population
disproportionately high in California, Georgia, Texas, and
New York. Combined, these states account for nearly LWOP as Percent of
State
two-thirds of the LWP population nationally for crimes Prison Population
committed as youth.
Louisiana 14%
In Georgia, 840 people are serving life with the possibility
of parole for crimes committed when they were under Massachusetts 14%
18; 45 of these individuals were 13 or 14 years old at
the time of their crime. LWP is the dominant category Pennsylvania 12%
of life sentence given to youth in the state by far. While
it does provide an opportunity for eventual release, the Florida 11%
state has a long wait of 30 years for initial parole
consideration. Delaware 10%
Life Without the Possibility of Parole
LWOP is authorized in all states except Alaska, and is Figure 4 shows that states reduced their JLWOP
most prevalent in California, Florida, Louisiana, Michigan population 38% since 2016 and 45% from their peak in
and Pennsylvania. Half of the national population of 2012, now standing at 1,465 people.24 Advocates
people serving LWOP are in these five states. The federal estimate an additional 700 individuals whose sentences
government holds another 3,536 people who are serving have been invalidated but who still await a new sentence.25
LWOP. Nationally, 55,595 people were serving LWOP in
2020. Importantly, over the past four years life with parole and
virtual life sentences also declined 8% and 9% respectively
The U.S. Supreme Court has delivered three rulings since for youth, suggesting a larger reach of these rulings on
2010 which, collectively, hold the sentence of life without the appropriateness of long sentences for young people.
parole unconstitutional for most persons younger than
18 at the time of their crime.22 These rulings and a series Despite the shift in life sentences for youth, the application
of state legislative reforms greatly narrowing the of LWOP sentences continues to increase for everyone
allowable use of this extreme sentence on youth account else (Figure 5). Since 2016, the LWOP population among
for the sharp decline in this incarcerated cohort.23 people 18 and older grew 6% nationwide with increases
across 36 states.
We observe a substantial decline in sentences of LWOP
among those who were under 18 at the time of their
crime; a sentence colloquially referred to as “JLWOP.”
16 The Sentencing ProjectFigure 4. Change in Life Sentenced Population Among Those Under 18 at Time of Their Crime, 2016-2020
0%
-10% -8% -9%
-20%
-30%
-40% -38%
Life With Parole Life Without Parole Virtual Life
Figure 5. Change in Life Sentenced Population Among Those 18 and Older at Time of Their Crime, 2016-2020
6%
6%
4%
2% 1%
0%
-2%
-3%
-4%
Life With Parole Life Without Parole Virtual Life
Virtual Life
In 2020, 42,833 people were serving sentences that Texas dominates on this front with one in five people in
totaled a maximum of 50 years or longer. We refer to prison serving a virtual life sentence. The remaining
this group as serving a virtual life sentence because the states with the highest proportions of the virtual life
term of years they must serve is so long they are unlikely population are Indiana (9%), Pennsylvania (7%), and
to survive it even though they are not statutorily sentenced Illinois (6%). These four states account for 43% of the
to life. individuals serving virtual life sentences nationwide.
No End in Sight: America’s Enduring Reliance on Life Imprisonment 17As depicted in Table 4, as a proportion of their overall Though women comprise a small fraction of the life-
state prison populations, Indiana, Nebraska, Iowa, Illinois, sentenced population (about 3% of all lifers are women),
and Alaska rank among the highest with persons serving the number of women serving life has increased 32%
virtual life. In Indiana, 14% of prisoners have a sentence faster than men over the past decade. Today one in 15
of at least 50 years. women in prison has a life sentence. In some states,
the representation of women serving life is astonishing:
one in 4 women in California prisons and one in 5 women
Table 4. States with Highest Percent of Persons Serving in Massachusetts prisons has life.
Virtual Life Sentences Compared to Overall Prison
Population The rise in life imprisonment among women has also
been far more rapid than the overall prison population
Percent of Prison increase in women serving time for violent offenses.
State
Serving Virtual Life Between 2008 and 2020, the number of women
imprisoned for a violent crime increased 2%, but the
Indiana 14%
number of women serving a life sentence increased
Nebraska 11% 20%. When analysis is limited to life-without-parole
sentences, we see that the number of women serving
Iowa 9% these sentences increased by 43% compared to 29% for
men.
Alaska 8%
Illinois 7%
RACE AND GENDER
People of color are overrepresented among those serving
life in nearly every state, as shown in Table 5. In Georgia,
Illinois, Louisiana, and Maryland, more than two-thirds
of the life-sentenced population is African American.
While most lifers are men, 3% are women. Among African
American women in prison, one in 9 is serving life. One
in 5 Black men in prison is serving a life sentence.
Life sentences are being served disproportionately by
African Americans, Latinxs, and other people of color.
Nationally, two thirds of people serving life are people
of color, with 46% Black and 16% Latinx. Among people
serving LWOP, the most extreme life sentence, 55% are
Black.
18 The Sentencing ProjectTable 5. Racial and Ethnic Composition of People Serving Life and Virtual Life Sentences, 2020 Jurisdiction Life and Virtual Life Population Percent Black Percent White Percent Latinx Percent Other Alabama 5,660 65% 34% N/A 0% Alaska 398 11% 45% 5% 39% Arizona 2,570 19% 42% 32% 6% Arkansas 2,213 54% 43% 2% 1% California 40,878 33% 20% 39% 8% Colorado 3,726 23% 46% 26% 4% Connecticut 741 54% 25% 20% 0% Delaware 692 63% 37% 0% 0% Florida 15,116 54% 35% 11% 1% Georgia 10,148 72% 25% 3% 1% Hawaii 345 6% 26% 5% 63% Idaho 673 2% 77% 15% 6% Illinois 4,334 67% 21% 11% 1% Indiana 3,940 48% 47% 4% 1% Iowa 1,521 26% 64% 7% 3% Kansas 1,487 38% 48% 11% 3% Kentucky 1,339 29% 68% 2% 1% Louisiana 5,997 74% 25% N/A 0% Maine 122 7% 80% 3% 9% Maryland 3,809 76% 19% 2% 2% Massachusetts 2,091 34% 41% 20% 4% Michigan 5,657 66% 33% 0% 1% Minnesota 619 38% 48% 4% 10% Mississippi 2,450 72% 27% 1% 0% Missouri 3,326 49% 50% N/A 1% Montana 164 1% 86% N/A 13% Nebraska 970 35% 47% 13% 5% Nevada 2,862 26% 46% 23% 5% New Hampshire 252 6% 86% 5% 3% New Jersey 1,715 64% 21% 13% 1% New Mexico 798 9% 33% 51% 7% New York 8,296 56% 18% 24% 2% North Carolina 4,171 60% 34% 2% 3% North Dakota 84 11% 70% 5% 14% Ohio 8,466 52% 45% 2% 1% Oklahoma 3,733 34% 51% 6% 9% Oregon 1,074 11% 72% 12% 5% Pennsylvania 8,242 62% 28% 9% 1% Rhode Island 247 36% 40% 23% 2% South Carolina 2,436 67% 32% 1% 1% South Dakota 391 6% 73% 3% 18% Tennessee 2,831 54% 43% 2% 1% Texas 18,462 39% 33% 27% 1% Utah 2,247 6% 60% 21% 13% Vermont 167 5% 92% 1% 3% Washington 3,214 16% 61% 13% 10% West Virginia 727 16% 83% 0% 0% Wisconsin 1,675 47% 41% 9% 3% Wyoming 344 5% 76% 12% 8% FEDERAL 6,252 59% 28% 10% 3% TOTAL 203,865 46% 32% 16% 3% Note: Virginia is not included because the state did not provide data. N/A = The state did not provide Latinx data No End in Sight: America’s Enduring Reliance on Life Imprisonment 19
AGING LIFERS                                                       “...the whole pod donated vitamins, some emergen-c
                                                                   vitamin tea...I love him like my own father and look
In 1996 Clarence Givens was sentenced to 110 years in              out for him as best I can or would for my own...I
Wisconsin for selling less than three grams of heroin to           don’t know what we would do if we [lost] him for
an undercover informant. Because of prior nonviolent               he is a peacekeeper around here, he keeps the other
offenses on his record, the prosecutor was authorized              inmates from fighting with each other and guides
to charge him under the state’s habitual offender law,             many of us when we are going down the wrong
which allows additional years to be added to a sentence            paths in here.”
based on prior convictions, regardless of the severity of
the present offense. The sentencing judge referred to         Givens was admitted to the hospital the day after this
him as a “genocidal merchant of death” and cautioned          note was sent and within 24 hours he was unconscious
him and others not to expect “...leniency from the courts     and breathing on a respirator. Clarence Givens passed
if they persist in their vile behavior.” He said he wished    away from COVID-19 on December 7, 2020. He was 68
to send “a message to those struggling to raise their         years old.
children in neighborhoods ruled by violence and drugs
that the courts will deal harshly with those who drain        In 2020, 61,417 people who are at least 55 years old
the lifeblood of their neighborhoods.” Despite the high-      were serving life sentences, part of a growing trend of
blown rhetoric of the court, there is no evidence to          elderly imprisoned Americans. In fact, the number of
support that sentencing Givens to 110 years in prison         people in prison today who are age 55 or older has tripled
was necessary for either punitive or public safety reasons.   since 2000.27 The tough-on-crime policies that expanded
Indeed, established research conducted well before            life sentencing, prolonged the time to review cases for
Givens was sentenced, finds that as one seller is removed     possible parole releases, or abolished parole altogether,
from the community through incarceration, a new one           have accelerated the build-up as well.28 Between 1993
is frequently substituted so long as there is demand for      and 2013, the prevalence of individuals age 55-65
drugs.26                                                      expanded by more than 150%. Today, people who are
                                                              55 and older account for 12% of state prison populations.
Since his arrival in prison, Givens developed prostate        Even more troubling, elderly persons account for 30%
cancer, had two hip replacement surgeries, and, as a          of the life-sentenced population.
result of a botched second surgery, was confined to a
wheelchair. During his 24 years of imprisonment, Givens       Figure 6. Percent of Life Sentenced Population Who
remained steadily employed in various positions within        Are 55 and Older
the institution and routinely received the highest marks
on his performance. He incurred few disciplinary records
and was the quintessential model for other individuals
in prison.                                                                                   Age 55+
                                                                                               30%
As COVID-19 began its inevitable spread through the
U.S. prison system, Givens, like thousands of others,
asked for mercy in the form of release from prison to
be home with his wife and family. But on November 13,                        Younger than 55
2020, Givens developed a high fever. His cellmate relayed
                                                                                    70%
the events of the day before his admission to the hospital,
writing:

20 The Sentencing Project
CLARENCE GIVENS
No End in Sight: America’s Enduring Reliance on Life Imprisonment 21Table 6. Elderly Lifers
State Percent of Lifers Who are 55 and Older The aging population of people in prison has serious
Montana 44% cost implications. Medical costs consume a large
North Carolina 43% proportion of prison budgets and those costs will
Delaware 42% continue to grow as people age and confront worsening
New Jersey 42% health.29
Maine 42%
Wyoming 40% The percentage of people in prison serving all types of
South Carolina 40% life sentences who are now elderly is provided in Table
Idaho 39% 6. States with the highest percentage of life-sentenced
Massachusetts 39% prisoners who are elderly include Delaware, Maine,
Michigan 39% Michigan, New Jersey, and North Carolina. In these
South Dakota 39%
states, approximately 43% of the life-sentenced
Florida 39%
population is at least 55 years old. In some states, the
Alaska 38%
number of older persons serving LWOP is even more
Missouri 37%
staggering: more than half of the LWOP population in
Arizona 37%
Idaho, Massachusetts, and South Dakota are over 55
Oregon 36%
New Hampshire 36%
years old.
Louisiana 36%
Finally, 675 people who are at least 55 years old are still
Maryland 35%
imprisoned on a life sentence for crimes committed in
Oklahoma 34%
Connecticut 34%
their youth, amounting to 7% of the juvenile life-sentenced
Nevada 34%
population. For this cohort we estimate an average least
Arkansas 34% amount of time-served of 37 years, when accounting
North Dakota 33% for entering prison at 18 and reaching age 55. This
Minnesota 33% average time-served is an underestimate, however, as
Pennsylvania 33% there are many life-sentenced prisoners who are well
Colorado 32% above 55 but who have been incarcerated since their
Ohio 32% mid to late teens. And in some states, such as Georgia,
Wisconsin 32% children sentenced as young as 13 years old are still
Illinois 32%
serving life sentences.
Rhode Island 31%
Texas 31%
New Mexico 31% CRIME OF CONVICTION
California 31%
Washington 31%
As depicted in Figure 7, most people (91%) serving life
Vermont 31% sentences have been convicted for a violent offense.30
New York 30%
Mississippi 30%
Homicide
Tennessee 30%
Nebraska 27%
Fifty-seven percent of lifers have been convicted for
Georgia 26% murder, and 72% of those convicted of murder had been
Kansas 26% convicted of first-degree murder. While state and federal
Utah 25% statutes differ in their naming conventions, it is typical
Kentucky 25% that within the offense category of murder there is a
Indiana 22% range of degrees which indicate aggravating or mitigating
Alabama 18% factors. First-degree murder is weighted more heavily
Iowa 11% than second-degree murder, which is weighted more
Hawaii 1%
heavily than third-degree murder. In many states, the
West Virginia 0%
role of the defendant as an accessory or auxiliary actor
TOTAL 30%
Note: Data on elderly lifer population not provided from the
Federal Bureau of Prisons, Virginia, or West Virginia.
22 The Sentencing ProjectFigure 7. Crime of Conviction Within the Life Sentenced Population
Other
4%
Drug
Property 2%
2%
Aggravated Assault
Kidnapping 4%
3%
Violent Sex-Related Offenses
91% 19%
Murder
57%
Robbery
8%
Note: Some offenses categorized by the state as “other” may include violent crimes.
in the crime may permit a reduction in the degree from Other Crimes of Violence
first to second. In other places, such as Texas, the
distinction is less apparent in the statute. Texas has a Nineteen percent of people sentenced to life have been
“law of parties’’ clause which requires that all individuals convicted of a sex-related offense. In some states,
involved in an underlying felony that resulted in a convictions are accompanied by indefinite prison terms
homicide receive the same life sentence, even if they that might range from one year to life. This is the case
were not the principal actor.31 in Nevada and Utah, which has allowed for the states’
long sentences for most sex-related offenses. These
In Pennsylvania and Louisiana, second degree murder
crimes are disproportionately responsible for their high
indicates “felony murder,” which generally means that
number of life sentences overall. In Utah 54% of lifers
someone was killed during the commission of a felony,
have been convicted of a sex-related offense; in Nevada
such as a gas-station robbery gone bad. A person can
it’s 28%.
be found guilty of felony murder even if they did not kill
anyone or plan to kill anyone during the commission of
Though life imprisonment was historically used only for
the felony. However, in these two states, second degree
the most serious offenses, over time lawmakers have
murder, like first degree, carries with it a mandatory
expanded the allowable use of life sentences for
LWOP sentence. In Pennsylvania, 31% of the lifers
convictions of robbery, aggravated assault, and
convicted of murder have been convicted of second or
kidnapping. Today, 15% of life-sentenced persons,
third degree.
No End in Sight: America’s Enduring Reliance on Life Imprisonment 23amounting to one in 7 lifers, had a governing crime of robbery, aggravated assault, or kidnapping. Among these are 16,700 people sentenced to life for a robbery, 8,500 people sentenced to life for an aggravated assault, and 5,000 people sentenced to life for a kidnapping. In Florida, 20% of the state’s 10,000 people serving LWOP sentences have been convicted of a robbery and 23% of the 1,500 individuals serving virtual life terms have been convicted of a robbery. Virginia reports that 14% of its life-sentenced population has been convicted of an aggravated assault, including 50% of the virtual life population. Like Virginia and Florida, Iowa is a state that no longer uses a parole mechanism for its life-sentenced population; 14% of the LWOP population in this state has been convicted of kidnapping. Drug Crimes The federal drug laws adopted in the late 1980s and early 1990s dramatically reshaped the federal prison population. The federal system also abolished parole in 1987. This means that all life sentences in the federal system imposed since this time require that prisoners serve their time until they die or in the unlikely event of a presidential commutation or grant of compassionate release. Nationally, 3,974 people are serving life sentences for a drug-related offense, and 38% of these people are in the federal prison system. Forty-one states have incarcerated people on life sentences for drug-related offense. While nationally only 2% of those serving life have been convicted of a drug crime, some states rely on life for drug crimes much more readily. In Iowa, for instance, 18% of lifers have been convicted of a drug crime, and in Alabama, it is 12%. Across 11 states a total of 250 people are serving LWOP for a drug-related crime.32 24 The Sentencing Project
PROBLEMS WITH LIFE IMPRISONMENT

The tough-on-crime era beginning in the 1980s ushered          AGING OUT: YOUNG AND OLD
in laws that removed discretion from the federal
and state legal systems. In place of individualized
                                                               Youth Sentenced to Life
assessment that was responsive to individual needs
                                                               Lengthy prison sentences ignore the fact that most
and allowed post-conviction adjustments when
                                                               people who commit crime, even those who have
warranted, jurisdictions throughout the United States
                                                               committed a series of crimes, age out of criminal
have implemented a host of laws and policies that create
                                                               conduct. The age-crime curve is evident across dozens
permanent punishment through diminishing exit points
                                                               of empirical studies on the topic and reflects the fact
from the system. Some of the key hallmarks of this era
                                                               that people are most at-risk for committing crime in the
were the proliferation of habitual offender laws, truth-
                                                               late teenage years to their mid-twenties.34 After this age,
in-sentencing schemes and other mandatory minimum
                                                               proclivity toward committing more crime typically
statutes, and the abolishment or politicization of parole.
                                                               declines steadily.35 This relationship between age and
Because of these extreme measures, sentences can
                                                               crime exists consistently regardless of race or ethnicity,
be arbitrary and disproportionate to the seriousness of
                                                               education level, community disadvantage, or income.36
the crime.
                                                               While those who engage in violence may take a while
Fair Wayne Bryant was sentenced to life with no chance         longer to distance themselves from crime, the aging out
for parole in 1997 for attempting to steal a pair of hedge     process begins its downward slope in the average case
clippers. Such a disproportionate sentence was possible        by one’s mid-20s.
because of Louisiana’s habitual offender law which
allowed prosecutors to obtain a life sentence after a          Analysis of Bureau of Justice Statistics data shows the
fourth felony, only one of which must be violent. In           peak age of arrest for robbery is 19, declining by more
Bryant’s case, his qualifying “violent offense” of attempted   than half by the late twenties. Likewise, the peak age for
armed robbery occurred years earlier in 1979. He had           murder is 20, a rate that is more than halved by one’s
already served ten years “hard labor” in prison for the        30s and is less than one quarter of its peak by one’s
offense. His remaining crimes before the incident with         40s.37 Even among the small number of people identified
the hedge clippers were nonviolent and theft-related, all      as “chronic offenders” who have committed a series of
committed to fuel his untreated substance use disorder.        serious crimes, most no longer engage in criminal
Louisiana’s 2017 criminal justice reform package, though       behavior past their late 30s.38 And yet, a growing segment
limited in overall scope, modified the habitual offender       of prisoners sentenced when they were young have
law, which allowed for a review of Bryant’s case and           served decades in prison beyond their point of public
prompted his release in August 2020.33                         safety risk. Our analysis reveals that the numbers of
                                                               youth sentenced to life are not insignificant: in Georgia,
Extreme penalties are misaligned with what we know
                                                               Maryland, and Tennessee, and Wisconsin, nearly 10%
about age and criminal behavior, worsen racial disparity
                                                               of the people serving a life sentence were under 18 at
in the system, and impose heavy costs to taxpayers with
                                                               the time of their crime.
diminishing returns on public safety. Informed by the
known data and outcomes of current laws and policies,
we outline the specific problems with life imprisonment
next.

                                                    No End in Sight: America’s Enduring Reliance on Life Imprisonment 25
Elderly Persons with Life Sentences
The experience of aging in prison is different from aging capacity to understand the implications of their conduct,
in free society for two main reasons. First, people who to control it and to foresee the consequences of their
engage in street crime are often in poorer health generally actions. They were prone to impulsive, unconsidered
before they arrive in prison.39 Damaging lifestyle habits behaviour that could result in criminally reprehensible
that include substance abuse and other high-risk conduct.” The government further explains that
behaviors, as well as neglect of routine medical care sentencing someone at age 65 to a life sentence of at
and lack of access to medical care, often underlie poor least 25 years would not provide a realistic chance of
health. Second, the experience of prison itself ages freedom before their death and is therefore unacceptable.46
individuals more quickly. Prison is a high-stress Throughout Europe, all life sentences must include a
environment. Medical conditions develop sooner in life reasonable expectation of release and the details of
among imprisoned people with disproportionately high possible release are discussed at sentencing.47
rates of dementia, cancer, arthritis, and hypertension,
as well as declines in mental health.40 As prisoners grow To commit just one person to spend the rest of his or
old, they also become more vulnerable to assault and her life in prison is at least a one-million-dollar investment
other types of mistreatment from younger prisoners.41 for the state.48 A look at parole-eligible lifers in Georgia
brings this into sharper focus. To begin, 10% of the prison
Correctional institutions are obligated under law to population in the state is 55 years old or older, including
provide adequate health care to people in prison, as 2,159 parole-eligible lifers. On average, these individuals
established by two landmark Supreme Court cases, have served 26 years of their life sentence so far, with
Estelle v. Gamble, 429 U.S. 97 (1976) and Brown v. Plata, a range from one to 62 years of time-served. Per prisoner
563 U.S. 493 (2011). Prisons are ill-equipped to serve cost in Georgia is $24,070 a year.49
as infirmaries or nursing homes and they do it badly at
enormous human and fiscal cost. At the federal level, The yellow bar in Figure 8 indicates our recommended
facilities spend approximately five times more on medical 20 year-cap for life sentences. After this point most
care for older persons than those who are younger.42 At prisoners are at very low risk of offending and should
the state level, the cost of treating an older population be released. If these 2,159 elderly individuals serving
is likewise increased. A recent national analysis of health LWP were released at 21 years of time-served,50 19,436
care spending on imprisoned persons 55 and older found prison-years would be saved and the state could avoid
that the median cost per prisoner was 37% higher in the spending approximately $462 million to continue to
ten states with the highest share of individuals 55 and incarcerate them. Even the release of just 25% of elderly
older.43 lifers at 21 years would lead to a savings of 4,859 prison-
years, or $116 million. This same analysis could be done
Preeminent scholars on the worldwide use of life in every state reflecting billions of dollars in savings
imprisonment, Dirk van zyl Smit and Catherine Appleton, billions of dollars that could be positively invested in
argue that the United States’ general acceptance of evidence-based crime prevention and intervention
sentencing people to die in prison contradicts international strategies.
human rights standards and practices.44 Indeed, several
countries prohibit life sentences for elderly persons and
most countries place limits on elderly persons being
sentenced to prison.45
In Russia, people 65 or older cannot receive a life
sentence because, like children, elders are “‘vulnerable
social groups who have an underdeveloped and weakened
26 The Sentencing ProjectYou can also read