Non-destructive Measurements of Toona sinensis Chlorophyll and Nitrogen Content Under Drought Stress Using Near Infrared Spectroscopy
←
→
Page content transcription
If your browser does not render page correctly, please read the page content below
ORIGINAL RESEARCH
                                                                                                                                       published: 21 January 2022
                                                                                                                                    doi: 10.3389/fpls.2021.809828

                                             Non-destructive Measurements of
                                             Toona sinensis Chlorophyll and
                                             Nitrogen Content Under Drought
                                             Stress Using Near Infrared
                                             Spectroscopy
                                             Wenjian Liu 1 , Yanjie Li 1 , Federico Tomasetto 2 , Weiqi Yan 3 , Zifeng Tan 1 , Jun Liu 1* and
                                             Jingmin Jiang 1
                                             1
                                              Research Institute of Subtropical Forestry, Chinese Academy of Forestry, Hangzhou, China, 2 AgResearch Ltd.,
                                             Christchurch, New Zealand, 3 Department of Computer Science, Auckland University of Technology, Auckland, New Zealand

                                             Drought is a climatic event that considerably impacts plant growth, reproduction
                                             and productivity. Toona sinensis is a tree species with high economic, edible and
                           Edited by:
                                             medicinal value, and has drought resistance. Thus, the objective of this study was to
                     Andrea Mastinu,         dynamically monitor the physiological indicators of T. sinensis in real time to ensure the
            University of Brescia, Italy
                                             selection of drought-resistant varieties of T. sinensis. In this study, we used near-infrared
                        Reviewed by:
                                             spectroscopy as a high-throughput method along with five preprocessing methods
                     Alexandru Gavan,
Iuliu Haţieganu University of Medicine      combined with four variable selection approaches to establish a cross-validated
              and Pharmacy, Romania          partial least squares regression model to establish the relationship between the near
                  Agus Arip Munawar,
      Syiah Kuala University, Indonesia
                                             infrared reflectance spectroscopy (NIRS) spectrum and physiological characteristics
                  *Correspondence:
                                             (i.e., chlorophyll content and nitrogen content) of T. sinensis leaves. We also tested
                             Jun Liu         optimal model prediction for the dynamic changes in T. sinensis chlorophyll and
                 ucjackley@gmail.com
                                             nitrogen content under five separate watering regimes to mimic non-destructive and
                   Specialty section:
                                             dynamic detection of plant leaf physiological changes. Among them, the accuracy
         This article was submitted to       of the chlorophyll content prediction model was as high as 72%, with root mean
                   Plant Abiotic Stress,
                                             square error (RMSE) of 0.25, and the RPD index above 2.26. Ideal nitrogen content
               a section of the journal
            Frontiers in Plant Science       prediction model should have R2 of 0.63, with RMSE of 0.87, and the RPD index of
      Received: 05 November 2021             1.12. The results showed that the PLSR model has a good prediction effect. Overall,
      Accepted: 16 December 2021             under diverse drought stress treatments, the chlorophyll content of T. sinensis leaves
       Published: 21 January 2022
                                             showed a decreasing trend over time. Furthermore, the chlorophyll content was the
                             Citation:
     Liu W, Li Y, Tomasetto F, Yan W,
                                             most stable under the 75% field capacity treatment. However, the nitrogen content of
      Tan Z, Liu J and Jiang J (2022)        the plant leaves was found to have a different and variable trend, with the greatest drop
     Non-destructive Measurements
                                             in content under the 10% field capacity treatment. This study showed that NIRS has
        of Toona sinensis Chlorophyll
and Nitrogen Content Under Drought           great potential for analyzing chlorophyll nitrogen and other elements in plant leaf tissues
           Stress Using Near Infrared        in non-destructive dynamic monitoring.
                       Spectroscopy.
         Front. Plant Sci. 12:809828.        Keywords: NIR spectroscopy, drought stress, chlorophyll and nitrogen contents, variable selection, dynamic
     doi: 10.3389/fpls.2021.809828           monitoring, partial least square regression (PLSR)

Frontiers in Plant Science | www.frontiersin.org                                  1                                       January 2022 | Volume 12 | Article 809828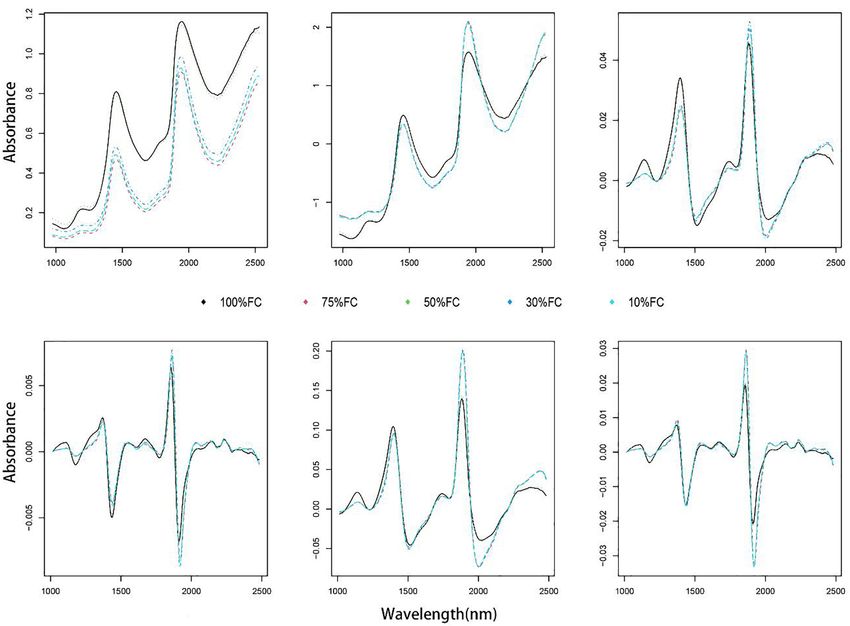
Liu et al.                                                                                             Non-destructive Measurements of Toona sinensis

INTRODUCTION                                                                    Traditionally, chemical methods in the laboratory are used
                                                                            to detect physiological signals. Although highly accurate,
Due to global climate change, droughts around the world have                these methods are destructive, time-consuming, expensive, and
become more frequent and have increased in severity, which will             use highly contaminating reagents. Near infrared reflectance
have a serious impact on the growth of plants and crops (Stocker,           spectroscopy (NIRS) has recently been found to provide cost-
2014; Mazis et al., 2020). In addition, extreme drought and a               effective and accurate measures of chemical traits in plant
lack of precipitation are thought to exacerbate climate change              leaves regardless of species, ecological environment or region.
(Jia et al., 2020). Drought impacts vegetation differentially across        NIRS is rapid, chemical-free, simple to use and non-destructive
fields, seasons and species (Douma et al., 2012), and available             (Manley, 2014). Previous work with Medicago sativa (Naya
water ground and rain are the most important factors that                   et al., 2007) demonstrated that NIRS were able to measure
significantly influence plant growth and productivity (Hoover               macronutrients and micronutrients. Relative reflectance is the
et al., 2014; Gao et al., 2019; Khaleghi et al., 2019). The reduction       near infrared range (between 800 and 1,200 nm) and was also
in groundwater leads to potential plant mortality (Estiarte et al.,         used to show drought-related stress impacts (Mazis et al., 2020).
2016). Recently, more attention has been given to how plants                Numerous research investigations have used NIRS to predict
respond to water availability (Khaleghi et al., 2019). Drought              the ecophysiological variables related to plant drought stress,
resistance (DR) is defined as the mechanism causing minimum                 which constrains relative water and leaf water in disease-resistant
water loss in a water deficit environment while maintaining its             trees (Warburton, 2014; Conrad and Bonello, 2016). Partial
production. DR is determined by how quickly and efficiently a               least squares regression (PLSR) is one of the most frequently
plant senses changing environmental conditions, and how the                 used chemometric methods in spectral calibration analysis (Li
plant adopts and combines the aforementioned strategies in                  et al., 2021). It has advantages when large amounts of data with
response to diminished water availability (Baresel et al., 2017).           redundancy and high collinearity exist and when the number
DR is linked to a combination of morphological, anatomical and              of variables is greater than the number of samples (Liang et al.,
physiological traits (Lozano et al., 2020). In fact, plant species          2020). Pre-processing approaches like standard normal variate
in dry environments have deeper roots, slightly denser stems,               (SNV), smoothing and derivatives are often required in the
thicker and denser leaves and relatively high N content per                 process of spectral analysis (Li et al., 2021). In addition, we can
leaf space to optimize water usage (Markesteijn et al., 2011).              also choose a variety of variable selection methods to reduce the
Conversely, drought stress typically reduces photosynthetic                 impact of irrelevant variables on the accuracy of the model (Shao
capacity and carbon storage in the form of non-structural                   et al., 2017). However, due to strict spectral models, plant species
carbohydrate (NSC) concentrations and plant respiration rates               and their spectral measurement required various assumptions for
(Centritto et al., 2009; Bongers et al., 2017).                             the proposed model.
    Toona sinensis, also called Chinese toon or Chinese mahogany,               In our study, three varieties of T. sinensis seeds with large
is a deciduous woody plant, with straight trunk, hard wood and              differences in DR were selected as experimental materials. For the
beautiful texture, has high economic value in the wood industry             first time, we used NIRS to predict nutrient content in T. sinensis
(Peng et al., 2019). In addition, T. sinensis is also a precious            leaves in a drought stress environment and dynamically monitor
medicinal plant as the leaves rich in protein, fat, minerals,               the drought response of T. sinensis seedlings in real time to
flavonoids, terpenoids, and vitamins (Chen et al., 2009; Shi et al.,        ensure the selection of high-quality drought-resistant varieties of
2021). However, the nutrient element in the leaves varies rapidly           T. sinensis. Here, three hypotheses were proposed: (1) the PLSR
under the influence of water, with DR (Peng et al., 2019).                  model combined with preprocessing methods and four variable
    The leaf is a vital organ for measuring plant ecological                selection methods could predict the chlorophyll and nitrogen
traits (Petit Bon et al., 2020). Plants under drought conditions            content of T. sinensis leaves; (2) NIRS bands could characterize
will reduce leaf area and increase leaf thickness (Rowland                  wavelengths related to chlorophyll and nitrogen in T. sinensis
et al., 2020). Drought stress also alters plant physiological               leaves; and (3) NIRS models could detect chlorophyll and
processes, among which amendments to pigment composition                    nitrogen content in T. sinensis under various drought stresses.
and subsequent photosynthesis are the most critical (Males
and Griffiths, 2017). A reduction in chlorophyll affected by
moisture content has been reported (He and Dijkstra, 2014). The             MATERIALS AND METHODS
chlorophyll content incorporates a sensible correlation with the
photosynthetic capacity and the development stage of vegetation,            Plant Material and Treatments
which are indicators of photosynthetic capacity (Zhang et al.,              The experiment was conducted in a greenhouse on a mountain
2014). Nitrogen (N) is one of the main macroelements needed                 in Fuyang, Zhejiang, China (E 119.570 , N 30.030 ). The annual
for plant growth. Nitrogen in plants constitutes amino acids and            average temperature in the greenhouse is 28◦ C, with relative
proteins, but it is also an elementary component of chlorophyll             humidity > 75% and daily sunshine up to 13 h, making growth
nucleic acids, multiple coenzymes, vitamins, and plant hormones             conditions very suitable for T. sinensis seedlings. To study the
(Hammad and Ali, 2014). N plays a crucial role in evaluating the            differences in DR between different T. sinensis varieties, three
intensity of vegetation photosynthesis and vegetation nutritional           varieties of T. sinensis seeds with large variations in DR from
status. Therefore, the chlorophyll and nitrogen content of plant            northern (N), central (C) and southern (S) China were selected
leaves can be used to analyze DR.                                           as experimental materials.

Frontiers in Plant Science | www.frontiersin.org                        2                                    January 2022 | Volume 12 | Article 809828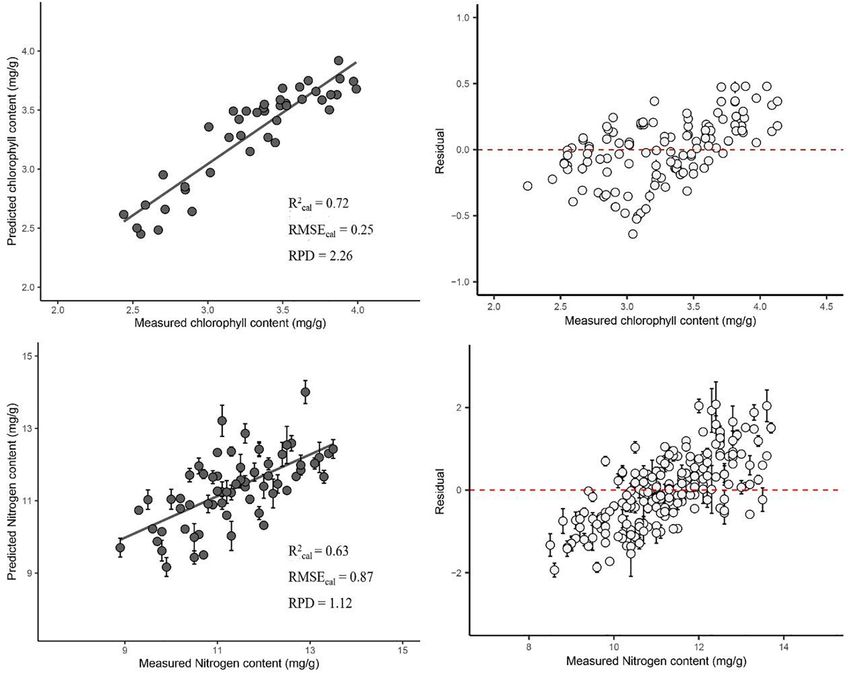
Liu et al.                                                                                                             Non-destructive Measurements of Toona sinensis

   In the initial stage, seedlings of relatively consistent size were                    information using the same method. The experiment lasted
selected from the nutrient cup [16 cm (d) × 14 cm (h)] and                               for 2 months.
transplanted into the experimental pot [30 cm (h) × base 27 cm
(d)]. An appropriate amount of compound fertilizer was applied                           Near Infrared Reflectance Spectroscopy
uniformly, leaving the seedlings to grow for approximately                               Collection
14 days. When the seedlings grew five to seven functional leaves,                        The NIRS data were taken from the upside surface of the leaves
the water control treatment started (August 10, 2020).                                   three times with a handheld fiber optic contact probe from a field-
                                                                                         based spectrometer (LF-2500, Spectral Evolution, United States)
Experimental Design                                                                      (Li et al., 2021). Each spectrum took on average 20 scans with
A completely randomized experimental design was conducted in                             8 m/s integration time and a range between 1,100 and 2,500 nm
a greenhouse to model various physiological traits of T. sinensis                        with a 6 nm spectral resolution. In total, 760 samples were
leaves under various water stresses. Five water gradients were                           collected for the construction of chlorophyll (n = 360) and
created: (I) in the control treatment, where the pots were watered                       nitrogen (n = 400) content prediction models.
to 100% field capacity (FC) replacing the amount of water
transpired daily (100% FC); (II) light stress (75% FC) with relative                     Leaf Chlorophyll Content Measurement
soil water content (RWC) accounting for field holding capacity                           A mixed solution of 5 ml 1:1 (5 ml acetone: 5 ml absolute ethanol)
with 75% of water content; (III) moderate severe stress (50% FC)                         was added to a test tube. We took 0.5 g of T. sinensis leaves, cut
with RWC accounting for 50% of field water holding capacity;                             them into one mm wide filaments and put the sample into a test
(IV) severe stress (30% FC) with RWC accounting for field                                tube. We then sealed the test tube and placed it in the dark to
holding capacity of 30% of water content; (V) extreme stress (10%                        soak for 24 h. For the chlorophyll measurement, we took one ml
FC) with RWC accounting for 10% of field water holding capacity                          of extract sample and two ml of a mixture of acetone and pure
(Khaleghi et al., 2019).                                                                 ethanol. We then used a UV–visible spectrophotometer (UV-
   As shown in Table 1, there were two blocks in this experiment.                        1280, Shimadzu, Japan) to measure chlorophyll absorbance at 645
Block 1 was used for model construction. There were 20                                   and 663 nm (Gu et al., 2016).
T. sinensis seedlings of three varieties in each treatment, for                             The following formula were applied:
a total of 300 seedlings. The basin weighing method for soil
was adopted for moisture control of the soil within the set                              Chlorophyll a = (12.72D663 − 2.59D645 ) V × N/M × 1000
range, weighing it once every 3 days, and replenishing water                             Chlorophyll b = (22.88D645 − 4.67D663 ) V × N/M × 1000
occasionally. To ensure the accuracy and stability of the model,
the spectrum was collected at 3 pm every Saturday, followed                               Chlorophyll = Chlorophyll a + Chlorophyll b
by destructive sampling to measure chlorophyll and nitrogen
                                                                                         where V is the volume of photosynthetic pigment extract (ml), W
indicators. For each treatment, up to three T. sinensis seedling
                                                                                         is the sample (g), and N is the dilution factor.
varieties were selected, and then six leaves were selected from
the upper, middle and lower parts of each plant for spectral
measurements. After collecting the spectrum, the corresponding                           Leaf Nitrogen Content Measurement
T. sinensis leaves were picked, numbered and placed in a                                 Toona sinensis leaves were dried in a drying oven at 80◦ C for
paper bag and then sent back to the laboratory in a 4◦ C                                 48 h to constant weight and then ground with a ball mill. To
freezer for refrigeration to measure the chlorophyll and nitrogen                        determine the total nitrogen content, an appropriate amount of
content (Li et al., 2019). The first data collection and trait                           sample was taken with concentrated H2 SO4 -H2 O for digestion,
measurement began after the first week of water control. Repeat                          and a Kjeldahl nitrogen analyzer was used for automatic analysis
the above operation 6 times. Block 2 was used for model                                  (Horneck and Miller, 1997).
verification, dynamically monitoring the changes in chlorophyll
and nitrogen content of T. sinensis seedlings under different                            Near Infrared Reflectance Spectroscopy
periods and various drought treatments. In this experiment,                              Data Analysis
T. sinensis seedlings of each variety and in each treatment                              All modeling analyses were conducted in Rstudio (PBC, v4.0.4)
(n samples = 10) were selected (total of 150 samples). Every                             (Team, 2020). The pipeline has two independent phases: (1)
Saturday at 5 pm, the upper, middle, and lower parts of the plant                        transformations and outlier detection and (2) model training and
were selected to collect corresponding near-infrared spectroscopy                        model selection (Yu et al., 2021). To correct the effects of light

TABLE 1 | The number and layout of T. sinensis seedlings from northern (N), central (C), and southern (S) China under different treatment conditions.

                        100%FC                          75%FC                             50%FC                          30%FC                           10%FC

                N         C           S            N       C          S          N          C         S          N         C           S          N        C          S

Block 1        20         20         20            20     20         20         20          20       20         20         20          20        20        20        20
Block 2        10         10         10            10     10         10         10          10       10         10         10          10        10        10        10

Frontiers in Plant Science | www.frontiersin.org                                     3                                          January 2022 | Volume 12 | Article 809828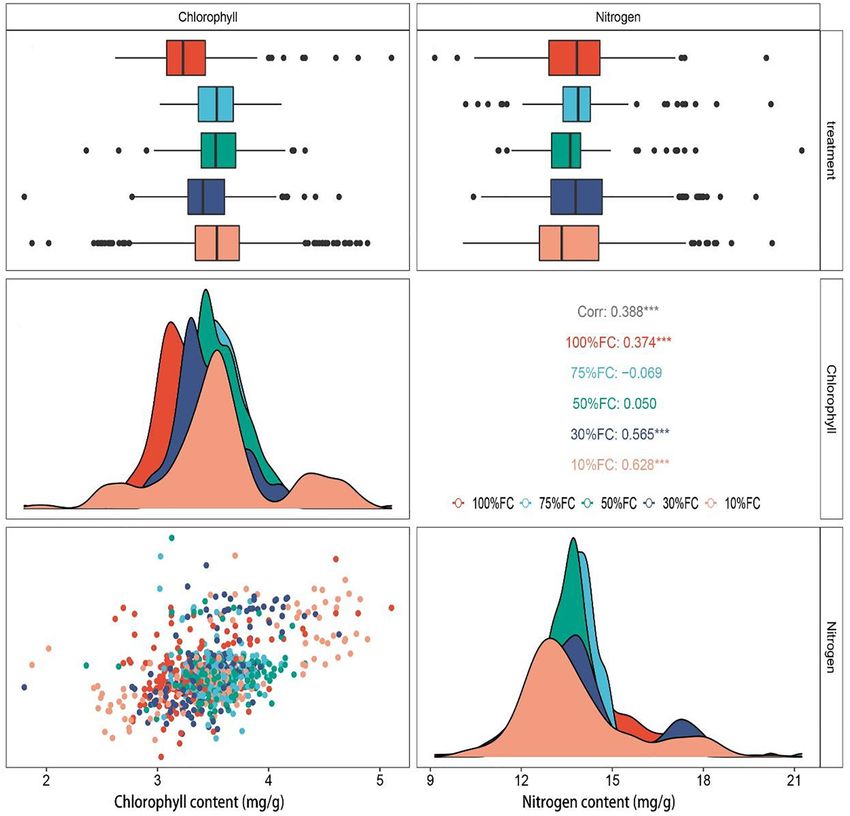
Liu et al.                                                                                                  Non-destructive Measurements of Toona sinensis

scattering or highlight the differences in absorption of light at          the collected T. sinensis seedlings is shown in Table 2. The
different wavelengths, different spectral pretreatments, including         large range of data ensures the robustness of the models
standard normal variate (SNV), the first-order and the second-             derived from the data.
order differential with Savitzky–Golay smoothing along with                   The original spectra of T. sinensis seedlings collected before
their combinations were systematically applied to the averaged             different water treatments are shown in Figure 1A, which
spectrum per sample (Alchanatis et al., 2005; Li et al., 2019).            clearly illustrates that the original spectra of all samples show
    The PLSR model (Hansen and Schjoerring, 2003) is a statistical         similar changes. The wavelengths have significant peaks between
linear method for fitting a curve by minimizing the sum of                 1,400 ∼ 1,500 and 1,900 ∼ 2,000 nm (Figure 1A). Before
squared deviations, which combines the advantages of multiple              modeling, five preprocessing methods were utilized to preprocess
linear regression, correlation analysis, and principal components.         the spectrum, as shown in Figures 1B,F.
It is broadly applied in the near-infrared spectroscopy context (Li
et al., 2021). Here, the samples were randomly split 100 times
into calibration (80%) for model building and validation (20%)             Establishment and Optimization of a
for testing. Four variable selection methods, the genetic algorithm        Near Infrared Spectroscopy Estimation
PLS (GA), backward variable elimination PLS (Bve), significance            Model of Chlorophyll and Nitrogen in
multivariate correlation (sMC), and regularized elimination
                                                                           T. sinensis Seedling Leaves
procedure in PLS (Rep), were used to extract important spectral
                                                                           In the PLSR prediction models, the first derivative combined
feature variables from the preprocessed near-infrared spectral
                                                                           with SG smoothed spectrum (FSG) preprocessing predicted the
data (Shao et al., 2017; Liang et al., 2020). Each selection method
                                                                           best result for the chlorophyll and nitrogen content. Combining
was repeated 100 times. The selected model was then combined
                                                                           five spectral preprocessing methods with four variable selection
with the PLSR for prediction modeling of chlorophyll and
                                                                           methods for PLSR modeling significantly improved the accuracy
nitrogen content.
                                                                           of the model (mean chlorophyll and nitrogen R2 Cal were 0.71
    To avoid the model overfitting, the number of latent variables
                                                                           and 0.62, respectively, with mean R2 val = 0.51 and 0.56, mean
of each PLS model have been set as less than 10 and the best
                                                                           RMSECal = 0.26 and 0.88, mean RMSEval = 0.30 and 0.76;
latent variables number for each model has been selected use
                                                                           Figure 1). As a result, chlorophyll prediction showed R2 Cal = 0.73,
the one-sigma heuristic (Franklin, 2005) method. The evaluation
                                                                           with R2 val = 0.67, RMSECal = 0.25, and RMSEval = 0.26
of model performance was based on the calibrated correlation
                                                                           (Supplementary Figure 3A).
coefficient (R2 cal ), the root mean square error of the calibration
                                                                               Our modeling comparison showed that the prediction model
set (RMSECal ), the correlation coefficient of the validation set
                                                                           established by using the SNV combined with the second
(R2 val ), the validation root mean square error set (RMSEval ),
                                                                           derivative and SG smoothing spectra (SNV_SSG) preprocessing,
residuals (R), and residual predictive deviation (RPD) (Hassan
                                                                           as well as the Ga variable selection method, performed the
et al., 2015). Generally, a preferred model should have high values
                                                                           best (Supplementary Figures 1, 3A). The mean R2 Cal = 0.72,
of R2 Cal , R2 val , and RPD, and lower RMSECal , RMSEval values.
                                                                           R2 val = 0.51, RMSECal = 0.25 and RMSEval = 0.28, RPD = 2.26.
The closer the R2 is to 1 with a RMSE and residuals close to 0,
                                                                               Nitrogen content prediction showed R2 Cal l and R2 val = 0.73
the better the prediction performance and stability of the model
                                                                           and 0.66, respectively, RMSECal and RMSEval = 0.85
(Nicolai et al., 2007).
                                                                           and 0.71 (Supplementary Figure 3B). The prediction
                                                                           model established by using the first derivative combined
Model Inversion                                                            with SG smoothing spectra (FSG) preprocessing and the
To obtain non-destructive dynamic monitoring of chlorophyll                sMC variable selection method again performed the best
and N content in T. sinensis seedling leaves under various                 (Supplementary Figures 2, 3B) with R2 Cal = 0.63 (range
water conditions, one-way ANOVA was applied to examine the
variations in chlorophyll and nitrogen of T. sinensis leaves under
different drought stress treatments (Khaleghi et al., 2019). The
variations between treatments were identified by using post hoc            TABLE 2 | Statistics of chlorophyll and nitrogen content of T. sinensis seedling
tests of Tukey’s honest significance difference (HSD).                     leaves with different water gradients.

                                                                           Treatment       Content       Max(mg/g)       Min(mg/g)       Mean(mg/g)           SD

                                                                           100% FC        Chlorophyll        4.23            2.93            3.57         0.48
RESULTS
                                                                                           Nitrogen         13.90            6.00           10.71         1.59
                                                                           75% FC         Chlorophyll        4.05            3.16            3.19         0.52
Statistics for Sampling Information and
                                                                                           Nitrogen          14.5            6.50           10.73         1.59
Data Preprocessing for Near-Infrared                                       50% FC         Chlorophyll        4.54            2.42            3.32         0.39
Spectroscopy                                                                               Nitrogen          13.7            6.8            11.34         1.10
To establish a spectral prediction model with high prediction              30% FC         Chlorophyll        4.55            2.53            3.39         0.51
accuracy, three different varieties of T. sinensis seedlings under                         Nitrogen         14.80            8.10           11.54         1.11
separate drought stress treatments were selected as sample                 10% FC         Chlorophyll        4.23            2.47            3.23         0.55
sets. The chlorophyll and nitrogen content information of                                  Nitrogen         14.50            7.80           12.02         1.63

Frontiers in Plant Science | www.frontiersin.org                       4                                            January 2022 | Volume 12 | Article 809828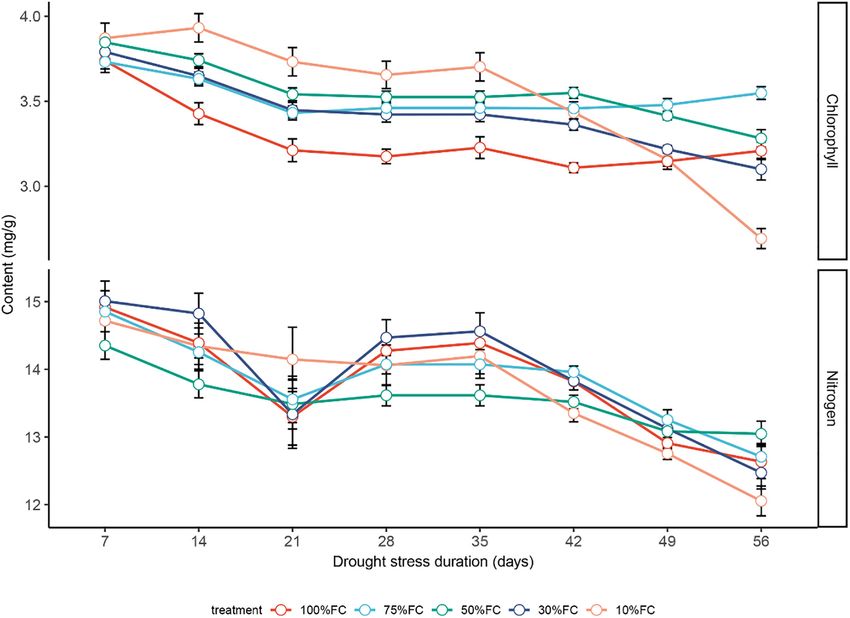
Liu et al.                                                                                                          Non-destructive Measurements of Toona sinensis

  FIGURE 1 | Original and various pretreatment spectra of T. sinensis seedling leaves collected under distinct water gradients. (A) Original spectra, (B) SNV: SNV
  spectra, (C) FSG: the first derivative combined with S-G smoothing spectra, (D) SSG: the second derivative combined with S-G smoothing spectra, (E) SNV_FSG:
  SNV combined with the first derivative and S-G smoothing spectra, (F) SNV_SSG: SNV combined with the second derivative and S-G smoothing spectra.

between 0.60 and 0.66), R2 val = 0.52 (ranging from 0.46 to 0.57),                    Optimal Model to Predict the Chlorophyll
RMSECal = 0.87 and RMSEval = 0.79, RPD = 1.12.                                        and Nitrogen Contents of T. sinensis
                                                                                      Leaves
Extraction of Characteristic Wavelength                                               In general, under drought treatments, the chlorophyll content of
The GA variable selection method found that the characteristic                        T. sinensis leaves showed a decreasing trend over time. Among
wavelengths of chlorophyll content were 1,420, 1,694 and                              them, the chlorophyll content was the most stable under the 75%
2,160 nm (Figure 2A). Among them, 1,420 nm was found to have                          FC treatment, with the highest chlorophyll content on the 56th
the greatest influence on the prediction model, followed by 2,160                     day (3.75 mg/g; Figure 4). The chlorophyll content of plant leaves
and 1,694 nm. Conversely, the N content prediction model only                         under extreme water stress treatment (10% FC) treatment was
included two significant and important regions, 2,210 nm and                          significantly higher than other treatments in the first 35 days but
1,265 nm (Figure 2B).                                                                 dropped rapidly resulting in a significant lower value compared
                                                                                      to the rest of other treatments (Figure 4). In the first week
                                                                                      of the experiment, there was no divergence between different
Comparisons of Optimal Model Results                                                  drought treatments.
The residual value of the chlorophyll prediction model was                               Under different drought treatments, the leaf nitrogen content
between −0.5 and 0.5, indicating that the model had a good                            of T. sinensis seedlings changed over time, with a maximum
fitting outcome (Figures 3A,B). Conversely, the residual value                        increase in nitrogen content in the 10% FC treatment. The N
of the N content prediction model was between −2 and 2,                               content dropped at 35 and 56 days after the drought treatment
indicating a weaker performance (cv. chlorophyll content model;                       (Figure 4). Overall, the chlorophyll and nitrogen content of
Figures 3C,D).                                                                        plant leaves in the early period of drought were less affected by

Frontiers in Plant Science | www.frontiersin.org                                  5                                        January 2022 | Volume 12 | Article 809828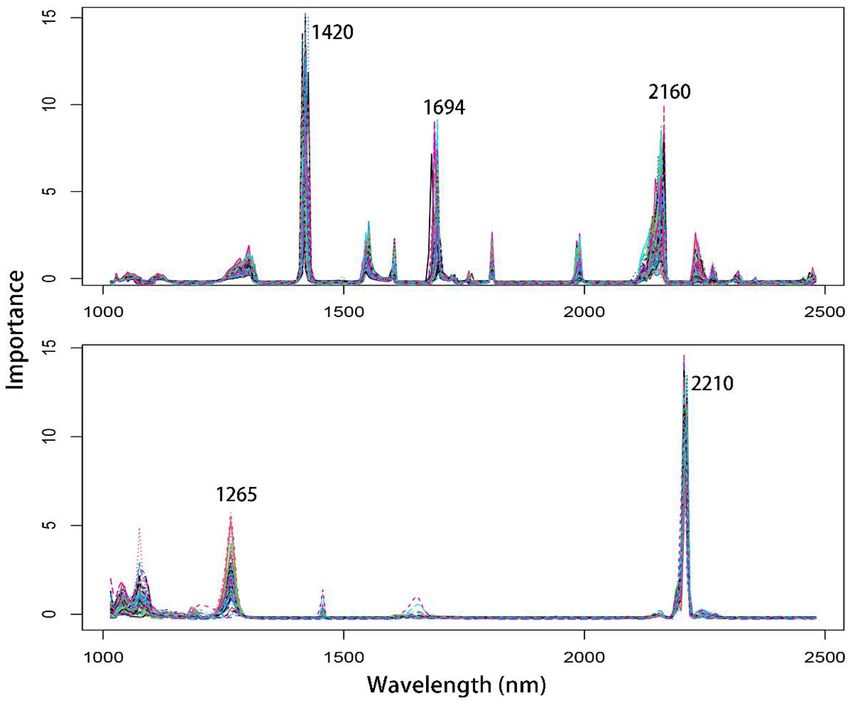
Liu et al.                                                                                                             Non-destructive Measurements of Toona sinensis

  FIGURE 2 | Characteristic wavelength extraction map of T. sinensis seedling leaves based on optimal spectral preprocessing and variable selection methods.
  (A) Chlorophyll content characteristic wavelength selection with the Ga variable selection method. (B) Nitrogen content characteristic wavelength selection with the
  sMC variable selection method.

water. After 35 days, the extreme drought treatment (10% FC;                                Due to the influence of environmental factors such as light
Figures 5A,B) was significantly lower than other treatments, and                        conditions, the collected spectrum can contain more noise,
the leaves began to yellow.                                                             which affects the construction of the spectrum model (Bobelyn
   Under the three treatments with sufficient water (100%                               et al., 2010). Spectral preprocessing effectively eliminates the
FC), severe stress (30% FC), and extremely severe stress (10%                           influence of instrument noise (Martens et al., 1991). It has been
FC), the chlorophyll and nitrogen content of T. sinensis leaves                         reported that the choice of preprocessing method depends on
showed a significant positive correlation. Under mild drought                           the nature of the spectrum and the component characteristics
stress (75% FC), both chlorophyll and nitrogen were not                                 that need to be predicted (Balabin et al., 2007). In our case,
significantly correlated.                                                               the original spectra of all samples showed similar content
                                                                                        trends, but there were clear variations between the spectra for
                                                                                        100% FC and the other four treatments. This change may
DISCUSSION                                                                              be related to the difference in the cell structure and optical
                                                                                        propagation characteristics of T. sinensis leaves under various
Chlorophyll and nitrogen (N) content in T. sinensis were                                water treatments. At present, there are many kinds of spectral
detected using five spectral preprocessing and four variable                            preprocessing methods, which can be divided into baseline
selection methods with a PLSR predictive modeling approach.                             correction, scatter correction, smoothing, etc. according to the
The results showed that (1) chlorophyll content prediction                              effect of preprocessing (Li et al., 2019, 2021). Baseline correction
was best determined by using SNV combined with the second                               includes first-order and second-order derivative, etc.; scattering
derivative and SG smoothing spectra (SNV_SSG) preprocessing                             correction includes multiplicative scatter correction (MSC), SNV,
method as well as GA variable selection method; (2) N                                   etc.; smoothing includes S-G smoothing, etc. (Nicolai et al., 2007;
content prediction was determined by the first derivative                               Liang et al., 2020). Among them, the derivative processing is
combined with SG smoothing spectra (FSG) preprocessing                                  mainly to deduct the influence of instrument background or drift
method and sMC variable selection method. Overall, under                                on the signal; MSC and SNV are used to eliminate the influence
various drought stress treatments, the T. sinensis leaf chlorophyll                     of scattering on the spectrum due to uneven particle distribution
content showed a decreasing trend, with the most stable                                 and different particle sizes; S-G smoothing can very effectively
chlorophyll content under the 75% FC treatment. Conversely,                             improve the spectral information, reduce the influence of random
the nitrogen content of the plant leaves showed a variable                              noise (Hassan et al., 2015). Therefore, combining different
trend, and the nitrogen content decreased the most under the                            preprocessing methods was beneficial to improve the accuracy
10% FC treatment.                                                                       of the model. The results showed that different preprocessing

Frontiers in Plant Science | www.frontiersin.org                                    6                                         January 2022 | Volume 12 | Article 809828
Liu et al. Non-destructive Measurements of Toona sinensis FIGURE 3 | Optimal PLS model of the chlorophyll content based on SNV_SSG combined with the Ga variable selection method (A) and the nitrogen content based on FSG combined with the sMC variable selection method (C). Residuals plotted of chlorophyll content (B) and nitrogen content (D). methods reduced the spectral signal-to-noise ratio (SNR) to correlated with the intensity of those specific peaks. Furthermore, various degrees and improved the accuracy. Compared with the Lee et al. (2000) found that chlorophyll has a strong absorption other four processing methods, the standard normal variable value in the visible and NIRS produced by the conjugated C– (SNV) focuses on baseline removal, and the spectral smoothing C and C = C bonds of the porphyrin ring and magnesium result is weak (Figure 1B). This confirms that equipment, (Mg) ions. Moreover, Kokaly (2001) also reported, with high range, environment, and other spectrometer factors affect the accuracy, NIRS regions related to the chlorophyll contents preprocessing spectral results. The combination of multiple [1768, 1818, 1850, 2076, 2304, and 2350 nm; cv. (Leon-Saval preprocessing methods determined a high accuracy, which is et al., 2004)]. Min and Lee (2005) studied citrus leaves and conducive to constructing the best model performance. Variable found that significant wavelengths for chlorophyll detection were selection instead reduces the number of irrelevant variables, 448, 669, 719, 1,377, 1,773, and 2,231 nm. In our case, the which may contain noise and outliers, therefore significantly most significant chlorophyll bands were at 1,420, 1,694, and improving the sensor performance (Prananto et al., 2020). 2,160 nm, indicating strong light absorbance by chlorophyll Previous studies such as Cozzolino (2015) showed that plant content at these bands. pigments and phytonutrients in the form of organic matter N is an important component of chlorophyll and protein are directly measured with near-infrared spectroscopy because (Min et al., 2006). The C–H and N–H bonds contained in the these compounds contain chemical bonds that are identified cells are detected in the NIRS (Shao and He, 2013). The protein in signal peaks in the NIRS, and the compound abundance is has a significant influence on the NIRS in the 2,172–2,054 nm Frontiers in Plant Science | www.frontiersin.org 7 January 2022 | Volume 12 | Article 809828
Liu et al.                                                                                                             Non-destructive Measurements of Toona sinensis

  FIGURE 4 | The effect of drought stress treatments on chlorophyll and nitrogen contents in leaves of T. sinensis leaves. The data represent the average of the
  spectrum inversion results under each treatment, and data are reported as the mean ± SE.

  FIGURE 5 | One-way ANOVA was used to examine the discrepancies between separate drought stress treatments over time. (A) Chlorophyll, (B) nitrogen. Vertical
  bars indicate ± SE. Comparison between treatments at the same time different letter indicates statistically significant differences according to Tukey’s HSD test.
  Values sharing a common letter are not significantly different at p < 0.01. Red numbers indicate the duration of drought stress.

wavelength range (Min and Lee, 2005). Similarly, our study found                          Water absorbs light in the near-infrared range. Experiments
that the N content was most significant at 2,210 nm, confirming                        conducted by Curcio and Petty (1951) showed that water has
the accuracy of our variable selection method.                                         prominent absorption bands at wavelengths of 760, 970, 1,190,

Frontiers in Plant Science | www.frontiersin.org                                   8                                          January 2022 | Volume 12 | Article 809828
Liu et al.                                                                                                             Non-destructive Measurements of Toona sinensis

  FIGURE 6 | Chlorophyll (A) and nitrogen (B) content under separate drought treatments. Correlation analysis of chlorophyll and nitrogen content of T . sinensis
  leaves under separate drought treatments (D). Chlorophyll (C) and nitrogen (F) content were normally distributed. Distribution map of chloroplast content of all
  samples (E). Statistical significance was determined by two-tailed t-test with equal variance comparing the unique drought treatments of chlorophyll and nitrogen
  content; ***p < 0.001. Different colors indicate separate treatments, and the corresponding colors are the same as the above figure.

1,450, and 1,940 nm. When the water content in plants is                               1990). Majumdar et al. (1991) reported that chlorophyll was
distinguishable, the reflectance of the visible light and near-                        reduced under drought stress, similar to our results.
infrared spectral regions are also different. Experimental studies                        Several studies have reported a negative impact on plant
have found that when the water content of plants is reduced to                         nutrient absorption by the intensification of drought stress (He
50%, the spectral reflection speed increases significantly (Carter                     and Dijkstra, 2014). For example, the ecological and physiological
and Knapp, 2001). Therefore, the moisture in the leaves may                            responses of Abies fabri seedlings to drought stress and nitrogen
affect the spectral absorption to a certain extent, affecting the                      supply have been reported (Guo et al., 2010). Similar to our
prediction model fitting. In our study, T. sinensis seedling                           study, the nitrogen content of T. sinensis leaves showed a variable
leaves selected during spectrum collection were fresh samples                          trend. Due to the limited water supply, the reduction of plant
containing water. In this context, the prediction models for                           leaf stomatal conductance and carbon (C) assimilation hinds the
chlorophyll and nitrogen content had R2 = 0.72 and 0.62,                               migration of nitrogen and other nutrients in the leaf (Bänziger
respectively, indicating good predictive accuracy but still to be                      et al., 1999; He and Dijkstra, 2014). This is in line with our
improved. Future research should further consider the influence                        findings at 21 days (Figure 6). It has also been supported that
of factors such as moisture to improve model performance.                              drought stress increases the content of malondialdehyde (MDA),
    Chlorophyll content is an important evaluation index of plant                      proline, soluble sugar and other substances, and the nitrogen
responses to drought stress (Hassan et al., 2015). Generally,                          supply in leaves alleviates the effects of drought stress on plants
drought stress not only affects chlorophyll content production                         (He and Dijkstra, 2014). Because the chlorophyll and nitrogen
but also reduces chlorophyll storage capacity (Kuroda et al.,                          contents in leaves are affected by many factors, real-time and

Frontiers in Plant Science | www.frontiersin.org                                   9                                         January 2022 | Volume 12 | Article 809828
Liu et al. Non-destructive Measurements of Toona sinensis
dynamic detection of their contents can help to take early JJ, and ZT supervised all stages of the experiments. All authors
proactive measures. read and approved the final manuscript.
Nitrogen supply has a strong influence on leaf growth (He and
Dijkstra, 2014). Plant leaf area growth promotes photosynthesis
at the same time (Baresel et al., 2017). Chlorophyll is the main FUNDING
product of photosynthesis. Thus, chlorophyll content is also
approximately proportional to leaf nitrogen content (Bojović This research was supported by Fundamental Research Funds of
and Marković, 2009). Similarly, our study found that the CAF (CAFYBB2020SZ004-3).
optimal prediction model based on NIRS technology can predict
chlorophyll and nitrogen content in leaves in a non-destructive
dynamic monitoring way. ACKNOWLEDGMENTS
We acknowledge all authors of articles not mentioned in this
CONCLUSION manuscript due to space limitations.
Our study has shown that NIRS have great potential in field
applications for the analysis of chlorophyll, nitrogen and other SUPPLEMENTARY MATERIAL
elements in plant leaf tissues and can achieve a non-destructive
dynamic monitoring effect. The Supplementary Material for this article can be found
online at: https://www.frontiersin.org/articles/10.3389/fpls.2021.
809828/full#supplementary-material
DATA AVAILABILITY STATEMENT
Supplementary Figure 1 | Linear fitting graph of PLS modeling results of T.
sinensis seedling chlorophyll content based on five spectral preprocessing and
The original contributions presented in the study are included four variable selection methods. Red represents the optimal model for predicting.
in the article/Supplementary Material, further inquiries can be
directed to the corresponding author. Supplementary Figure 2 | Linear fitting graph of PLS modeling results of T.
sinensis seedling Nitrogen content based on five spectral preprocessing and four
variable selection methods. Blue represents the optimal model for predicting.
AUTHOR CONTRIBUTIONS Supplementary Figure 3 | PLS modeling results of chlorophyll (A) and nitrogen
(B) content of T. sinensis seedlings based on five spectral preprocessing and four
YL and WL conceived the ideas and designed the methodology. variable selection methods. R2cal: corrected correlation coefficient, R2val: verified
correlation coefficient, RMSEcal: corrected root mean square error, RMSEval:
WL collected and analyzed the data and wrote the manuscript. verified root mean square error. Red represents the optimal model for predicting
YL guided the data analysis and reviewed the manuscripts. FT chlorophyll content, and blue represents the optimal model for predicting nitrogen
and WY revised the content and grammar of the manuscript. JL, content.
REFERENCES Bongers, F., Olmo, M., Lopez-Iglesias, B., Anten, N., and Villar, R. J. P. B. (2017).
Drought responses, phenotypic plasticity and survival of Mediterranean species
Alchanatis, V., Schmilovitch, Z., and Meron, M. J. P. A. (2005). In-field assessment in two different microclimatic sites. Plant Biol. 19, 386–395. doi: 10.1111/plb.
of single leaf nitrogen status by spectral reflectance measurements. Precis. Agric. 12544
6, 25–39. doi: 10.1007/s11119-005-0682-7 Carter, G. A., and Knapp, A. K. J. A. J. O. B. (2001). Leaf optical properties in higher
Balabin, R. M., Safieva, R. Z., Lomakina, E. I. J. C., and Systems, I. L. plants: linking spectral characteristics to stress and chlorophyll concentration.
(2007). Comparison of linear and nonlinear calibration models based on Am. J. Bot. 88, 677–684. doi: 10.2307/2657068
near infrared (NIR) spectroscopy data for gasoline properties prediction. Centritto, M., Lauteri, M., Monteverdi, M. C., and Serraj, R. J. J. O. E. B. (2009). Leaf
Chemom. Intell. Lab. Syst. 88, 183–188. doi: 10.1016/j.chemolab.2007. gas exchange, carbon isotope discrimination, and grain yield in contrasting rice
04.006 genotypes subjected to water deficits during the reproductive stage. J. Exp. Bot.
Bänziger, M., Edmeades, G., and Lafitte, H. J. C. S. (1999). Selection 60, 2325–2339. doi: 10.1093/jxb/erp123
for drought tolerance increases maize yields across a range of nitrogen Chen, H.-D., Yang, S.-P., Wu, Y., Dong, L., and Yue, J.-M. (2009). Terpenoids from
levels. Crop Sci. 39, 1035–1040. doi: 10.2135/cropsci1999.0011183x00390004 Toona ciliata. J. Nat. Prod. 72, 685–689. doi: 10.1021/np800811b
0012x Conrad, A. O., and Bonello, P. J. F. I. P. S. (2016). Application of infrared and
Baresel, J. P., Rischbeck, P., Hu, Y., Kipp, S., Barmeier, G., Mistele, B., et al. raman spectroscopy for the identification of disease resistant trees. Front. Plant.
(2017). Use of a digital camera as alternative method for non-destructive Sci. 6:1152. doi: 10.3389/fpls.2015.01152
detection of the leaf chlorophyll content and the nitrogen nutrition status Cozzolino, D. J. M. (2015). The role of visible and infrared spectroscopy
in wheat. Comput. Electron. Agric. 140, 25–33. doi: 10.1016/j.compag.2017. combined with chemometrics to measure phenolic compounds in grape
05.032 and wine samples. Molecules 20, 726–737. doi: 10.3390/molecules20010
Bobelyn, E., Serban, A.-S., Nicu, M., Lammertyn, J., Nicolai, B. M., Saeys, W. J. P. B., 726
et al. (2010). Postharvest quality of apple predicted by NIR-spectroscopy: Curcio, J. A., and Petty, C. C. J. J. (1951). The near infrared absorption spectrum of
Study of the effect of biological variability on spectra and model performance. liquid water. JOSA 41, 302–304. doi: 10.1364/JOSA.41.000302
Postharvest Biol. Technol. 55, 133–143. doi: 10.1016/j.postharvbio.2009. Douma, J. C., Bardin, V., Bartholomeus, R. P., and Van Bodegom, P. M. J. F.
09.006 E. (2012). Quantifying the functional responses of vegetation to drought and
Bojović, B., and Marković, A. J. K. J. O. S. (2009). Correlation between nitrogen and oxygen stress in temperate ecosystems. Funct. Ecol. 26, 1355–1365. doi: 10.1111/
chlorophyll content in wheat (Triticum aestivum L.). Kragu. J. Sci. 31, 69–74. j.1365-2435.2012.02054.x
Frontiers in Plant Science | www.frontiersin.org 10 January 2022 | Volume 12 | Article 809828Liu et al. Non-destructive Measurements of Toona sinensis
Estiarte, M., Vicca, S., Peñuelas, J., Bahn, M., Beier, C., Emmett, B. A., et al. and drought. Physiol. Plant. 81, 473–480. doi: 10.1111/j.1399-3054.1991.
(2016). Few multiyear precipitation–reduction experiments find a shift in the tb05087.x
productivity–precipitation relationship. GCB 22, 2570–2581. doi: 10.1111/gcb. Males, J., and Griffiths, H. J. F. E. (2017). Functional types in the Bromeliaceae:
13269 relationships with drought-resistance traits and bioclimatic distributions.
Franklin, J. (2005). The elements of statistical learning: data mining, inference and Funct. Ecol. 31, 1868–1880. doi: 10.1111/1365-2435.12900
prediction. Math. Intell. 27, 83–85. Manley, M. J. C. S. R. (2014). Near-infrared spectroscopy and hyperspectral
Gao, J., Zhang, L., Tang, Z., and Wu, S. J. J. O. E. (2019). A synthesis of ecosystem imaging: non-destructive analysis of biological materials. Chem. Soc. Rev. 43,
aboveground productivity and its process variables under simulated drought 8200–8214. doi: 10.1039/C4CS00062E
stress. J. Ecol. 107, 2519–2531. doi: 10.1111/1365-2745.13218 Markesteijn, L., Poorter, L., Paz, H., Sack, L., Bongers, F. J. P., Cell, et al. (2011).
Gu, D.-D., Wang, W.-Z., Hu, J.-D., Zhang, X.-M., Wang, J.-B., and Wang, B.- Ecological differentiation in xylem cavitation resistance is associated with stem
S. J. J. O. (2016). Nondestructive determination of total chlorophyll content in and leaf structural traits. Plant Cell Environ. 34, 137–148. doi: 10.1111/j.1365-
maize using three-wavelength diffuse reflectance. J. Appl. Spect. 83, 541–547. 3040.2010.02231.x
doi: 10.1007/s10812-016-0325-y Martens, H., Stark, E. J. J. O. P., and Analysis, B. (1991). Extended multiplicative
Guo, J., Yang, Y., Wang, G., Yang, L., and Sun, X. J. P. P. (2010). Ecophysiological signal correction and spectral interference subtraction: new preprocessing
responses of Abies fabri seedlings to drought stress and nitrogen supply. Physiol. methods for near infrared spectroscopy. J. Pharm. Biomed. Anal. 9, 625–635.
Plant. 139, 335–347. doi: 10.1111/j.1399-3054.2010.01370.x doi: 10.1016/0731-7085(91)80188-F
Hammad, S. A., and Ali, O. A. J. A. O. A. S. (2014). Physiological and biochemical Mazis, A., Choudhury, S. D., Morgan, P. B., Stoerger, V., Hiller, J., Ge, Y.,
studies on drought tolerance of wheat plants by application of amino acids and et al. (2020). Application of high-throughput plant phenotyping for assessing
yeast extract. Ann. Agri. Sci. 59, 133–145. doi: 10.1016/j.aoas.2014.06.018 biophysical traits and drought response in two oak species under controlled
Hansen, P., and Schjoerring, J. J. R. S. O. E. (2003). Reflectance measurement of environment. For. Ecol. Manage. 465:118101. doi: 10.1016/j.foreco.2020.118101
canopy biomass and nitrogen status in wheat crops using normalized difference Min, M., and Lee, W. J. T. O. T. A. (2005). Determination of significant wavelengths
vegetation indices and partial least squares regression. Remote Sens. Environ. and prediction of nitrogen content for citrus. Trans. ASAE. 48, 455–461. doi:
86, 542–553. doi: 10.1016/S0034-4257(03)00131-7 10.13031/2013.18308
Hassan, H., Fan, M., Zhang, T., and Yang, K. J. A. J. O. F. T. (2015). Prediction of Min, M., Lee, W. S., Kim, Y. H., and Bucklin, R. A. J. H. (2006). Nondestructive
total phenolics and flavonoids contents in Chinese wild rice (Zizania latifolia) detection of nitrogen in Chinese cabbage leaves using VIS–NIR spectroscopy.
using FT-NIR spectroscopy. Am. J. Food Technol. 10, 109–117. doi: 10.3923/ajft. HortScience 41, 162–166. doi: 10.21273/HORTSCI.41.1.162
2015.109.117 Naya, L., Ladrera, R., Ramos, J., González, E. M., Arrese-Igor, C., Minchin, F. R.,
He, M., and Dijkstra, F. A. J. N. P. (2014). Drought effect on plant nitrogen and et al. (2007). The response of carbon metabolism and antioxidant defenses of
phosphorus: a meta-analysis. New Phytol. 204, 924–931. doi: 10.1111/nph.12952 alfalfa nodules to drought stress and to the subsequent recovery of plants. Plant
Hoover, D. L., Knapp, A. K., and Smith, M. D. J. E. (2014). Resistance and Physiol. 144, 1104–1114. doi: 10.1104/pp.107.099648
resilience of a grassland ecosystem to climate extremes. Ecol. 95, 2646–2656. Nicolai, B. M., Beullens, K., Bobelyn, E., Peirs, A., Saeys, W., Theron, K. I.,
doi: 10.1890/13-2186.1 et al. (2007). Nondestructive measurement of fruit and vegetable quality by
Horneck, D. A., and Miller, R. O. J. H. O. R. M. F. P. A. (1997). Determination of means of NIR spectroscopy: A review. Postharvest Biol. Technol. 46, 99–118.
total nitrogen ln plant tlssue. Handb. Ref. Methods Plant Anal. 1997:75. doi: 10.1016/j.postharvbio.2007.06.024
Jia, Y., Van Der Heijden, M. G., Wagg, C., Feng, G., and Walder, F. J. J. O. E. (2020). Peng, W., Liu, Y., Hu, M., Zhang, M., Yang, J., Liang, F., et al. (2019). Toona sinensis:
Symbiotic soil fungi enhance resistance and resilience of an experimental a comprehensive review on its traditional usages, phytochemisty, pharmacology
grassland to drought and nitrogen deposition. J. Ecol. 2020:13521. doi: 10.1111/ and toxicology. Rev. Bras. Farmacogn. 29, 111–124. doi: 10.1016/j.bjp.2018.0
1365-2745.13521 7.009
Khaleghi, A., Naderi, R., Brunetti, C., Maserti, B. E., Salami, S. A., and Babalar, Petit Bon, M., Bohner, H., Kaino, S., Moe, T., and Brathen, K. A. J. M. I. E.
M. J. S. R. (2019). Morphological, physiochemical and antioxidant responses of (2020). One leaf for all: Chemical traits of single leaves measured at the leaf
Maclura pomifera to drought stress. Sci. Rep. 9, 1–12. surface using near-infrared reflectance spectroscopy. Method Ecol. Evolut. 11,
Kokaly, R. F. J. R. S. O. E. (2001). Investigating a physical basis for spectroscopic 1061–1071. doi: 10.1111/2041-210X.13432
estimates of leaf nitrogen concentration. Remote Sens. Environ. 75, 153–161. Prananto, J. A., Minasny, B., and Weaver, T. (2020). Near infrared (NIR)
doi: 10.1016/S0034-4257(00)00163-2 spectroscopy as a rapid and cost-effective method for nutrient analysis of plant
Kuroda, M., Oaiawa, T., and Imagawa, H. J. P. P. (1990). Changes in chloroplast leaf tissues. Adv. Agron. 164, 1–49.
peroxidase activities in relation to chlorophyll loss in barley leaf segments. Rowland, L., Da Costa, A. C., Oliveira, R. S., Bittencourt, P. R., Giles, A. L.,
Physiol. Plant. 80, 555–560. doi: 10.1111/j.1399-3054.1990.tb05678.x Coughlin, I., et al. (2020). The response of carbon assimilation and storage to
Lee, J., Lee, B., Kim, K., and Son, J. J. J. O. T. K. S. F. H. S. (2000). Growth long-term drought in tropical trees is dependent on light availability. Funct.
of vegetable seedlings in decomposed expanded rice hull-based substrates. Ecol. 35, 43–53. doi: 10.1111/1365-2435.13689
J. Korean Soc. Horti.Sci. 41, 249–253. Shao, W., Li, Y., Diao, S., Jiang, J., Dong, R. J. A., and Chemistry, B. (2017).
Leon-Saval, S., Birks, T., Wadsworth, W., Russell, P. S. J., and Mason, M. J. O. E. Rapid classification of Chinese quince (Chaenomeles speciosa Nakai) fruit
(2004). Supercontinuum generation in submicron fibre waveguides. Opt. Exp. provenance by near-infrared spectroscopy and multivariate calibration. Anal.
12, 2864–2869. doi: 10.1364/OPEX.12.002864 Bioanal. Chem. 409, 115–120. doi: 10.3390/s130201872
Li, Y., Liu, W., Cao, R., Tan, Z., Liu, J., and Jiang, J. J. P. M. (2021). Spectrometric Shao, Y., and He, Y. J. S. (2013). Visible/near infrared spectroscopy and
prediction of wood basic density by comparison of different grain angles and chemometrics for the prediction of trace element (Fe and Zn) levels in rice leaf.
variable selection methods. Plant Methods 17, 1–10. Sensors 13, 1872–1883.
Li, Y., Sun, Y., Jiang, J., and Liu, J. J. P. M. (2019). Spectroscopic determination Shi, Q.-Q., Zhang, X.-J., Wang, T.-T., Zhang, Y., Zeb, M. A., Zhang, R.-H., et al.
of leaf chlorophyll content and color for genetic selection on Sassafras tzumu. (2021). Toonaones A- I, limonoids with NLRP3 inflammasome inhibitory
Plant Methods 15, 1–11. activity from Toona ciliata M. Roem. Phytochem. 184:112661. doi: 10.1016/j.
Liang, L., Wei, L., Fang, G., Xu, F., Deng, Y., Shen, K., et al. (2020). Prediction phytochem.2021.112661
of holocellulose and lignin content of pulp wood feedstock using near infrared Stocker, T. (2014). Climate change 2013: the physical science basis: Working Group
spectroscopy and variable selection. Spectrochim Acta. Part A 225:117515. doi: I contribution to the Fifth assessment report of the Intergovernmental Panel on
10.1016/j.saa.2019.117515 Climate Change. Cambridge: Cambridge university press. 2014:3544.
Lozano, Y. M., Aguilar-Trigueros, C. A., Flaig, I. C., and Rillig, M. C. J. F. E. Team, R. C. J. R. F. F. S. C. (2020). R: A language and environment for statistical
(2020). Root trait responses to drought are more heterogeneous than leaf trait computing. Version 4.0. 2. Vienna: R Core Team.
responses. Funct. Ecol. 34, 2224–2235. doi: 10.1111/1365-2435.13656 Warburton, G. B. (2014). The Dynamical Behaviour of Structures: Structures and
Majumdar, S., Ghosh, S., Glick, B. R., and Dumbroff, E. B. J. P. P. (1991). Solid Body Mechanics Series. Amsterdam: Elsevier.
Activities of chlorophyllase, phosphoenolpyruvate carboxylase and ribulose-1, Yu, K., Fang, S., Zhao, Y. J. S. A. P. A. M., and Spectroscopy, B. (2021). Heavy
5-bisphosphate carboxylase in the primary leaves of soybean during senescence metal Hg stress detection in tobacco plant using hyperspectral sensing and
Frontiers in Plant Science | www.frontiersin.org 11 January 2022 | Volume 12 | Article 809828Liu et al. Non-destructive Measurements of Toona sinensis
data-driven machine learning methods. Spectrochim. Acta. PartA 245:118917. Publisher’s Note: All claims expressed in this article are solely those of the authors
doi: 10.1016/j.saa.2020.118917 and do not necessarily represent those of their affiliated organizations, or those of
Zhang, Y., Guanter, L., Berry, J. A., Joiner, J., Van Der Tol, C., Huete, A., et al. the publisher, the editors and the reviewers. Any product that may be evaluated in
(2014). Estimation of vegetation photosynthetic capacity from space-based this article, or claim that may be made by its manufacturer, is not guaranteed or
measurements of chlorophyll fluorescence for terrestrial biosphere models. endorsed by the publisher.
CCB 20, 3727–3742. doi: 10.1111/gcb.12664
Copyright © 2022 Liu, Li, Tomasetto, Yan, Tan, Liu and Jiang. This is an open-access
Conflict of Interest: FT was employed by company AgResearch Ltd. article distributed under the terms of the Creative Commons Attribution License
(CC BY). The use, distribution or reproduction in other forums is permitted, provided
The remaining authors declare that the research was conducted in the absence of the original author(s) and the copyright owner(s) are credited and that the original
any commercial or financial relationships that could be construed as a potential publication in this journal is cited, in accordance with accepted academic practice. No
conflict of interest. use, distribution or reproduction is permitted which does not comply with these terms.
Frontiers in Plant Science | www.frontiersin.org 12 January 2022 | Volume 12 | Article 809828You can also read