North Carolina Safety and Emissions Inspection and Maintenance Programs - NC.gov
←
→
Page content transcription
If your browser does not render page correctly, please read the page content below
North Carolina Safety and Emissions
    Inspection and Maintenance
             Programs
Study to Examine Whether the Frequency of
 Vehicle Safety and Emissions Inspections
  Should Be Decreased in North Carolina

               A Report to the
 Joint Legislative Transportation Oversight
                 Committee

Submitted by the North Carolina Department
    of Transportation and Department
         of Environmental Quality

                 Final Report
                March 1, 2018
Overview The 2017 session of the North Carolina General Assembly directed the Department of Transportation (DOT), Division of Motor Vehicles (DMV) and the Department of Environmental Quality (DEQ) to jointly study whether the frequency of vehicle safety inspections and vehicle emissions inspections should be decreased. Specifically, Section 12(b) of Session Law 2017-211 states the following: The Department of Transportation and the Department of Environmental Quality shall jointly study whether the frequency of vehicle safety inspections and vehicle emissions inspections should be decreased. The Departments shall consider public safety, air quality, savings to vehicle owners, impacts on State revenues, and any other factors the Departments deem necessary. No later than March 1, 2018, the Departments shall jointly report their findings and recommendations to the Joint Legislative Transportation Oversight Committee. The following presents the DMV’s study report and recommendations first followed by the DEQ’s study report and recommendations. These reports were submitted together to the Joint Legislative Transportation Oversight Committee on March 1, 2018.
Final February 28, 2018

               NC Division of Motor Vehicles
                          Office of the Commissioner
                                  Torre Jessup

     Study to Examine Whether the
 Frequency of Vehicle Safety Inspections
 in North Carolina Should Be Decreased

       A Report to the Joint Legislative
     Transportation Oversight Committee
                             March 1, 2018
Table of Contents
Executive Summary....................................................................................................................................... 3
I. Introduction .............................................................................................................................................. 5
A. Vehicle Safety Inspection Program Background .................................................................................. 5
B. Other State Programs .......................................................................................................................... 5
II. Study Approach and Results .................................................................................................................... 7
A. Vehicle Safety Inspection Analysis ....................................................................................................... 7
B. Financial Analysis ................................................................................................................................. 7
1. State Inspection Fee ......................................................................................................................... 8
2. Current Program Statistics and Projections ..................................................................................... 8
3. Biennial Program Statistics and Projections..................................................................................... 9
4. Information Technology Impact/Cost ............................................................................................ 10
C. Motor Vehicle Crash Analysis ............................................................................................................ 11
III. Conclusion and Recommendation ........................................................................................................ 13
List of Tables
Table 1: States with Safety Inspection Programs…………………………..………………………………………………………..6
Table 2: Safety Inspection Data 2013 to 2023…………………………..………………………………..……………….………….7
Table 3. Safety Only Inspection Fee ……………………………………..…………………………………………….…………….……8
Table 4. Inspection Program Figures……………………………………………………………………………………………..….…… 9
Table 5. Financial Losses due to a Change from Annual to Biennial Program……………………….……………….10
Table 6. Financial Savings to Citizens………………………………………………………………….……………………….………. 10
List of Charts
Chart 1. Inspection Component Failures………………………………………………………….………..………………………….11
Chart 2. Crash Component Failures…………………………..………………….…………………..………………………………….12
2Study to Examine Whether the
Frequency of Vehicle Safety Inspections
in North Carolina Should Be Decreased
A Report to the
Joint Legislative Transportation Oversight Committee
March 1, 2018
Executive Summary
The 2017 Session of the North Carolina General Assembly directed the Department of Transportation
(DOT), Division of Motor Vehicles (DMV) and the Department of Environmental Quality (DEQ) to jointly
study whether the frequency of vehicle safety inspections and vehicle emissions inspections should be
decreased.
Specifically, Senate Bill 16 Section 12(b) of Session Law 2017-211 states the following:
The Department of Transportation and the Department of Environmental Quality shall jointly study
whether the frequency of vehicle safety inspections and vehicle emissions inspections should be
decreased. The Departments shall consider public safety, air quality, savings to vehicle owners, impacts
on State revenues, and any other factors the Departments deem necessary. No later than March 1,
2018, the Departments shall jointly report their findings and recommendations to the Joint Legislative
Transportation Oversight Committee.
This report details the findings and overall recommendations from DMV based on an analysis of data
pertinent to the impact of decreasing required vehicle safety inspection frequency. (The DEQ has
prepared a separate report to address consideration of decreasing the frequency of vehicle emissions
inspections.) It is important to note that DMV’s study uses data from North Carolina state safety
inspections for the past five calendar years beginning in 2013 in addition to the most recent motor
vehicle crash reports developed by NCDOT.
The technical and cost/benefit analysis detailed in this study report identifies 2019 as the first year for
implementing any change to safety inspection frequency. Additional fiscal analysis is forecasted for the
following five years through 2023. For the 100 counties, an estimated 9.2 million vehicles were
inspected in 2017, and based on safety inspection data, between 9.8 and 13.1 million vehicles are
expected to undergo inspections between study years 2019-2023, highlighting the state’s anticipated
growth in population and vehicles.
Additional considerations include the total annual motor vehicle crashes in North Carolina. These have
fluctuated over the past five years, averaging a 5.2 percent increase. Methods for collecting data from
3motor vehicle crashes have made the process of conclusively defining a relationship between highway
safety and the vehicle safety inspection program a difficult task.
Based on the analysis of data currently available, the Division of Motor Vehicles recommends the
following:
Recommendation: The DMV recommends maintaining the annual frequency of safety inspections and
conducting a more comprehensive study over the next two to five years to determine whether this
frequency has a direct relationship to highway safety and motor vehicle crashes.
4I. Introduction
A. Vehicle Safety Inspection Program Background
Pioneered by Massachusetts in 1926, the vehicle safety inspection program acknowledged the evolution
of motor vehicles and publicized the need to ensure their operational safety. The shared realization of
the impact of vehicle safety on the public welfare initiated a political movement prompting governors of
New York, Massachusetts and Maryland to partner in launching “Save a Life” campaigns. These
campaigns encouraged motor vehicle owners to have their vehicles inspected for repairs and faulty
equipment at designated vehicle repair garages. Initially a voluntary program, additional states
continued to adopt the concept contributing to the enactment of laws mandating periodic vehicle
inspections in 1929. North Carolina later embraced these civic obligations and introduced the North
Carolina vehicle safety inspection program in 1948. The program was repealed the following year. In
1966 the safety inspection program as we know it today was established to require motor vehicle
maintenance and increase highway safety.
Administered by the North Carolina DMV License and Theft Bureau, the NC vehicle safety inspection
program has evolved with the progression of technology and enhancements to vehicle components.
With these technical advancements, the state modernized the program in November 2008 by
transitioning from paper inspection records to a centralized electronic system for inspection record
entry and retention. The adjustment also eliminated the use of windshield stickers and began the
process of aligning vehicle inspection expiration with registration renewal dates by using electronic
inspection authorizations.
The state completed its second modernization project in September 2017 with the implementation of a
web-safety program. The program that had been implemented in 2008 required dial-up landline
connection for input and data transfer of inspection reports. Over time, this process declined in
reliability, affecting performance for technicians and consistency in the transfer of data. The web-safety
program allows technicians to use any computer with compatible internet access to manage vehicle
inspections. The updated system eliminates the requirement for inspection stations to purchase and
maintain an expensive inspection analyzer and enhances system communication between the inspection
station and DMV.
B. Other State Programs
In 1975, thirty-one states participated in an inspection program that required periodic motor vehicle
safety inspections. A 2015 report released by the federal Government Accountability Office (GAO) noted
that sixteen of the original 31 states continue to participate in a vehicle safety inspection program.
Though the original concept of ensuring vehicle safety has continued, each state has modeled its
program based on its own demographics and budgetary concerns. At this time, Delaware, Hawaii,
Louisiana, Maine, Massachusetts, Missouri, New Hampshire, New York, North Carolina, Pennsylvania,
Rhode Island, Texas, Utah, Vermont, Virginia, and West Virginia require standardized vehicle safety
inspections. Eleven states require annual safety inspections of vehicles. Three states require biennial
inspections. Two states require safety inspections based on state laws.
5All participating states except Delaware require state-licensed private safety inspections with fees
ranging from no fee to $55.00 (including emissions testing). Though the states receive a portion of these
fees, the amounts are minimal compared to station income.
Table 1: States with Safety Inspection Programs
Requirements for the safety inspections are defined individually by state. Each state has developed a
standardized process by which safety inspections are to be conducted and key safety components are to
be inspected. Oversight of the program is also contingent on laws specific to the state. North Carolina
inspects proper functionality and conditions of brakes, lights, horn, steering mechanism, windows and
windshield wipers (if applicable), directional signals, tires and mirrors. Many states determine the
components to be inspected by a variation of vehicle examination.
6II. Study Approach and Results
A. Vehicle Safety Inspection Analysis
Reviewing the inspection data for calendar years 2013 through 2017 reveals an annual average of 8.9
million inspections conducted each year. However, during calendar years 2016 and 2017, over 9.2
million inspections were performed. Therefore, the fiscal analyses that follow are based on 9.2 million
inspections.
A study of the data demonstrates a 6.6% increase in vehicle inspections over the years included. This
was derived by examining the trend of inspection growth from 2013 to 2017. The following table
provides a more detailed view of inspection data and a projection of how inspection counts would be
affected by a 6% annual growth rate.
Table 2. Safety Inspection Data 2013 to 2023
Safety Only Safety/Emissions
CY Year Total Inspection Count
Inspections Inspections*
2013 3,027,533 5,631,101 8,658,634
2014 2,973,577 5,897,993 8,871,570
2015 3,547,954 5,376,874 8,924,828
2016 3,825,218 5,452,738 9,277,956
2017 3,753,340 5,484,251 9,237,591
2018 3,978,540 5,813,306 9,791,846
2019 4,217,253 6,162,104 10,379,357
2020 4,470,288 6,531,831 11,002,119
2021 4,738,505 6,923,741 11,662,246
2022 5,022,816 7,339,165 12,361,981
2023 5,324,185 7,779,515 13,103,699
*Note: The projection of emissions inspections would differ if the State Implementation Plan is
approved by the EPA and the state adopts a rolling 20-year rule for emissions inspections as
recommended in the study required by Session Law 2013-413 Section 26 1.
B. Financial Analysis
Although this Division is not recommending a reduction in inspection frequency, this section will
examine the fiscal impact of reducing safety inspections to biennial. The information in the above
section revealed that a multiple year average of 8.9 million inspections are conducted each year. Over
the last two calendar years however, there have been over 9.2 million inspections performed annually.
The following statistics are based on 9.2 million inspections with a 6% growth rate in inspections each
1
https://www.ncleg.net/Sessions/2013/Bills/House/PDF/H74v5.pdf
7year to determine losses or gains.
1. State Inspection Fee
The cost of a safety inspection in North Carolina is $13.60 ($12.75 labor and $0.85 state fee). The cost of
a safety/emissions inspection is $30.00 ($23.75 labor and $6.25 state fee). The authorization cost (state
fee) is divided across separate funds to include Highway Fund, Volunteer Rescue/EMS Fund, the Rescue
Squad Workers’ Relief Fund and the Division of Environmental Quality (safety/emissions inspection).
The Highway Fund receives $0.55 from each passing safety inspection and $5.30 from each passing
safety/emissions test. The Volunteer Rescue/EMS Fund receives $0.18 from each passing inspection, no
matter the type. Likewise, the Rescue Squad Workers’ Relief Fund receives $0.12 from each passing
inspection. Inspection Station owners collect $12.75 labor for each safety inspection and $23.75 from a
safety/emissions inspection.
Table 3. Safety Only Inspection Fee
Safety Only Safety/Emissions
DOT Highway Fund $0.55 $5.30
Volunteer Rescue/EMS Fund $0.18 $0.18
Rescue Squad Workers' Relief Fund $0.12 $0.12
Department of Environmental Quality $0.00 $0.65
Authorization (State Fee) $0.85 $6.25
Inspection Station Labor $12.75 $23.75
*Total Cost $13.60 $30.00
2. Current Program Statistics and Projections
This subsection of the report will review current and projected financial revenues and monies derived
from the state inspections. Each vehicle presented for inspection, including vehicles required to obtain
an emissions inspection, receive a safety inspection.
Table 4. Inspection Program Monies – Current Program
DOT Volunteer Rescue Squad
Year Type Highway Rescue/EMS Workers' Division of Inspection Station
Fund Fund Relief Fund Air Quality
Safety $1,665,143 $544,956 $363,304 $0 $38,601,046
2013 Emissions $29,844,835 $1,013,598 $675,732 $3,660,216 $133,738,649
Totals $31,509,978 $1,558,554 $1,039,036 $3,660,216 $172,339,695
Safety $1,635,467 $535,244 $356,829 $0 $37,913,107
2014 Emissions $31,259,363 $1,061,639 $707,759 $3,833,695 $140,077,334
Totals $32,894,830 $1,596,883 $1,064,588 $3,833,695 $177,990,441
8DOT Volunteer Rescue Squad
Year Type Highway Rescue/EMS Workers' Division of Inspection Station
Fund Fund Relief Fund Air Quality
Safety $1,951,375 $638,632 $425,754 $0 $45,236,414
2015 Emissions $28,497,432 $967,837 $645,225 $3,494,968 $127,700,758
Totals $30,448,807 $1,606,469 $1,070,979 $3,494,968 $172,937,171
Safety $2,103,870 $688,539 $459,026 $0 $48,771,530
2016 Emissions $28,899,511 $981,493 $654,329 $3,544,280 $129,502,528
Totals $31,003,381 $1,670,032 $1,113,355 $3,544,280 $178,274,057
Safety $2,064,337 $675,601 $450,401 $0 $47,855,085
2017 Emissions $29,066,530 $987,165 $658,110 $3,564,763 $130,250,961
Totals $31,130,867 $1,662,766 $1,108,511 $3,564,763 $178,106,046
.
Safety $2,188,197 $716,137 $477,425 $0 $50,726,385
2018 Emissions $30,810,522 $1,046,395 $697,597 $3,778,649 $138,066,018
Totals $32,998,719 $1,762,532 $1,175,022 $3,778,649 $188,792,403
Safety $2,319,489 $759,106 $506,070 $0 $53,769,976
2019 Emissions $32,659,151 $1,109,179 $739,452 $4,005,368 $146,349,970
Totals $34,978,640 $1,868,284 $1,245,523 $4,005,368 $200,119,946
Safety $2,458,658 $804,652 $536,435 $0 $56,996,172
2020 Emissions $34,618,704 $1,175,730 $783,820 $4,245,690 $155,130,986
Totals $37,077,363 $1,980,381 $1,320,254 $4,245,690 $212,127,158
Safety $2,606,178 $852,931 $568,621 $0 $60,415,939
2021 Emissions $36,695,827 $1,246,273 $830,849 $4,500,432 $164,438,849
Totals $39,302,005 $2,099,204 $1,399,470 $4,500,432 $224,854,788
Table 4. Inspection Program Monies – Current program above shows how the financial revenues
continue to grow annually as the number of registered vehicles in North Carolina increases. This 6% rate
of growth is an estimate discussed in the section above. This growth rate in the program is not
guaranteed to continue, but has shown stability over the past five years.
3. Potential Biennial Program Statistics and Projections
The table below assesses the impact of a biennial inspection program using 2019 as the first calendar
year of the modification. The Highway Fund, which receives $5.85 ($0.55 safety + $5.30 emissions) from
each passing inspection, would see a reduction of $17.4 million the first year. The Volunteer
Rescue/EMS Fund, which receives $0.18 during each passing inspection, would see a reduction of
9$934,142 the first year. The Rescue Squad Workers’ Relief Fund, which receives $0.12 from each
passing inspection, would see decreased funding of $622,761 the first year. Inspection station owners
collect $12.75 from each passing safety inspection and $23.75 from each safety/emissions inspection
conducted. Inspection station owners would experience a reduction of $100 million in revenue the first
year of a biennial inspection.
Table 5. Financial Losses due to a Change from Annual to Biennial Program
2019 2020 2021 2022 2023
Fund Losses
DOT Highway Fund Loss $17,489,320 $18,538,681 $19,651,003 $20,830,062 $22,079,866
Volunteer Rescue/EMS Fund
$934,142 $990,191 $1,049,602 $1,112,578 $1,179,333
Loss
Rescue Squad Workers' Relief
$622,761 $660,127 $699,735 $741,719 $786,222
Fund Loss
*Department of
-- -- -- -- --
Environmental Quality
Inspection Station Losses $100,059,973 $106,063,579 $112,427,394 $119,173,036 $126,323,420
*The Department of Environmental Quality losses in funding are addressed in the emissions study.
The modification of the inspection program to begin biennial inspections would negatively impact
several funds and station owners. However, the citizen currently required to subject their vehicle to an
inspection annually would benefit. The $13.60 for a safety-only inspection and $30.00 each emissions
inspection would equate to $121.1 million collectively in savings starting the first year. Table 4 below
provides the projected savings for citizens.
Table 6. Financial Savings to Citizens
2019 2020 2021 2022 2023
Benefits/Gains
Vehicle Owners Savings - Safety Only $28,677,320 $30,397,958 $32,221,834 $34,155,149 $36,204,458
vehicle Owners Savings -
Safety/Emissions $92,431,560 $97,977,465 $103,856,115 $110,087,475 $116,692,725
Total Gains $121,108,880 $128,375,423 $136,077,949 $144,242,624 $152,897,183
4. Information Technology Impact/Cost
During this analysis, applicable unit members (DOT IT & License & Theft) discussed potential changes to
the state’s electronic programs and databases. It was determined by all parties that the modification of
the state’s inspection program to a biennial system would be minimal. The cost associated with any
changes would be consumed by the varying divisions/sections. Therefore, there is no impact on
information technology costs.
This section has shown that the state’s inspection program provides funding to many different
programs. The losses to these funds are great if the program is changed to a biennial inspection
program. However, the citizens would benefit financially by a change to biennial inspections.
10C. Motor Vehicle Crash Analysis
The study conducted by DMV used motor vehicle crash data from the 2016 North Carolina Traffic Crash
Facts Study to analyze relationships between safety inspections, safety inspection outcomes, crash
rates, crash severity and vehicle component failures. This data set did not include vehicles 35 model
years old or older since they are exempt, as defined by N.C. General Statute 20-79.4(b)(91) and 20-
183.2(a1)(1).
The data shown in Chart 1 below depicts the key safety components that have been recorded as
potential contributing factors in crashes due to component failures. Safety components including lights,
tires, steering mechanisms and brakes are imperative to operate a vehicle in normal weather and traffic
conditions. The need for these mechanisms to properly function significantly increases during abnormal
conditions. Figures provided in this graph are a clear indication that the vehicle safety program is
effective in preventing vehicles with defective equipment from operating on the public roads and
highways.
Chart 1. Inspection Component Failures
Chart 2 illustrates the number of crashes in which the failure of a safety component played a role in a
vehicle crash. The importance of this data is to highlight the occurrence of crashes due to component
failure even with the mandated vehicle safety inspection program. Considering the statistics of detected
defective components displayed in Chart 1, it can be assumed that the data provided in Chart 2 would
significantly increase with the elimination of the vehicle safety program.
11Chart 2. Crash Component Failures
Periodic inspections verify the integrity of the vehicle’s critical safety components necessary to keep the
vehicle is in safe operating condition. By detecting defective vehicle parts before they fail, effective
periodic inspection programs can prevent component failure on the highways and prevent vehicle
crashes that may result in injury or fatalities.
As required by N.C. General Statute 20-183.2, a North Carolina vehicle safety inspection must confirm
vehicle equipment is installed and operating in a safe condition. If components are missing, defective,
inoperable or unsafe, the vehicle will fail the inspection until the equipment is repaired or replaced.
Without the safety inspection program, there would be no incentive for vehicle owners to make repairs
or replace unsafe equipment.
In 2017, there were 194,228 vehicles that failed the safety portion of the inspection due to the
inadequacy of one or more safety item.
Items that failed safety inspections in 2017:
• Tires – 74,028
• Steering Mechanism – 28,095
• Lights – 45,570
• Braking Components – 16,392
The total number of failed items does not equate to the total number of failed inspections. During an
inspection, multiple items may fail the safety portion of the test. In 2017, 8,738,476 total initial
safety/emissions and safety-only inspections were conducted by 6,194 inspection stations across North
Carolina. This number captures only the initial vehicle safety inspection failure. It does not include any
subsequent inspections required after repairs have been made.
12In 2016, 484,982 traffic crashes were reported according to data from the DOT Traffic Engineering
Accident Analysis System (TEAAS).
Vehicle defects found to contribute to the traffic crash:
• Tires – 2,997 (.6%)
• Steering Mechanism – 321 (.07%)
• Lights – 323 (.07%)
• Braking Components – 1,226 (.3%)
Of the reported crashes in 2016, 8 percent of the crash reports indicated a failure in a safety component
that contributed to the crash. The low percentage of the reported component failures contributing to
the crashes could be viewed as a direct result of a comprehensive state safety inspection program.
North Carolina’s inspections program is a preventative way to encourage vehicle owners to schedule
regular maintenance and service for their automobiles. This preventative measure decreases the risk of
vehicle mechanical problems which could result in a collision and makes the roadways safer for the
motoring public and pedestrians.
III. Conclusion and Recommendation
Based on the analysis of available crash and inspection data from 2012 – 2017, a conclusive correlation
between the vehicle safety inspection program and the occurrence of vehicle crashes cannot be
confirmed. However, facts revealed in the study highlighted two significant verities that should be
considered prior to modifying the current program.
Statistics prove that the vehicle safety inspections program was effective in preventing 194,228 vehicles
with defective equipment from operating on public highways. While a significant amount, this number
does not fully reflect the number of people that could be impacted if any failed components were to
contribute to a crash. One crash involving one vehicle can greatly affect other drivers sharing the roads
and additional passengers in the vehicles involved. Considering both statistical figures and the
prospective growth of North Carolina, the number of drivers is expected to increase. Continuation of the
annual vehicle safety program accommodates anticipated growth and supplements continuing efforts to
protect the citizens and travelers on North Carolina highways.
The second consideration emphasizes the evaluation of the financial impact gleaned from the
comparison of data. Financial forecasting based on monetary trends projects the DOT Highway Fund,
Volunteer Rescue/EMS Fund and Rescue Squad Workers’ Relief Fund will collectively lose approximately
$126,323,420.00 by 2023 with the decrease in frequency of the safety inspection program. These
programs work cooperatively to provide trained professionals and necessary provisions to help save
lives and ensure safe highways. Since these monies go to programs that jointly share public safety as a
priority, the sustained loss in funding would greatly impact their work as well as budgeting for future
projects and/or enhancements. However, individual citizens would benefit by saving only the cost of
$13.60 for the inspection and the cost of repairs to ensure the safety of their vehicle. This amount is
13minimal when compared to the value of services provided by these programs. This comparative
summary reveals that the cost/benefit analysis economically and practically favors maintaining the
annual schedule of the vehicle safety inspection program.
Based on the findings, it is the Division’s recommendation to maintain the frequency of annual safety
inspections and to conduct a more comprehensive study over the next two to five years to determine if
the frequency of the state safety inspection program has a direct relationship to highway safety and
motor vehicle crashes. During this time, the Division plans to seek assistance from DOT Traffic Safety
Engineers to explore additional data sets that could provide further insight into the correlation of vehicle
safety inspections and crash data. The Division hopes to establish a more comprehensive baseline to
develop a conclusive determination. Until these tasks have been thoroughly analyzed, a change in the
safety inspection frequency would potentially increase risks for the traveling public and negatively
impact supported programs and affiliated businesses.
14North Carolina Inspection and
Maintenance Program
Study to Examine Whether the Frequency of
Vehicle Emissions Inspections Should Be
Decreased in North Carolina
A Report to the
Joint Legislative Transportation Oversight
Committee
Submitted by the North Carolina Department
of Environmental Quality
Final Report
March 1, 2018North Carolina Inspection and Maintenance Program
Study to Examine Whether the Frequency of Vehicle Emissions
Inspections Should Be Decreased in North Carolina
A Report to the
Joint Legislative Transportation Oversight Committee
Submitted by the North Carolina Department
of Environmental Quality
This report is submitted pursuant to the requirement of Section 12(b) of
Session Law 2017-211, Senate Bill 16 enacted on October 10, 2017.
Signed: ____________________________________________
Michael S. Regan
Department of Environmental Quality
Signed: ____________________________________________
James Trogdon
Department of Transportation
Final Report
March 1, 2018Table of Contents
Executive Summary ........................................................................................................................ 1
I. Introduction ................................................................................................................................ 3
A. Vehicle I&M Program Background ...................................................................................... 3
B. Other State Emissions Inspection Frequency Requirements ................................................ 4
C. Air Quality Standards and Implementation Requirements ................................................... 5
1. Current National Ambient Air Quality Standards (NAAQS) ........................................ 5
1. Recently Revised Ozone NAAQS and Final Designations ............................................ 5
II. Study Approach to Examine Annual Emissions Inspection Schedule to Biennial Schedule... 8
A. Ambient Air Quality Data ..................................................................................................... 8
B. Vehicle Emissions Analysis ................................................................................................ 12
C. Fiscal Analysis .................................................................................................................... 13
III. Study Results ........................................................................................................................ 13
A. Vehicle Emissions Analysis ................................................................................................ 13
B. Fiscal Analysis .................................................................................................................... 20
IV. Summary and Conclusions .................................................................................................... 21
A. Emissions Increases are Low and Program Benefits are Declining ................................... 21
B. Air Quality has Improved – No Violating Monitors ........................................................... 21
C. Fiscal Impacts...................................................................................................................... 22
V. Final Recommendations .......................................................................................................... 22
List of Tables
Table 1. Estimated Schedule for EPA Approval and DMV Implementation of I&M Program
Changes per Session Law 2017-10 ................................................................................ 5
Table 2. Current National Ambient Air Quality Standards ........................................................... 6
Table 3. Counties Subject to I&M Program .................................................................................. 9
Table 4. Onroad NOx and VOC Emissions by Year Associated with Switching from Annual to
Biennial Emissions Inspections for 22 Counties.......................................................... 14
Table 5. 2018 Emissions Increases from Switching to Biennial Inspection Frequency .............. 16
Table 6. 2020 Emissions Increases from Switching to Biennial Inspection Frequency .............. 17
Table 7. 2022 Emissions Increases from Switching to Biennial Inspection Frequency .............. 18
Table 8. 2026 Emissions Increases from Switching to Biennial Inspection Frequency .............. 19
Table 9. Revenue and Expenditure Difference from Changing Annual to Biennial Emissions
Frequency ..................................................................................................................... 20
Table 10. Net Present Value of the Impacts ................................................................................ 20List of Figures
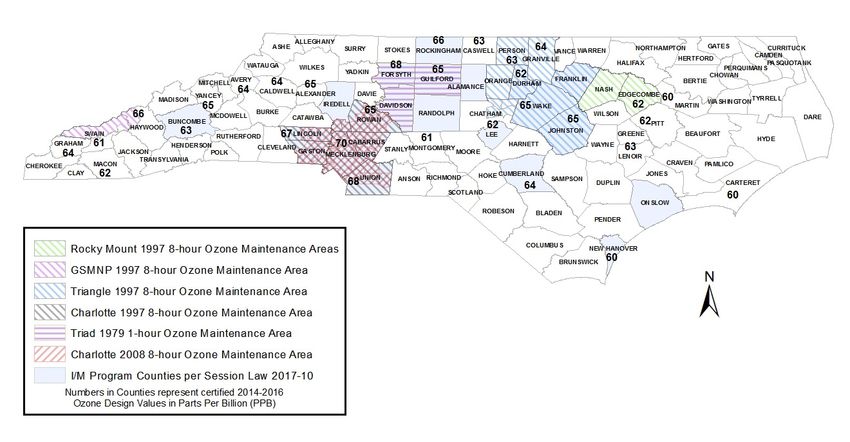
Figure 1. Ozone Design Values (2014-2016), I&M Counties and Ozone Designation Status .... 11
Figure 2. Comparison of Onroad Daily NOx and VOC Emissions by Year for an Annual versus
Biennial Emissions Inspection Program for Combined 22 Counties ........................... 14
Figure 3. Comparison of Onroad Daily NOx and VOC Emissions Increases by Year for Ozone
Maintenance Areas and “Other” Counties Not in a Maintenance Area ....................... 15Study to Examine Whether the Frequency of Vehicle Emissions
Inspections Should Be Decreased in North Carolina
A Report to the
Joint Legislative Transportation Oversight Committee
March 1, 2018
Executive Summary
The 2017 session of the North Carolina General Assembly directed the Department of
Environmental Quality (DEQ) and the Department of Transportation (DOT), Division of Motor
Vehicles (DMV) to jointly study whether the frequency of vehicle safety inspections and vehicle
emissions inspections should be decreased.
Specifically, Section 12(b) of Session Law 2017-211 states the following:
The Department of Transportation and the Department of Environmental Quality shall jointly study
whether the frequency of vehicle safety inspections and vehicle emissions inspections should be
decreased. The Departments shall consider public safety, air quality, savings to vehicle owners,
impacts on State revenues, and any other factors the Departments deem necessary. No later than
March 1, 2018, the Departments shall jointly report their findings and recommendations to the Joint
Legislative Transportation Oversight Committee.
This report describes the DEQ’s and DMV’s recommendations for changing the frequency of
vehicle emissions inspections from annual to biennial. The DOT has prepared a separate report
to address whether the frequency of vehicle safety inspections should be decreased. It is
important to note that DEQ’s study approach focuses on the 22 counties that Session Law 2017-
10 retained in the emissions inspection and maintenance (I&M) program and that decreased the
vehicle model year coverage in those counties from 1996 and newer vehicles to the most recent
20 model years. 1 The 22 counties retained in the program are: Alamance, Buncombe, Cabarrus,
0F
Cumberland, Davidson, Durham, Forsyth, Franklin, Gaston, Guilford, Iredell, Johnston, Lee,
Lincoln, Mecklenburg, New Hanover, Onslow, Randolph, Rockingham, Rowan, Union, and
Wake.
For this study report, the technical and cost/benefit analyses focused on 2018 as the base year.
For future years, the impacts are evaluated through 2022 for the fiscal analysis and through 2026
for the onroad vehicle emissions analysis. For the combined 22 counties, an estimated 3.3
million vehicles were inspected in 2016, and between 3.34 and 3.43 million vehicles are
expected to be inspected annually during the study period of 2018-2022. It is estimated that
changing the program from annual to biennial, 50 percent fewer vehicles would be inspected
each year.
1
Like the current program, the revisions to the vehicle model year coverage per Session Law 2017-10 also excludes
the three most recent model years if the vehicle has 70,000 miles or less on its odometer.
1The DEQ and DMV jointly recommend the following:
Recommendation 1: Change the frequency of emissions inspections from annual to biennial.
For the combined 22 counties, in 2018, changing the inspection frequency of the I&M
program from annual to biennial would increase onroad nitrogen oxide (NOx) and volatile
organic compound (VOC) emissions by about 0.4 tons per day (0.3 percent) and 0.7 tons per
day (0.7 percent), respectively. However, the decrease in onroad emissions associated with a
cleaner vehicle fleet in the future would more than offset the slight increase in emissions.
With ozone values generally expected to decline over time due to fleet turnover, federal Tier
3 standards, and emission reduction programs at the local level, it is unlikely that the small
emissions increases associated with this recommendation will cause an exceedance of the 70
parts per billion (ppb) ozone standard or any of the other National Ambient Air Quality
Standards (NAAQS) in any of the 22 counties.
Recommendation 2: Implement biennial emissions inspections starting in 2021.
The EPA must approve North Carolina’s I&M SIP amendment and revised rule before the
state may implement a change to the I&M program. This process may take up to 3 years to
complete (i.e., about 12 months to complete the rulemaking process, SIP amendment, and
Clean Air Act (CAA) Section 110(l) noninterference demonstration for submittal to EPA; up
to 18 months for EPA to approve the revision; and 2 to 3 months for the DMV to roll out the
program change after the Secretary of the DEQ certifies to the Revisor of Statutes that EPA
has approved the amendment to the I&M SIP). Based on this schedule, 2021 would be the
earliest year in which the I&M program could be changed to implement biennial emissions
inspections if the state legislature adopted the I&M program change in 2018.
Section I of this report provides a brief background on the I&M program and its applicability to
the 22 counties subject to the program, an overview of the current NAAQS, and State
Implementation Plan (SIP) requirements for demonstrating compliance with the NAAQS.
Sections II and III present the study approach and results, respectively. Section IV provides the
summary and conclusions of the study results. Section V presents the DEQ’s and DMV’s
recommendations. Appendix A to this report summarizes key aspects of the onroad modeling
framework, Appendix B contains the fiscal analysis, and Appendix C provides a list of acronyms
and abbreviations used in this report.
2I. Introduction
A. Vehicle I&M Program Background
The Environmental Management Commission (EMC) has been given the authority to adopt “a
program for testing emissions from motor vehicles and to adopt motor vehicle emission
standards” by the North Carolina General Assembly under North Carolina General Statute
(NCGS) §143-215.107 (a)(6), “Air quality standards and classifications.” The EMC has
adopted rules for an I&M program under 15A North Carolina Administrative Code (NCAC)
Subchapter 2D, Section .1000 “Motor Vehicle Emissions Control Standards,” that are federally
enforceable by the U.S. Environmental Protection Agency (EPA) under the Code of Federal
Regulations (CFR) 40 CFR Part 51. The I&M program is implemented by the state DOT,
Commissioner of the DMV through the use of licensed safety/emission inspection stations,
NCGS Article 3 – Motor Vehicle Act of 1937 §20-128.2 (a),“Motor vehicle emission standards.”
The DMV’s License and Theft Bureau, has operational responsibility for the I&M program, and
has created rules for implementing and monitoring the program under 19A NCAC 03D .0500.
The Division of Air Quality (DAQ) in the DEQ provides technical support to DMV’s
implementation of North Carolina’s I&M program. In addition, the DEQ develops specifications
for the program and certifies the emissions testing equipment used in the program. The DEQ
also prepares revisions to the SIP based on changes made by the North Carolina General
Assembly and the EMC. In the past, implementation of this program has been an integral part of
North Carolina’s SIP(s) to support attainment and maintenance of the NAAQS for ozone and
carbon monoxide (CO).
The North Carolina I&M program began in 1982 in Mecklenburg County. From 1986 through
1991, the program was expanded to include eight additional counties, based on a “tailpipe”
emissions test. In 1999, the North Carolina General Assembly passed legislation to require an
On-Board Diagnostic II (OBD) I&M program in not only the counties required to have an I&M
program under 40 CFR 51.350(a), but also in other counties in the state that may need the
additional emission reductions to achieve the 1997 8-hour ozone standard. Starting in October
2002, the original nine counties converted from tailpipe testing to the new OBD emissions
testing for all model year 1996 and newer light-duty gasoline vehicles and continued tailpipe
testing of model year 1995 and older vehicles. The program was expanded from nine counties
starting July 1, 2003 to a total of 48 counties on January 1, 2006. 2 At the time of full
1F
implementation of the OBD program, inspection stations were performing the OBD emissions
test on model year 1996 and newer vehicles, and tailpipe testing for model year 1995 and older
vehicles was discontinued.
In 2002, North Carolina inspection stations performed over 2.5 million vehicle emission
inspections. As the new I&M counties were added, the number of inspections was expected to
rise to a high of about 3.5 million inspections but then dip to a lower figure when all tailpipe
testing ended on December 31, 2005. The actual number of OBD inspections has varied from
2
Session Law 2000-134 (HB 1638) from the 1999 G.S. Session.
33.6 to about 5.4 million since 2006, due to a program change to align registration and inspection
dates in 2008 and higher than expected fleet turnover and population growth.
On November 1, 2008, the state ended the use of paper stickers and began the process of aligning
vehicle inspection expiration and registration renewal dates by using electronic inspection
authorizations. Session Law 2011-95 enacted by the North Carolina General Assembly
exempted plug-in electric vehicles from the emissions inspection requirement.
In 2012, the North Carolina General Assembly enacted Session Law 2012-199 which required
DEQ and DMV to change the I&M program to exempt the three newest model year vehicles
with less than 70,000 miles, and secure EPA approval. The DEQ prepared and submitted to EPA
an amendment to the North Carolina I&M SIP and a non-interference demonstration under
Section 110(l) of the federal CAA to incorporate these changes to the I&M program. The EPA
approved the amendment on February 5, 2015. 3 Statewide, 4.840 million emissions inspections
2F
were performed in 2016 which is about 0.07 percent lower than total emissions inspections
(4.843 million) performed in 2015.
In 2017, the North Carolina General Assembly enacted Session Law 2017-10, Senate Bill 131
(An Act to Provide Further Regulatory Relief to the Citizens of North Carolina). Section 3.5.(a)
of the Act amended North Carolina General Statute (NCGS) §143-215.107A(c) to remove 26 of
48 counties from North Carolina’s I&M program. For the 22 counties remaining in the I&M
program, the Act also amended NCGS §20-183.2(b) by changing the vehicle model year
coverage to: (i) a vehicle with a model year within 20 years of the current year and older than
the three most recent model years, or (ii) a vehicle with a model year within 20 years of the
current year and has 70,000 miles or more on its odometer.
Section 3.5.(c) of Session Law 2017-10 requires DEQ to prepare and submit to EPA for approval
by the agency a proposed North Carolina SIP amendment and CAA Section 110(l)
noninterference demonstration to remove the 26 counties from the I&M program and change the
vehicle model year coverage of the program for the remaining 22 counties. The EPA has up to
18 months from the final submittal date to act on the proposed amendments. Shortly after
receiving EPA’s approval of each SIP amendment, the Secretary of DEQ will certify to the
Revisor of Statutes that EPA has approved an amendment to the North Carolina SIP. The DMV
would then implement the program change within 60 days after certification. Table 1 provides
the estimated schedule for EPA approval and DMV implementation of the I&M program
changes required by Session Law 2017-10. The estimated schedule shown in Table 1 assumes
that EPA will take 18 months to complete its final action on the program changes.
B. Other State Emissions Inspection Frequency Requirements
The inspection frequency in states that have an I&M program are generally either annual or
biennial inspections. No state has an inspection frequency less frequent than biennial. Some
states do revert to an annual inspection for vehicles that are six years and older. Some states also
require taxis, commercial, state and local government owned vehicles to have annual inspections
because these vehicles typically travel more miles per year than privately owned vehicles.
3
80 FR 6455-6458 (Vol. 80, No. 24), February 5, 2015.
4Table 1. Estimated Schedule for EPA Approval and DMV Implementation of I&M
Program Changes per Session Law 2017-10
Change Vehicle Model Year
Removal of 26 Counties Coverage for 22 Counties
Action from I&M Program Retained in I&M Program
July 2018
Nov. 24, 2017 (I&M SIP amendment, CAA
(I&M SIP amendment Section 110(l) noninterference
DEQ submittals to EPA and CAA Section 110(l) demonstration, revised rule 15A
noninterference NCAC 02D .1002, and revised
demonstration) maintenance plan for the Charlotte
maintenance area)
EPA final approval (up to 18 months from
May 2019 Jan. 2020
DEQ submittal date)
DEQ certification to Revisor of Statutes June 2019 March 2020
DMV implements program change (60 days
Sept. 2019 June 2020
after DEQ certification)
C. Air Quality Standards and Implementation Requirements
1. Current National Ambient Air Quality Standards (NAAQS)
The federal CAA as amended requires EPA to establish NAAQS for the following criteria air
pollutants: CO, lead, ozone, nitrogen dioxide (NO2), particulate matter (PM2.5 and PM10), and
sulfur dioxide (SO2). The current air quality standards are displayed in Table 2. North Carolina
adopts the NAAQS into its air quality rules under Section 15A NCAC 02D .0400 as authorized
in Article 21B of Chapter 143-215.107 of the General Statutes.
1. Recently Revised Ozone NAAQS and Final Designations
The CAA requires EPA to review, and revise if necessary, the NAAQS every five years. On
October 1, 2015, EPA completed its review of the 2008 ozone standard and promulgated its final
decision to lower both the primary and secondary ground-level ozone standards from 75 to 70
ppb. 4 The form (fourth-highest daily maximum, averaged across three consecutive years) and
3F
averaging time (eight hours) of the new 2015 standard is the same as the 2008 standard. The
revised primary and secondary standards became effective on December 28, 2015. In addition,
EPA also changed the season during which North Carolina must monitor for ozone from April
through October to March through October.
Section 107(d) of the CAA addresses the designations process between EPA and the states.
Under Section 107(d), the Governor of a state is required to submit recommendations to EPA for
designating areas as attainment, nonattainment, or unclassifiable with the revised ozone NAAQS
by October 1, 2016 (i.e., within one year after promulgation of the revised NAAQS). On
September 30, 2016, North Carolina fulfilled this requirement and recommended that EPA
designate the entire state as attainment for the standard based on certified air quality monitoring
4
80 FR 65292-65468 (Vol. 80, No. 206), October 26, 2015.
5data for 2014-2016. 5 On November 6, 2017, EPA agreed with North Carolina’s
4F
recommendation and designated the entire state of North Carolina “attainment/unclassifiable”
for the 2015 8-hour ozone NAAQS. 6 North Carolina has continued to maintain compliance with
5F
the 2015 8-hour ozone standard through October 31, 2017.
Table 2. Current National Ambient Air Quality Standards
Year Primary /
Adopted Secondary Averaging
Pollutant by EPA NAAQS Time Level* Form
Annual fourth-highest daily
Primary and
Ozone 2015 8-hour 70 ppb maximum 8-hr concentration,
secondary
averaged over 3 years
1-hour 35 ppm Not to be exceeded more than
CO 2011 Primary
8-hour 9 ppm once per year
Primary and Rolling 3
Lead 2008 0.15 µg/m3 Not to be exceeded
secondary month average
98th percentile of 1-hour daily
Primary 1-hour 100 ppb maximum concentrations,
NO2 2010 averaged over 3 years
Primary and
Annual 53 ppb Annual Mean
secondary
3
Primary 12 µg/m Annual mean, averaged over 3
Annual
Secondary 15 µg/m3 years
PM2.5 2012
Primary and 98th percentile, averaged over 3
24-hour 35 µg/m3
secondary years
Not to be exceeded more than
Primary and
PM10 2012 24-hour 150 µg/m3 once per year on average over 3
secondary
years
99th percentile of 1-hour daily
Primary 1-hour 75 ppb maximum concentrations,
SO2 2010 averaged over 3 years
Not to be exceeded more than
Secondary 3-hour 0.5 ppm
once per year
* ppm = parts per million, ppb = parts per billion, µg/m3 = micrograms per cubic meter.
D. Implementation of the NAAQS
Section 110(a)(1) of the CAA requires that each state adopt and submit to EPA for approval a
plan which provides for implementation, maintenance and enforcement of primary standards for
all areas within the state. For areas previously designated as nonattainment for a NAAQS, the
DEQ prepared and submitted a SIP to EPA that demonstrated how each area would attain the
NAAQS by adopting and implementing a combination of permanent and enforceable federal,
5
Letter from Donald R. van der Vaart, Secretary, DEQ to Heather McTeer Toney, Regional Administrator, USEPA
Region 4, North Carolina's Recommendations for Air Quality Designations for the 2015 8-hour
Ozone Standards, September 30, 2016,
https://files.nc.gov/ncdeq/Air%20Quality/planning/ozone/2015_Ozone_DEQ_Designation_Recommendation.pdf.
6
Air Quality Designations for the 2015 Ozone National Ambient Air Quality Standards (NAAQS), Final Rule, 82 FR
54232, November 16, 2017. This final rule is effective on January 16, 2018.
6state, and local control measures. 7 Once each area reached attainment for the NAAQS, the DEQ
6F
submitted to EPA a SIP demonstrating that attainment had been reached (based on air quality
monitoring data), and requested that EPA redesignate the area as attainment pursuant to Section
107(d)(3)(D) and (E) of the CAA.
As a part of the redesignation request, the DEQ also prepared and submitted a maintenance plan
pursuant to Section 175A of the CAA to demonstrate how each area will maintain compliance
with each of the NAAQS for at least 10 years after the redesignation. The maintenance plan
remains in effect for 20 years after EPA approves the plan. When a state seeks revisions to a
maintenance plan, CAA Section 110(l) requires a non-interference demonstration to remove
control strategies or make other changes. Section 110(l) states:
“Each revision to an implementation plan submitted by a State under this chapter shall be
adopted by such State after reasonable notice and public hearing. The Administrator shall
not approve a revision of a plan if the revision would interfere with any applicable
requirement concerning attainment and reasonable further progress (as defined in section 171
of this title), or any other applicable requirement of this Act.”
If the vehicle I&M program was changed to remove a county or required substantial operational
changes, North Carolina would be required to submit to EPA for approval a demonstration that
any emissions change associated with removing the I&M program would not hinder any area
from attaining and/or maintaining compliance with all of the NAAQS. For counties that are in
attainment for all of the NAAQS and/or under a maintenance plan, the non-interference
demonstration would rely on ambient air quality monitoring data and emissions data to show that
removing the I&M program will not interfere with continued attainment and maintenance of the
NAAQS.
Failure to have a revised SIP approved by EPA before eliminating or modifying an I&M
program could result in the state being sued for non-compliance with the CAA. For example, in
2002, Kentucky adopted legislation to immediately end the I&M program for the Louisville,
Kentucky area. This prompted a lawsuit by the Kentucky Resource Council since the
appropriate SIP revisions demonstrating compliance with Section 110(l) of the CAA had not
been submitted to EPA. The lawsuit resulted in a court order reinstating the I&M program until
the Section 110(l) demonstration had been submitted to and approved by EPA.
The pollutants that need to be reviewed are NO2, CO, NOx, and VOC. NOx refers to nitric oxide
(NO) and NO2. Since NOx includes the criteria pollutant NO2, NO2 does not need to be
reviewed separately. The EPA does not require that the demonstration associated with removing
the I&M program address SO2, lead, or PM2.5 because vehicle emissions have little or no impact
on ambient concentrations of those pollutants.
7
Fourteen of the 22 counties that Session Law 2017-10 retained in the I&M program have previously been included
in a nonattainment area for either the old 1979 1-hour, 1997 8-hour, and/or 2008 8-hour ozone NAAQS (see Table 3
in Section II.A of this report). All 14 counties have been redesignated to attainment and are under a maintenance
plan.
7It is also important to note that North Carolina is considered NOx limited with respect to ozone
formation. This means that there are significantly more biogenically induced VOC emissions in
the atmosphere and that reductions in man-made VOC emissions will not result in reductions of
ozone formation. Approximately 90 percent of the VOC emissions come from biogenic or
natural sources in North Carolina, which cannot be controlled; therefore, control measures
requiring small VOC emitting sources to reduce man-made VOC emissions will not result in a
reduction in ozone formation. The best method to achieve reductions in ozone in North Carolina
is to reduce NOx emissions.
II. Study Approach to Examine Annual Emissions Inspection Schedule to Biennial
Schedule
As discussed earlier, the DEQ has or is in the process of submitting the required SIP documents
related to implementation of Session Law 2017-10. As such, the following study approach
assumes that the proposed changes are ultimately approved by EPA, and the modified program
consists of 22 counties remaining in the I&M program with a rolling 20-year inspection program.
For these counties, we examine the air quality, emissions, operational, and fiscal impacts to
changing the inspection frequency from annual to biennial.
For each of these 22 counties, the study approach involved an analysis of the available ambient
air quality monitoring data for ozone and daily NOx and VOC emissions reductions associated
with the program. The emissions data were used in conjunction with ambient monitoring data
and the new 2015 8-hour ozone NAAQS to provide a basis for developing our recommendation
to change the frequency of emissions inspections. In addition, the study approach included an
analysis to evaluate the potential fiscal impacts associated with changing the frequency of
emissions inspections from annual to biennial.
A. Ambient Air Quality Data
Attainment of the 2015 8-hour ozone NAAQS is demonstrated by monitoring ambient air ozone
concentrations in areas required to be monitored by EPA (typically in and near large
metropolitan areas). A monitoring location is considered in attainment if its design value (DV) is
less than or equal to the current ozone NAAQS of 70 ppb. 8 A total of 14 of the 22 counties have
7F
ozone monitors, and DVs are available for 2014 through 2016 for all 14 counties. The remaining
8 counties are not required to have ozone monitors; however, they are located near counties with
monitors. These data can be used to infer the air quality levels in areas without monitors.
Table 3 and Figure 1 show the 22 counties, the 2014-2016 three-year average ozone DV for
counties that have monitors, and counties that are covered by a maintenance plan for one or more
of the old ozone standards. Table 3 also shows the total number of vehicle inspections
conducted in 2016. Figure 1 shows the boundaries for each maintenance area for the old 1997
and 2008 8-hour ozone standards. 9 The counties that previously have only been maintenance for
8F
8
An ozone design value is the average of the 4th highest ozone measurements for each year of a three-consecutive
year period.
9
For the 1997 8-hour standard, the Charlotte maintenance area includes all of Cabarrus, Gaston, Lincoln,
Mecklenburg, Rowan and Union Counties and a portion of Iredell County. The Charlotte maintenance area for the
8You can also read