NOTOS QUARTERLY - Chartered Investment Germany GmbH
←
→
Page content transcription
If your browser does not render page correctly, please read the page content below
NOTOS QUARTERLY
JUNE 2017

CONTENT

02   EDITORIAL

03   SHIP FINANCE
     HAVE WE HIT ROCK BOTTOM?

05   SHIPPING MARKETS
     DRY BULK: CATCHING BREATH
     BEFORE THE NEXT RISE

13   GLOBAL ECONOMY
     FED CONTINUES TIGHTENING

14   SPECIAL
     SHIPYARDS’ STRUGGLE FOR
     SURVIVAL

17   NOTOS SHIPPING INDICES

                                 notos-group.com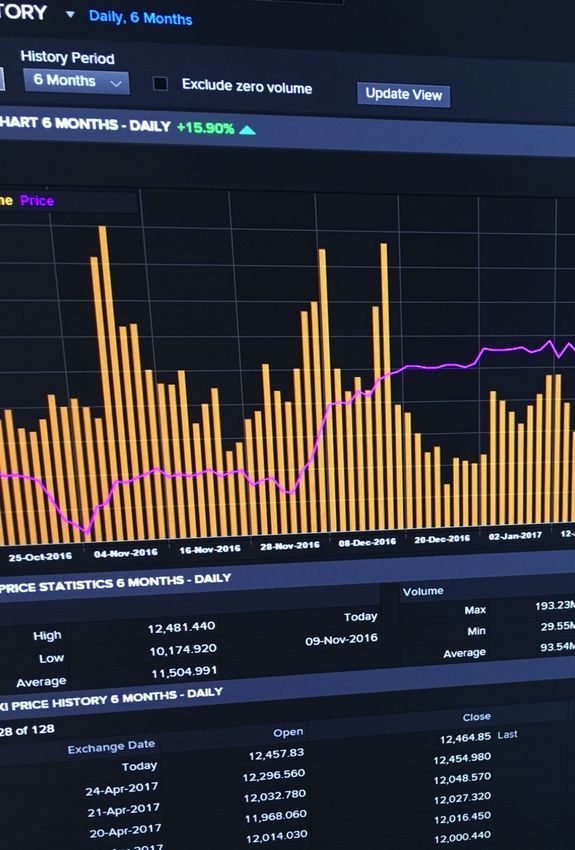
NOTOS QUARTERLY

EDITORIAL

Dear friends and business partners,                         On the global economy and trade front, some dark clouds
                                                            are appearing on the horizon. We hope that the political
Defragmentation is the name of the game currently in ship
                                                            leaders in Europe and the United States are able to avoid
finance. Double Hull Tankers, Frontline, Teekay Tankers,
                                                            any friction to global trade as this would only harm all
BW Group or Tanker Investments are all involved in
                                                            countries involved.
merger talks or rumors. HSH Nordbank is in negotiations
with investors to clinch a deal before early next year.     We wish everybody and especially our Hamburg friends a
Similar situation prevails amongst ship management          constructive and peaceful G20 summit.
companies. We expect more of such news over the next six
months.

In the shipping markets, there seems to be some light at
the end of the tunnel for the container shipping industry   With warmest regards
after many years of frustration. Container charter rates
have picked up and the liner companies seem to return to
operational profits. Consequently, both the container and
liner stock indices gained momentum in the second
quarter of this year.
                                                            Jens Rohweder               Christina Stahn

2
JUNE 2017

SHIP FINANCE

HAVE WE HIT ROCK BOTTOM?                     VARIED RANGE OF COVERAGE RATIOS
The ship finance sector continues to         AMONGST FIVE BANKS
roll out mixed news. Moody’s has
warned of tough times ahead for                         15
German shipping lenders. DVB
continues to incur losses. Nord/LB
                                            in EUR bn   10
has announced job cuts. However, at
the same time, it managed to post a
                                                        5
profit in the first quarter of this year.
HSH Nordbank, amidst its sale
                                                        0
process, most recently reported a                                  HSH            Nord/LB             DVB             Coba
                                                                                                                  Commerzbank                  KfW
profit as well. Petrofin research sees
                                                             Total Shipping Portfolio       NPL Portfolio        Portfolio covered by provisions
a slow rebound for ship finance.
Many new players are emerging to                                                                 Source: Moody’s report on German banks, Notos Group 06/2017

take the place of the traditional ship
financiers. It all probably points to
                                             The five banks, as shown in the graph                          dropped by the bank. Moreover, it
having hit rock bottom. We can only
                                             above, altogether lost EUR 6bn                                 plans to slash up to 1,250 jobs, which
hope that it is true and we do not
                                             through provisions in 2016 and                                 is 20% of its current workforce, to
remain stuck there for long.
                                             raised their aggregate problem loan                            achieve a cost reduction of
                                             coverage ratio from 45% in 2015 to                             EUR 150-200m under its so-called
MOODY’S RENEWED WARNING                      51% in 2016. However, it may still                             ‘One Bank’ transformation program.
ON GERMAN SHIPPING LENDERS                   not suffice to safeguard against                               The program was announced by
Moody’s expects the continuing crisis        possible further losses. According to                          Nord/LB after posting a EUR 2bn loss
in the shipping industry to lead to          Moody’s, each bank should aim to                               for the year 2016.
further losses for Germany’s top five        have a minimum 60% coverage ratio
                                                                                                            All group units, subsidiaries and
shipping banks, especially                   whereas currently DVB has 23%,
                                                                                                            associate companies are going to be
HSH Nordbank, DVB and Nord/LB                Nord/LB 48%, HSH Nordbank
                                                                                                            under scrutiny for divestments to
besides KfW Ipex and Commerzbank.            and KfW each 60% and
                                                                                                            achieve better capital ratios. The
Although these banks have been able          Commerzbank 64%.
                                                                                                            bank’s Common Equity Tier 1 (CET1)
to offload quite a bit of legacy
                                                                                                            ratio as on 31 March 2017 stood at
exposures, the average problem loan
                                             NORD/LB IN THE AFTERMATH                                       10.5% compared to 11.3% a year
ratio rose from 28% in 2015 to 37%
                                             OF THE SHIPPING CRISIS                                         ago. However, the bank was able to
last year.
                                             Beginning of July, Moody’s decided                             start the new year on a positive note.
                                             to downgrade Nord/LB and its
                                             subsidiaries’ deposits by one notch,
                                             to Baa2 and senior unsecured ratings
                                             to Baa3. In a separate development,
                                             the previously announced deal with
                                             KKR to sell a shipping portfolio worth
                                             EUR 1.5bn and 100 ships was

                                                                                                                                                               3
NOTOS QUARTERLY
It reported a consolidated profit of The bank also signed new business DVB NOT ABLE TO
EUR 214m for the first quarter of this worth EUR 2.2bn, majority of which GET RID OF THE RED
year (Q1/2016: loss of EUR 107m) came from the corporate clients and DVB Bank reported a consolidated
and expects to be able to stay in the real estate segments. net loss of EUR 84m for the first
black for the full financial year quarter of 2017, compared to a net
Loan loss provisions continued to be
despite considerable restructuring income of EUR 26m for Q1/2016. It
high for legacy assets and amounted
costs to be absorbed in the near ended the year 2016 also with a loss
to EUR 198m for the first quarter
term. of EUR 135m and has issued a profit
(Q1/2016: EUR 62m), of which the
warning for 2017. The current loss
Net allocations to risk provisioning non-core bank accounted for
results from further allowances for
declined to EUR 126m (Q1/2016: EUR 187m, up from EUR 53m a year
the shipping and offshore sectors.
EUR 435m) and were mainly for ago. The CET1 ratio of the bank
The allowance for credit losses for
shipping assets. The shipping finance improved to 14.9% from 14.1% at the
legacy exposures rose by around
portfolio has been further scaled end of 2016.
EUR 30m to reach EUR 66m.
down in the first quarter to
However, the bank also originated 36
EUR 15.9bn from EUR 16.8bn as at
PROCESS FOR CHANGE OF new transport finance transactions
end 2016. Moreover, it expects to
OWNERSHIP WELL ON TRACK with an aggregate volume of
achieve its target of reducing its
The owners of HSH Nordbank, the EUR 1bn as against 27 new deals
shipping loan portfolio to
states of Schleswig-Holstein and worth EUR 1.2bn in 2016.
EUR 12-14bn by year-end even
Hamburg, conveyed that they had
without the KKR deal.
received indicative offers for the
COMMERZBANK LOAN LOSS
bank by the end-June deadline and a
PROVISIONS AT EUR 195M
HSH NORDBANK WITH PROFIT first review shows them to be a good
Commerzbank has increased its loan
BUT STILL HIGH PROVISIONS basis to successfully continue the
loss provisions to EUR 195m in the
FOR LEGACY ASSETS sales process. Binding offers are due
first quarter from EUR 148m last
HSH Nordbank has achieved a by the autumn.
year. Its asset and capital recovery
pre-tax profit of EUR 128m for the
HNA, the Chinese conglomerate (ACR) division raised its loan loss
first quarter of 2017 as against a loss
which raised its stake in Deutsche provisions to EUR 119m from
of EUR 36m a year ago and expects
Bank recently, was said to be among EUR 70m a year ago, with ship
to be able to generate a profit for the
interested bidders for HSH. However, finance accounting for almost all of
whole business year. It was a result
it is said to have recently denied any this. Group net profit, however, rose
of good operating performance in
interest. In the meanwhile, Cerberus, to EUR 217m (Q1/2016: EUR 169m).
the core bank and the realization of
the private equity firm, and Apollo, The bank expects further loan loss
unrealized gains.
the finance investors are rumored to provisions in the range of
be amongst the interested investors. EUR 450-600m this year.
Cerberus is said to be particularly
interested in buying HSH Nordbank’s
non-performing shipping portfolio.
4JUNE 2017
Commerzbank had decided to Around the same time, Navigare are also reported to have a desire to
withdraw from ship finance in 2012 Capital Partners along with Danica finance external projects. Some
and is still working on shedding its and PensionDanmark has launched leasing companies have also
EUR 4.5bn portfolio of distressed an investment fund with plans to supported transactions for
shipping loans. It has also recently inject USD 300m. It recently acquired non-domestic assets with foreign
returned its license to issue two medium-range (MR) vessels and owners. Furthermore, they appear
‘Schiffspfandbriefe’, German covered intends to invest in a broad portfolio not to restrict themselves to
bonds backed by ship mortgages. of vessels in different segments. newbuilding contracts, but also to
target sale and leaseback deals for
second hand vessels.
MPC CAPITAL AND CHINESE BANKS’
NAVIGARE CAPITAL PARTNERS EVER INCREASING INFLUENCE What is drawing more attention than
ENTER THE ARENA IN SHIP FINANCE their abundant funding and
MPC Capital announced in April that The ship finance sector’s shift from eagerness to do deals, is their
it has completed a private placing of West to East has been the central competitive pricing, service and
USD 100m in equity among theme lately in shipping circles. In a speed. According to Lloyd’s List,
institutional investors and family strong contrast to the developments German owner Döhle has recently
offices in Norway. The fund is to be in the West, many Asian banks have also confirmed a loan deal with ICBC
listed in Oslo and aims to invest in significantly expanded their worth USD 200m.
container vessels in the size-range of portfolios. Bank of China has raised
1,000-3,000 TEU. It has reportedly its shipping assets from USD 12bn in
already acquired its first assets. 2010 to USD 21bn in 2015. An even
more phenomenal rise has been seen
with ICBC’s assets more than tripling
from USD 5bn to USD 18bn and
China Developments Bank’s growing
from USD 2bn to USD 11bn.
Some major Chinese groups with
shipbuilding business have also set
up leasing arms, many of which not
only support shipbuilding and
shipping activities of the group, but
5NOTOS QUARTERLY
CONTAINER / LINER
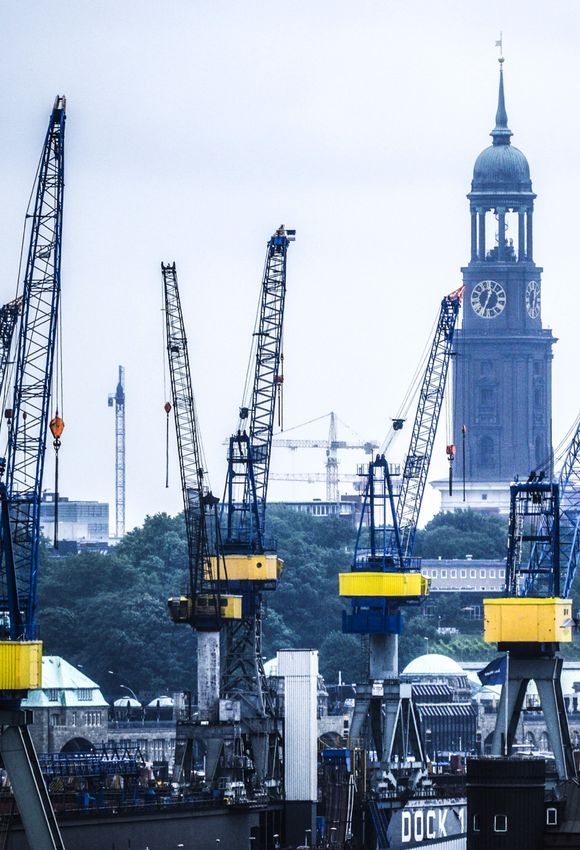
FREIGHT RATES FREIGHT RATES AND CHARTER RATES
CONTINUE THEIR RISE HAVE LEFT THEIR TROUGHS
This year’s freight rates mounted
1.750 100
to levels well above their 2016
averages, supported by accelerating 1.500
volume growth. Such rate
75
improvement has been seen in 1.250
mainlane as well as non-mainlane
1.000
routes. It is also reflected by the
50
Shanghai Containerized Freight 750
Comprehensive Index which rose
from its all-time low at 414 points in 500
25
March 2016 to 816 points in
250
May 2017 as shown in the graph to
the right, although it suffered a 0 0
temporary setback in February and
March.
SCFI Comprehensive Index (right axis) Containership Timecharter Rate Index (left axis)
Source: Clarksons 06/2017
CHARTER RATES FOLLOWED
SUIT ONLY RECENTLY SHORT-LIVED RECOVERY SCRAPPINGS INDISPENSABLE
While increasing freight rates favored However, latest Alphaliner figures FOR REBALANCING
the liner companies, containership suggest that the recovery of Although higher trade volumes
owners were not able to benefit to timecharter rates has melted away. suggest an improvement in the
the same extent. Timecharter rates Charter rates in many sectors started supply-demand balance, the
continued to fall during the to stagnate in April and weakened containership sector remains
aforementioned period, as evidenced partly considerably in June. In challenged by significant
by the Clarksons Containership particular, the classic Panamax overcapacities. Certain reluctance to
Timecharter Rate Index. The segment of 4,000-5,100 TEU and order newbuildings as well as
Timecharter Rate Index did not pick ships above 5,500 TEU were the ongoing demolitions may provide
up until March 2017 when it left its most affected. Further, the steady some relief. However, the slowing
seven-years low. A pronounced reduction of the idle fleet seems to pace of scrappings has led Clarkson
increase was to be seen almost over have come to a halt. Alphaliner to reduce its demolition forecast for
all size segments, reflecting improved reported the idle fleet to have crept 2017 from an expected record
trade fundamentals and stronger up to 2.6% of total capacity as of 0.7m TEU to 0.63m TEU which is
demand from liner companies prior mid-June, up from 2.5% two weeks slightly below last year’s level. As the
to the start of the new alliances in ago. This results from lower container market is still fragile, such
April. scrapping activity in the wake of setbacks hamper the process of
higher charter rates, exerting market rebalancing.
downward pressure on these rates,
again.
6JUNE 2017
TANKER
STRANGE THINGS HAPPENING delivery in total in 2017. The approximately half the price which
IN THE TANKER MARKET combination of these two factors, had to be paid back in 2008. Last
At first sight, the recent rise in the weak transportation demand on one time we saw such low prices was
ordering activity in the tanker market hand and high tonnage supply on the some 15 years back in time.
might look a bit odd in the current other, normally results in a reduced However, these days the shipyards
situation. The achievable earnings contracting. This time it is different, have exhausted their orderbooks and
are on a low level, having come down as shown in the graph below. The are flush with free capacity. Hence,
significantly after the peaks in the ordering activity has increased they are more or less ready to accept
winter season 2015/2016 and dramatically. In 2016, according to the prices that owners are willing to
without a serious upswing looming Clarksons, 14 VLCCs were ordered. pay.
on the horizon. Seaborne trade for For this year till date, the figure has
crude oil is not expected to grow almost doubled, amounting to 27
HIGHER RETURN
substantially in 2017 as the increase units.
ON A LOW LEVEL
in oil consumption is expected to be
The fact that a newbuilding can be
only moderate, despite steadily rising
CHEAP, CHEAP, GOOD PRICE! ordered these days at the price of a
demand from India and China.
The answer to this puzzle is five year old vessel in late 2015/
Nevertheless, the already high
surprisingly easy - it is the price. early 2016 gives these vessels
tonnage supply is further boosted by
Today, newbuilding prices for VLCCs contracted now a competitive
the alarming high numbers of new
and Suezmaxes are at historically low advantage in terms of their earnings
vessels hitting the water which were
levels. One can order a VLCC for as break-even rate. In addition to that,
ordered during the earnings heights
low as USD 80m or a Suezmax for the the upcoming environmental
in 2015: 47 VLCCs were delivered in
bargain price of USD 53m. This is regulation requirements, like
2016 and 123 VLCCs are expected for
scrubbers or ballast water treatment
systems, give these newbuildings
I N CR E ASE D CON T R ACT ING DE SP I T E LOW E AR N I NGS another commercial advantage over
older units which were originally
ordered at a higher price and have to
120.000 14
bear the additional cost for the
100.000 12 installation of aforementioned
devices. We therefore expect an
10
80.000 increased number of older tanker
Numbers
8 tonnage to be sold to scrap when it is
USD/d
60.000
not reasonable to upgrade them. In
6
such a scenario, we might see decent
40.000
4 returns for tankers ordered today,
20.000 albeit on a low level.
2
0 0
01/14 07/14 01/15 07/15 01/16 07/16 01/17
UL / VLCC Contracting (left axis) Average VLCC Long Run Historical Earnings (right axis)
Source: Clarksons 06/2017
7NOTOS QUARTERLY
GAS
STRONG GROWTH
DECREASING VLGC ORDERBOOK
OF VLGC FLEET
The market for Very Large Gas
Carriers (“VLGCs”) has developed YEAR # VESSELS CUBIC METERS % of FLEET
impressively over the last two years.
H2/2017 10 866k 4.0%
The fleet grew by an astonishing 61%
from 13,229,000 cbm at the end of 2018 7 582k 2.7%
2013 to 21,500,000 cbm in June this 2019 6 496k 2.3%
year. This was accompanied by a
2020 2 166k 0.8%
strong but slightly lower growth in
tonne-mile demand, leading to TOTAL 25 2,110k 9.8%
current utilization rates of around
85%. Source: DNB Markets, Clarksons, Avance Gas 06/2017
ORDERBOOK FADING OUT CONTINUOUSLY RISING more congestion at the canal.
However, as shown in the table to TONNE-MILE DEMAND According to Clarksons, most of the
the right, the orderbook has faded While the fleet growth will come to slots at the Panama canal are already
out as of today and reached more an end according to the current booked for the rest of this year. In
modest levels, again. The total order orderbook, analysts from Pareto case no passage can be found in a
book for VLCCs amounts to about Securities expect US-based LPG reasonable time frame, operators
10% of the existing fleet, down from exports to continue to rise. This, in and charterers will have to go a long
40% two years ago. turn, could translate into demand for way round the Cape to discharge in
VLGCs to surge. DNB Markets Asia. We believe that this will have a
expects a 7% growth in demand for positive impact on the market
VLGCs next year, outpacing the balances. As a result, we expect the
supply by more than 100%. utilization rates for VLGCs to bottom
out this year and to improve
remarkably into 2018.
NEW PANAMA CANAL
LEAVING ITS MARK
Furthermore, whereas the opening
of the extended Panama locks
triggered a one-time shock to the
VLGC rates, we now see more and
8JUNE 2017
UTILIZATION FOR LNG LNG CARRIER CAPACITY UTILIZATION
ON THE UPSWING
CARRIERS HAS SURPASSED
ITS TROUGH
150.000 100%
Spot rates for LNG carriers have
come under pressure the last years, 125.000
following a decline in the fleet
utilization from nearly 94% in 2012 100.000 90%
to only 77% in 2015, as shown in the
USD/d
75.000
graph to the right. Consequently,
contracting for newbuilds in 2016 fell 50.000 80%
to 1.9% of the current fleet and to
2.3% in 2017 (ytd). Comparably low 25.000
levels were reached during the
0 70%
period 2008-2010, just before the '05 '07 '09 '11 '13 '15 '17e '19e
boom period of 2011-2012 kicked in.
1y TC Rate (right axis) Utilization in % (left axis)
Source: DNB Markets, Clakrsons 06/2017
IMPROVING SUPPLY-DEMAND
BALANCE FOR LNG CARRIERS
In 2017 and 2018, the last vessels of
the latest ordering boom will hit the Floating LNG and Floating Storage around Cape Hope which will
water. Thereafter, the orderbook and Regasification Unit (FSRU) increase voyage distances to Europe
looks quite bleak with a combined projects opening up new sources and by 80%. Both measures will have a
orderbook-to-fleet ratio of 10% for destinations for LNG around the strong negative effect on the vessel
2018/2019. world. In turn, this will most likely supply, which in turn may help rates
On the contrary, the outlook for the induce tonne-mile demand to to lift up, again.
tonne-mile demand remains strong. accelerate and the spot market for
We expect both charter rates and
DNB Markets expects tonne-mile LNG carriers to gain further weight.
second-hand prices for LNG carriers
demand to rise by 22% in 2018/2019 to improve slowly but steadily over
which would lift the expected THE QATAR EFFECT the next two years. The trough has
utilization rate again to 89%. Such a A further positive impact for charter been left behind.
development is likely to be the result rates may arise from the political
of manifold drivers: outputs from turmoil in the Middle-East. Qatar Gas
Australia and the United States Transport Co, aka ‘Nakilat’ faces
expected to rise by 16m and 14m severe problems due to the port- and
tonnes respectively; continuing low transit-embargos of other countries
prices for LNG further fuelling the like Saudi Arabia, Bahrain, UAE and
demand; rapid growth in probably Egypt. At the time of writing
this article, 17 LNG carriers were
anchoring at Ras Laffan, waiting for
bunkering. Other Qatari carriers were
threatened to bypass the Suez Canal
and to take the route
9NOTOS QUARTERLY
DRY BULK
CATCHING ITS BREATH BEFORE MODERATE FLEET GROWTH overcapacities resulting from
THE NEXT RISE EXPECTED previous years’ deliveries remain
The strong increase of the BDI in the With regard to the supply which continue to put pressure on
first quarter has reversed partially in fundamentals, fleet growth is the market.
April and May. During this period, the expected to be rather moderate. This
BDI has declined from its two year is a result of further slippage,
DRY BULK STOCKS RUNNING
high of 1,333 points as of end-March cancellations as well as scrappings
AHEAD TOO FAR
to 818 points at the beginning of due to stricter emission
Dry bulk stock prices have dropped
June. Nevertheless, we think that the requirements and ballast water
since the beginning of April, moving
medium-term recovery process treatment regulation. Further, the
sideways afterwards. Interestingly,
which started 15 months ago is just current orderbook is fairly modest
analysts’ target prices continued
taking a short break to catch its with newbuilding orders standing at
their climb rather than follow suit, as
breath for the next rise to come. around 6.2% for 2017 and 2018,
shown in the graph below. We
Such expectation is also reflected in compared to 12.2% in the previous
believe that like the BDI, dry bulk
the asset prices: the prices for five year. Thus, DNB expects the dry bulk
stocks are holding their breath,
year old benchmark vessels in the fleet to grow at a rate of 2.3% in
waiting for further impetus to make
larger size segments have increased 2017 and only 0.1% and 0.4% in 2018
good what was lost in the downward
some 20% to 35% since the and 2019, respectively. Despite this
slide of the years 2014/2015.
beginning of the year. improvement, considerable
CHINA SWITCHES FROM
DOMESTIC MINING TO IMPORTS DRY BULK TARGET PRICE INDEX CONTINUES TO RISE
RELATIVE TO THE NOTOS BULKER INDEX
Dry bulk demand growth is estimated
to be about 2% p.a. for the next 300
three years, according to DNB.
Fundamentally, this is fostered by 250
China’s policy switch regarding the
procurement of coal and iron ore. 200
index points
During the past year, China has
150
reduced domestic mining and instead
increased imports of high quality iron
100
ore and coal. Particularly coal
imports have become more
50
meaningful in China’s efforts to
enforce emission reductions. Further, 0
iron ore imports into China continue
to be around the one million tons
Notos Bulker Index Target Prices
mark (annualized), further
supporting the dry bulk market.
Source: Thomson Reuters, Notos Group, 06/2017
10JUNE 2017
OFFSHORE
GLOOMY MARKET OUTLOOK to file for Chapter 11 bankruptcy barrel in 2013 to USD 35 per barrel
Fundamentally, the outlook for the protection are CGG and Ezra as of today, according to Rystad
offshore supply vessel industry Holdings. Energy analysis. By contrast, North
remains invariably gloomy. Despite a Sea offshore projects would require a
modest orderbook of 8% and 6% of minimum oil price of about USD 57
OPEC DILEMMA KEEPS
the existing PSV and AHTS fleets, the per barrel to be competitive.
MARKET UNDER PRESSURE
supply overhang continues to persist
Having to live with a substantially The OPEC’s dilemma is that if they
amidst low levels of scrapping. In
lower oil price compared to pre-2014 cut production further than hitherto,
addition, cost cutting measures of
levels, appears to be the new reality US fracking companies will fill the
deep-sea drillers and operators
for the offshore industry. With its gap which would at least put a cap to
combined with the low oil price
production cut in November last the oil price. If OPEC’s production is
reducing energy companies’ capital
year, the OPEC has tried hard to push increased or even maintained at the
expenditures in offshore projects,
the oil price up to above USD 50 per current level, the oil price will fall
continue to take their toll and put
barrel. However, this move has been again. Thus, the US oil industry
pressure on the market. Industry talk
just partly successful due to benefits either way, having
at the latest Marine Money
uncontrolled oil production from developed to a swift ‘swing producer’
conference in Oslo suggests that the
non-OPEC members and in whereas OPEC has lost its supposed
offshore market will take another 18
particular, the new flexibility of the control over the oil price. Therefore,
months to recover from the existing
US fracking industry. Technical it may take quite a while to again
overcapacities.
progress during the past years has reach oil prices above USD 70 per
enabled US shale oil producers to barrel. Until then, the pressure on
NEW LOW FOR lower average wellhead breakeven the deepsea offshore market is
OFFSHORE STOCKS prices substantially, from USD 80 per unlikely to abate considerably.
No improvement was in sight for the
Notos Offshore Index which hit a new MANY OFFSHORE STOCKS STILL SUFFER
ten years-low at the end of June. The (12 MONTHS PERFORMANCE)
year-on-year development of BW Offshore Ltd
Songa Offshore SE
offshore stock prices as shown in the
Mermaid Maritime PCL
graph to the right reveals that quite a McDermott International Inc
few stocks have lost even more than SBM Offshore NV
50% over the past 12 months. Bonheur ASA
Subsea 7 SA
Suffering from falling asset values
Petroleum Geo Services ASA
and revenues and simultaneously Northern Offshore Ltd
being pressed by the lenders to Dof ASA
repay their debt, a number of Solstad Farstad ASA
Seadrill Partners LLC
offshore services companies have
MMA Offshore Ltd
filed for bankruptcy or face winding- Sevan Marine ASA
up. Among the latest offshore Teekay Offshore Partners LP
services providers which have chosen Hornbeck Offshore Services Inc
Seadrill Ltd
-100% -50% 0% 50% 100% 150% 200%
200%
Source: Thomson Reuters, Notos Group 06/2017
11NOTOS QUARTERLY
GLOBAL ECONOMY
SOLID US ECONOMIC ROBUST BUT MODEST US ECONOMIC GROWTH
DEVELOPMENT
Economic data confirms that the 6
percentage change from preceding periods
US economy has started fairly well
5
into this year. The labor market
4
further stabilized with solid job gains
and the unemployment rate falling to 3
just 4.3% in May. This, in turn, 2
supports the expectations of private 1
consumption rising in future.
0
Business fixed investment improved.
Inflation rates are close to the -1
Federal Reserve Bank’s target rate of -2
two percent, although core inflation 01/14 07/14 01/15 07/15 01/16 07/16 01/17
fell from 1.9% to 1.7% recently. Last Real Gross Domestic Product
but not least, annualized growth for
Source: US Bureau of Economic Analysis 06/2017
the first quarter was revised upwards
to 1.4% which is 0.7 percentage
points above the first estimate, albeit manufactured durable goods increase in March. With this move
significantly below the 2.1% of the decreased for the second time in accomplished, we foresee a last
previous quarter. succession. Nevertheless, after a arrow in Fed’s quiver for this year,
somewhat dented first quarter, there making up for another Fed Funds
is some good reason to believe that Rate hike of 25bps either directly
STRONGER SECOND QUARTER real GDP growth may bounce back in after the summer holidays or just
EXPECTED the second quarter, indicated by before year-end.
Yet the beginning of the year was not increasing optimism, especially on
all sunshine. Although consumption the consumers’ side.
expenditure increased, its growth
rate remained quite soft in the first
FED CONTINUES MONETARY
quarter. New orders for
TIGHTENING
The Fed’s 25bps interest rate rise as
of June therefore came at no
surprise, having been steadily backed
by sufficiently positive economic
fundamentals and corresponding
communication since its previous
12JUNE 2017
SPECIAL: SHIPYARDS’ STRUGGLE FOR SURVIVAL
Since the beginning of the crisis in CHINA SURPASSES ESTABLISHED SHIPBUILDERS
2008, most shipping sectors suffer
from overcapacities, sometimes
250
combined with low demand for
transportation in their respective
segment. Unsurprisingly, this has left 200
orders in mDWT
its mark on the shipbuilding industry
which has been facing diminishing
150
demand for new ships,
postponement of deliveries and
falling newbuilding prices compared 100
to the pre-crisis period. In such
downswing, yards tried to brace
50
against dwindling cash reserves with
drastic restructuring measures,
waves of layoffs and spinning-off 0
non-core businesses. Even state- '02 '04 '06 '08 '10 '12 '14 '16
owned shipyards could not fully South Korea Japan Others P.R. China
evade such development. However,
Source: Clarksons 06/2017
the forces of economics have played
out somewhat differently in the
three major shipbuilding nations. in 2008, closely followed by orders POST-BOOM ORDERING
placed in South Korea and, to a lesser ACTIVITY DOWN TO 2004 LEVEL
extent, in Japan. China’s rapid gain in With the massive supply overhang in
CHINA’S FIGHT
market share was further fostered by many shipping sectors becoming
FOR MARKET SHARE
cheap production costs and evident in 2008, the ordering activity
Of the three major players China,
abundant availability of capacities for stunted, reaching a temporary low in
Japan and South Korea, particularly
the shipowners’ insatiable hunger for 2013. By then, newbuilding orders
China has pushed aggressively for an
newbuildings. Thus, the term had decreased by 51% in China,
increasing market share since 2005.
‘green-field yard’ is closely 70% in South Korea and 62% in
This was made possible by
connected to this period when new Japan. After a brief revival in 2014,
substantial direct and indirect
Chinese yards sprang up like the downwards spiral has continued
subsidies from the Chinese
mushrooms. Unable to compete with till today. Ordering of Chinese
government which had declared
China in terms of pricing, established newbuildings has reached a new low,
shipbuilding as a key industry.
quality builders in South Korea and amounting to merely DWT 76m of
The graph above shows that Japan lost market shares and some today. This is only slightly higher than
although the three nations followed decided to set up joint ventures in the DWT 45m and DWT 50m orders
the same pattern of rise and fall in China. currently in South Korea and Japan
the orders, it was most pronounced respectively. Altogether, the ordering
in the case of China. The Chinese activity has shrunk to DWT 186m
orderbook nearly quintupled which is the same level as in 2004.
between 2005 and the market high
13NOTOS QUARTERLY
NEWBUILDING PRICES NEWBUILDING PRICES STILL FALLING
STILL FALLING
Consequently, newbuilding prices 200
started to drop dramatically due to
the lack of ordering activity. The 180
Clarkson Newbuilding Price Index lost
26% within 12 months after the high
in 2008. Although there were some index points 160
signs of recovery in 2013/2014, the
market continued its fall
140
subsequently, reaching its 13 years
historical low in 2017 as depicted in
the graph to the right. 120
CHINA’S ‘WHITE LIST’ 100
China’s massive expansionary policy '07 '08 '09 '10 '11 '12 '13 '14 '15 '16
targeting the market share led to a
Source: Clarksons 06/2017
surge in the yard capacity in the
boom period. The number of
shipyards reached about 1,600 which evident in Clarksons’ estimations restructuring measures. After having
even by Chinese standards was too according to which 90% of the incurred huge losses for the past few
high to maintain in the subsequent shipbuilding output in 2016 have years, the ‘Big Three’ shipyards,
crisis. To get rid of the been delivered from the White List- Daewoo Shipbuilding & Marine
overcapacities, China’s Ministry of yards. Market expectations have it Engineering, Hyundai Heavy
Industry and Information Technology that the number of listed yards will Industries and Samsung Heavy
in 2014 released its first so-called be reduced to 59, reflecting the Industries, plan to reduce their
‘White List’ of 51 shipyards which government’s continuing aim to workforces by around one third by
would be extended extra support by curtail capacity overhang. 2018 and operations by 23%, besides
the government. Such white-listed spinning-off their non-shipbuilding
yards had to comply with certain businesses, as reported by the
SOUTH KOREAN YARDS
conditions to benefit from government last year. STX Offshore &
EQUIPPED WITH
government support provided, inter Shipbuilding, once Korea’s fourth
SUBSTANTIAL AID
alia, in the form of exporting tax largest shipyard, had to file for
Shipbuilding is one of South Korea’s
rebates and bank loans. receivership.
most important industries with a
Since then, the list has been regularly significant share in its gross domestic
updated and the criteria revised. product and domestic workforce.
Meanwhile, the ministry has released Amidst shrinking orders, falling
its fourth White List comprising 70 newbuilding prices and postponed
shipyards. The commercial deliveries, South Korea’s shipbuilding
importance of this list becomes sector has been forced to undergo
drastic consolidation and
14JUNE 2017
JAPAN'S REVERSING MARKET SHARES AS OF LATE
To help local shipbuilders, the South
Korean government in October last
60%
year announced plans to support
orders of 250 or more vessels by
2020 by spending KRW 11tn or 50%
approximately USD 9.6bn. Further,
the shipbuilders’ portfolio is likely to 40%
market share of odered tonnage
focus on large container ships, oil
tankers, and LNG carriers in the 30%
future. As of late, South Korean
shipyards are reported to apparently
20%
return to profitability, helped by
rising deliveries, cost-cutting
measures and new orders. 10%
JAPAN BENEFITS 0%
'02 '04 '06 '08 '10 '12 '14 '16
FROM EARLY REORIENTATION
Japan was faced with the loss of China South Korea Japan
market share due to rising
competition even before the Source: Clarksons 06/2017
shipping boom reached its high.
Thus, Japanese shipbuilders were
compelled to implement A helping hand has been offered by CONTRACTING PICKING UP,
consolidation and efficiency the weakening Japanese Yen whilst ALBEIT AT A LOW LEVEL
measures and to reorient their the highly valued Yen in previous This year, the placing of newbuilding
businesses earlier than their years had undermined Japanese orders at various yards has induced
competitors in South Korea and shipyards’ competitiveness. some optimism that the yards’
China. Further, Japan’s shipbuilding financial situation would improve
Presently, Japanese builders fear that
industry turned early to focus on and shipowners would expect
South Korean and Chinese yards, in
more technology advanced vessels to markets to tighten in the future. The
their struggle for survival and backed
differ from China and South Korea. table on the next page reveals that
by massive governmental support,
Consequently, despite massive new contracts in the four main
might accept orders at sub break-
government support and segments dry bulk, tankers,
even prices. However, stricter
restructuring efforts in those containers and gas tankers in the
environmental regulations
countries, Japan’s shipbuilders have three major shipbuilding countries
concerning the ballast water
managed to increase their market collapsed to only 273 in 2016, down
management systems and the new
share from its low of 18% in 2011 to from 1,009 contracts in 2015.
global sulphur cap would provide an
27% as of today, as shown in the
opportunity to Japan’s yards to stay
graph above.
competitive due to their capability in
ecoships, according to Shigeru
Murayama, president of the Japan
Ship Exporters’ Association.
15NOTOS QUARTERLY
This year till date, contracts for 184 although it steadily gained market shipbuilders. Shipbuilding in South
newbuildings have already been share during the past five years. Korea with its substantial impact on
signed. Extrapolated for the whole the overall economy is also likely to
year 2017, we believe that this could retain its priority for receiving
A SILVER LINING
result in a number fairly above government support. Japanese
ON THE HORIZON
last year’s. players seem to be less prone to
Although the development of
state aid. But, they already
Of the three shipbuilding newbuilding prices draws a grim
underwent a severe change process
heavyweights, China leads in outlook and the struggle for market
shortly after the shipping boom
absolute numbers. However, only shares remains unabated, the gently
ended and recently managed to
South Korea has managed to secure ascending number of contracts
overtake rival South Korea in the run
more new contracts in 2017 leaves some hope for the ailing
for ordered tonnage.
compared to the previous year. With shipbuilding industry. However, the
regard to the type of vessel to be survival of many shipyards depends The financial markets seem to
built, while China has managed to not only on their respective believe in the shipyards’ future. As
clinch a good number of orders for efficiency, cost-reduction and deteriorated fundamentals should
both bulkers and tankers, South concentration on core competencies, already be priced-in and government
Korean contracts clearly focus on but also on the extent of government support and individual restructuring
tanker and gas carrier newbuildings. support. measures begin to unfold their full
With the lowest number of contracts, impact, yards’ stock prices have risen
While reducing overcapacities is still
Japan seems to be in the rearguard, like phoenix from the ashes, making
a core topic, the Chinese government
over 20% since the start of the year.
within its scope of the ‘White List’
remains committed to its
NEWBUILDING CONTRACTS BY TYPE AND COUNTRY
IN NUMBERS JAPAN SOUTH KOREA CHINA
2015 2016 2017 2015 2016 2017 2015 2016 2017
BULK 213 9 12 0 1 3 65 33 36
TANKER 181 25 7 110 41 54 133 58 44
CONTAINER 38 17 0 53 4 0 130 65 11
GAS 32 9 1 47 10 14 7 1 2
TOTAL 464 60 20 210 56 71 335 157 93
Source: Clarksons 06/2017
16JUNE 2017
NOTOS SHIPPING INDICES
THIS TIME IT IS DIFFERENT INDEX DEVELOPMENT AS OF 20 JUNE 2017
The Notos Shipping Indices lost on average 7.1% during the
INDEX QUOTE ±Q/Q ±Y/Y
second quarter. Especially the dry bulk companies took a
break and partly corrected their huge gains from the past SHIPPING TOTAL 914.3 -7.1% +5.1%
twelve months. Most recently, Diana Shipping, Star Bulk BULKER 934.8 +-7.3% +81.7%
and others restarted their engines and regained some
CONTAINER 26.4 +6.6% -26.7%
percentage points. Given the still lagging dry bulk freight
markets, we would wait and watch whether the investors TANKER 765.2 -2.7% +1.7%
or the freight market proves right by the year-end.
OFFSHORE 265.7 -15.0% -21.0%
The winners of the past quarter have been the container GAS 725.2 -15.3% +8.6%
owners. The Notos Container Index gained around 6.6%,
LINER 417.3 +3.9% +16.5%
driven mainly by Seaspan and Costamare. Simultaneously,
the liner companies’ stock prices increased by 3.9%.
Source: Notos Group 06/2017
We expect the markets to drift sideways in Q3 but to
strengthen again in Q4. Overall, it would not be surprising
to see 2017 turn out to be a profitable year for shipping
markets in general.
NOTOS SECTOR INDICES
230
210
190
170
150
130
110
90
70
50
07/16 08/16 09/16 10/16 11/16 12/16 01/17 02/17 03/17 04/17 05/17 06/17
Bulker Container Tanker Offshore Gas Liner
Source: Notos Group 06/2017
17NOTOS QUARTERLY
DISCLAIMER PUBLISHER
This document has been prepared and approved by Notos Consult NOTOS CONSULT GMBH
GmbH and is for informational purpose only. The information BALLINDAMM 17
presented in this report is intended for the recipient to whom it 20095 HAMBURG
was delivered. Reproduction or distribution of this document in GERMANY
whole or in part is not permitted without the express written
consent of Notos Consult GmbH.
CONTACT
This document contains forward-looking statements. We caution the
reader that forward-looking statements are not guarantees of future T +49 40 6094 550 – 0
performance. Past returns are no indication of future returns. The F +49 40 6094 550 – 92
development of the industry, markets and companies described in INFO@NOTOS-GROUP.COM
this document, may differ materially from the forward-looking
statement contained herein.
Information and opinions contained in this document have been
compiled from sources believed to be reliable. Unless otherwise
stated, any statements herein are based on our own estimates at the
time of publication. Notos Consult GmbH makes no representation REGISTERED OFFICE: HAMBURG
as to the accuracy or completeness of any of the information REGISTRATION COURT:
contained herein and accepts no liability for loss arising from the use AMTSGERICHT HAMBURG | HRB 120813
of the information provided.
This document is not an offer of any kind. This report has been
MANAGING DIRECTORS:
prepared separately from any proposed offering of any security and
as such information herein must not be relied upon as having been DR. JENS ROHWEDER
authorized or approved by the issuer of such security. DR. CHRISTINA STAHN
notos-group.comYou can also read