Novel Coronavirus: How Atmospheric Particulate Affects Our Environment and Health - MDPI
←
→
Page content transcription
If your browser does not render page correctly, please read the page content below
challenges
Opinion
Novel Coronavirus: How Atmospheric Particulate
Affects Our Environment and Health
Luigi Sanità di Toppi 1, * , Lorenzo Sanità di Toppi 2 and Erika Bellini 1
1 Department of Biology, University of Pisa, 56126 Pisa, Italy; erika.bellini@biologia.unipi.it
2 Freelance Management Engineer, 56121 Pisa, Italy; loresani@hotmail.it
* Correspondence: luigi.sanita@unipi.it
Received: 7 April 2020; Accepted: 27 April 2020; Published: 29 April 2020
Abstract: It is well-known that atmospheric pollution, first and foremost the particulate matter (PM),
causes serious diseases in humans. China’s metropolises and Italy’s Po Valley have in fact achieved
a concerning degree of notoriety thanks to runaway air pollution problems. The spread of viral
respiratory diseases is facilitated in polluted environments, an example of which is the respiratory
syncytial virus bronchiolitis. In this opinion paper, we consider the possible relationship between air
pollution, primarily airborne PM10–2.5 , and the spread of the novel coronavirus in Northern Italy. If it
is true that the novel coronavirus remains active from some hours to several days on various surfaces,
it is logical to postulate that the same can occur when it is adsorbed or absorbed by the atmospheric
particulate matter, which may also help carry the virus into the human respiratory system. As the
Earth presents us with a very high bill to pay, governments and other authorities need to take prompt
action to counter excessive pollution levels, both in Italy and in other countries.
Keywords: atmospheric pollution; coronavirus; COVID-19; particulate matter; respiratory diseases
1. Air Quality in a Large Area of Northern Italy (the Po Valley) has been Severely Compromised
for Decades
For many years, studies have been conducted into interactions between environmental pollution
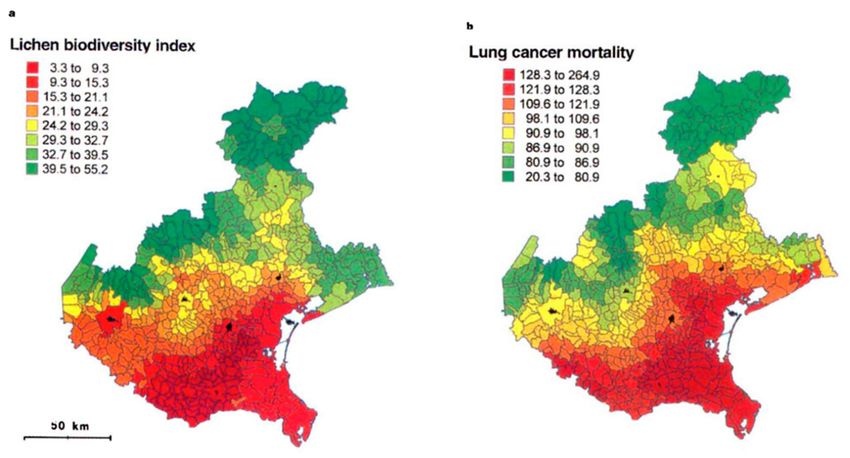
and the incidence of acute and chronic diseases. By way of example, in 1997, Cesare Cislaghi and
Pier Luigi Nimis published an authoritative paper [1] on the striking correlation between lung cancer
mortality in the “young” male population (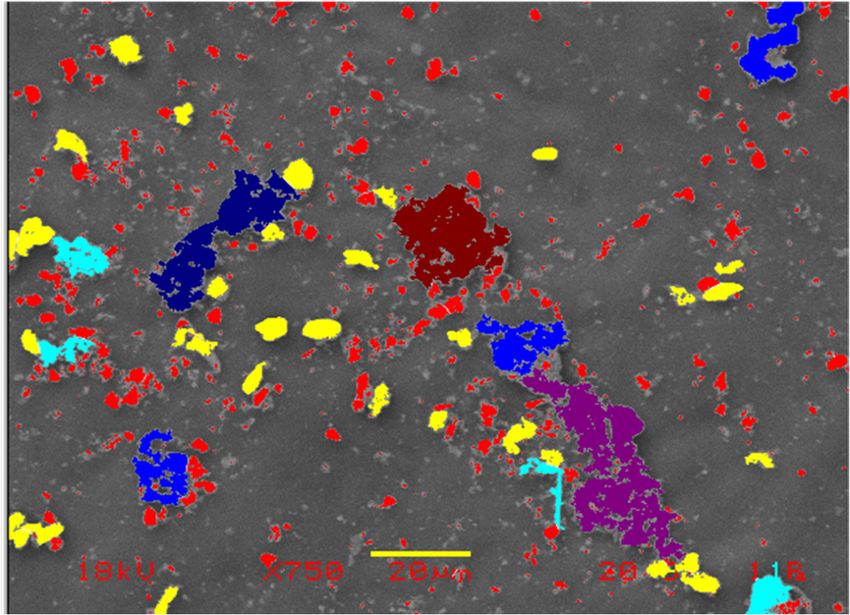
Challenges 2020,11,
Challenges2020, 11,6x FOR PEER REVIEW 22of
of12
12
Figure 1. (a) Lichen biodiversity index, calculated as the sum of frequencies of all epiphytic species
Figure
in 1. (a) Lichen
a sampling grid biodiversity
of 10 units; index,
(b) lungcalculated as the suminofyoung
cancer mortality frequencies
male of all epiphytic
residents speciesas
(expressed in
a sampling grid of 10 units; (b) lung cancer mortality in young male residents (expressed
observed/expected cases × 100), in the Italian region of Veneto. Scale intervals are based on percentiles as
observed/expected
of cases
values distribution. × 100), inbythe
Reprinted Italian region
permission fromofSpringer
Veneto. Nature:
Scale intervals areand
Cislaghi based on percentiles
Nimis, “Lichens,
of values
air distribution.
pollution Reprinted
and lung cancer”. ©Nature,
by permission from Springer
387:463–464, 1997. Nature: Cislaghi and Nimis, “Lichens,
air pollution and lung cancer”. ©Nature, 387:463–464, 1997.
A number of years later, in 2013, the Lyon-based International Agency for Research on Cancer
A number
(IARC—an agencyof years later, in and
that analyzes 2013,classifies
the Lyon-based International
cancer-causing agents Agency for Research
and substances on Cancer
on behalf of the
(IARC—an
World Health agency that analyzes
Organization) and classifies
formally ranked the cancer-causing agents and substances
cocktail of combustions on behalf
caused by traffic, of the
heating,
World
and Health Organization)
industrial emissions in “group formally ranked the carcinogenic”.
1—definitely cocktail of combustions caused
Accordingly, by 2013
since traffic,
theheating,
IARC,
and
as theindustrial emissions
world’s leading in “group
cancer 1—definitely
authority, carcinogenic”.
has officially stated that Accordingly,
particulates and since 2013 the
various IARC, as
substances
the world’s
found in the leading
atmospherecancer authority,
of our has officially
cities represent stated that particulates
an unequivocally carcinogenic andmixture
variousfor substances
humans.
found in in
Consider thethis
atmosphere
regard that of particulate
our cities represent
matter and antropospheric
unequivocally carcinogenic
ozone have such mixture
negativeforeffects
humans.on
Consider in this regard that particulate matter and tropospheric ozone have
human health that, in many areas of the world, they surpass the total toxicity attributable to all the such negative effects on
human
other health substances.
airborne that, in many areas of the world, they surpass the total toxicity attributable to all the
otherGiven
airborne
the substances.
above, a clarification should be made: areas particularly susceptible to pollution
Given to
(especially theatmospheric
above, a clarification should be
pollution) include themade: areas and
vast urban particularly
suburban susceptible to pollution
districts/territories of
(especially
Los Angeles, to atmospheric
Mexico City,pollution) include the
Central/Southern vastand
Asia, urban
the and suburban
Chinese districts/territories
metropolises. of Los
Unfortunately,
Angeles,
they also Mexico
comprise City,
theCentral/Southern
Po Valley in Northern Asia, and
Italythe Chinese
[2,3], formed metropolises.
by part of the Unfortunately, they also
regions of Piedmont,
comprise the
Lombardy, Po Valley in Northern
Emilia-Romagna, Veneto, Italy [2,3], formed by
and Friuli-Venezia part of
Giulia. In the regions
actual of Piedmont,
fact, values Lombardy,
of air pollution in
Emilia-Romagna,
the Po Valley exceed Veneto,
targetand limits Friuli-Venezia
to an almostGiulia.
chronicInandactual fact, values
sometimes of airextent
alarming pollution
(see in the Po
Figure 2
for a representative example). Due to the presence of the Alps (Central-Southern Europe’s highesta
Valley exceed target limits to an almost chronic and sometimes alarming extent (see Figure 2 for
representative
mountains), whichexample).
close theDue to peninsula
Italian the presence to theofnorthwest,
the Alps overall
(Central-Southern
reduced wind Europe’s highest
speed, average
mountains),temperatures,
continental which close the highItalian peninsulahumidity,
atmospheric to the northwest,
and huge overall reduced
anthropic wind speed,
pressure, the Poaverage
Valley
continental temperatures, high atmospheric humidity, and huge anthropic
unfortunately has a series of characteristics that make it ideal for chronic persistence of pollutants,pressure, the Po Valley
unfortunately
which are damaginghas a for
seriesair,of characteristics
water, that
soil, and the make it ideal
organisms for chronic
that populate persistence
them, includingofpeople.
pollutants,
which are damaging for air, water, soil, and the organisms that populate them, including people.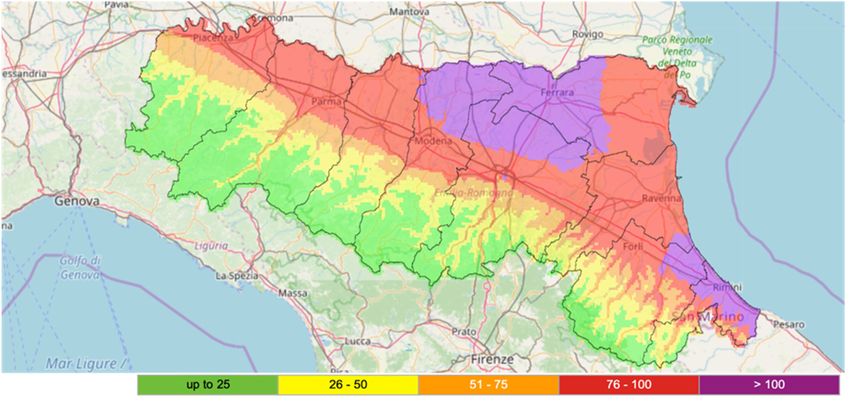
Challenges 2020, 11, 6                                                                                                    3 of 12
Challenges 2020, 11, x FOR PEER REVIEW                                                                                    3 of 12

                Exemplifying map
      Figure 2. Exemplifying     map of
                                      of the
                                          the particulate
                                              particulatematter
                                                            matter(PM
                                                                   (PM1010
                                                                         ) )levels
                                                                              levels(expressed
                                                                                      (expressedasasµgµgmm−3)−3 ) reached
                                                                                                              reached    in
      in
      thethe Emilia-Romagna
          Emilia-Romagna        region,
                             region,    whose
                                     whose      Northern/Western
                                              Northern/Western       part
                                                                   part      is comprised
                                                                        is comprised         in Italy’s
                                                                                          in Italy’s Po Po Valley.
                                                                                                        Valley.      Date:
                                                                                                                  Date: 16
      16 January
      January    2020,
              2020,    illustrating
                    illustrating    the
                                  the   recurrentsituation
                                      recurrent     situationon
                                                              onaanumber
                                                                   numberof    ofmany
                                                                                 many autumn/winter
                                                                                         autumn/winter days.       Printed
                                                                                                          days. Printed
      by
      by permission
          permission of
                      of the
                          the Environmental
                               Environmental andand Energy
                                                       Energy Protection     Agency of
                                                               Protection Agency        of Emilia-Romagna
                                                                                           Emilia-Romagna (ARPAE;(ARPAE;
      http://www.arpae.it/,
      http://www.arpae.it/,suite
                              suitemodelling
                                    modelling“NINFA”),
                                                “NINFA”),kindly
                                                              kindlyacknowledged.
                                                                     acknowledged.

     Thus,
      Thus, ititisisno
                     nocoincidence
                         coincidence that  in the
                                        that       Po Valley,
                                              in the          as indeed
                                                      Po Valley,          in Chinese
                                                                   as indeed           metropolises,
                                                                                in Chinese             trends in
                                                                                              metropolises,       certain
                                                                                                               trends  in
contaminants      are  not decreasing   over   time; instead  they  are stationary,  or even  increasing.
certain contaminants are not decreasing over time; instead they are stationary, or even increasing. In      In relatively
restricted, highly urbanized
relatively restricted,             areas, the levels
                           highly urbanized      areas,ofthe
                                                           pollutants
                                                             levels ofoften   reach extreme
                                                                        pollutants             peaks
                                                                                     often reach       that damage
                                                                                                    extreme           the
                                                                                                              peaks that
environment       and  pose  a serious   threat  to human    health.  The   damp   climate,  the
damage the environment and pose a serious threat to human health. The damp climate, the absence   absence   of adequate
ventilation,
of adequate and       in someand
                ventilation,    cases
                                    in the
                                        somelow   temperatures
                                                cases             are clearly all
                                                      the low temperatures       arefactors
                                                                                     clearlythat   combine
                                                                                              all factors    tocombine
                                                                                                          that   causing
atmospheric     stagnation,stagnation,
to causing atmospheric         thus contributing     towards airtowards
                                             thus contributing     pollution.air pollution.
2. Origin and Characteristics of Particulates
2. Origin and Characteristics of Particulates
       Particulates are microscopic solid or liquid particles temporarily suspended in the air. Aerosols,
       Particulates are microscopic solid or liquid particles temporarily suspended in the air. Aerosols,
i.e., a combination of liquid droplets and solid particles, are also a form of particulate. The main natural
i.e., a combination of liquid droplets and solid particles, are also a form of particulate. The main
and anthropogenic sources are volcano emissions, sand, rock erosion, forest fires, leaf litter, sewage
natural and anthropogenic sources are volcano emissions, sand, rock erosion, forest fires, leaf litter,
manure spreading, pollens, lichen propagules, micrometeorites, quarries, mines, landfills, incinerators,
sewage manure spreading, pollens, lichen propagules, micrometeorites, quarries, mines, landfills,
cement plants, crumbled plaster, asphalt, motorized traffic, wear of brakes and tires, exhaust gases
incinerators, cement plants, crumbled plaster, asphalt, motorized traffic, wear of brakes and tires,
from aircraft engines, industrial fumes, domestic heating, foundries, steel mills, coal or heavy oil power
exhaust gases from aircraft engines, industrial fumes, domestic heating, foundries, steel mills, coal or
plants, etc. Particulates also form abundantly in the atmosphere when low vapor pressure substances
heavy oil power plants, etc. Particulates also form abundantly in the atmosphere when low vapor
condensate, and/or following (photo)chemical reactions between gaseous primary pollutants, such as
pressure substances condensate, and/or following (photo)chemical reactions between gaseous
nitrogen and sulfur oxides, ozone, volatile organic compounds, and ammonia; all these are substances
primary pollutants, such as nitrogen and sulfur oxides, ozone, volatile organic compounds, and
found in considerable amounts in densely-populated areas.
ammonia; all these are substances found in considerable amounts in densely-populated areas.
       From a dimensional standpoint, particles that make up particulates are considered “coarse” if
       From a dimensional standpoint, particles that make up particulates are considered “coarse” if
they have a diameter greater than 2.5 µm. Below this size, they are called “fine or thin” (
Challenges 2020, 11, 6                                                                                        4 of 12
 Challenges 2020, 11, x FOR PEER REVIEW                                                                      4 of 12

      Figure3.3.Schematic
     Figure     Schematic dimensional
                          dimensional comparison
                                      comparison between some particles
                                                 between some particles and
                                                                        and the
                                                                             thecross-section
                                                                                 cross-sectionof
                                                                                               ofaahuman
                                                                                                    human
     hair
      hair(60
           (60µm).
               µm).

      The amount of particulate matter in a certain volume of air is indicated by an index, called PM
        The amount of particulate matter in a certain volume of air is indicated by an index, called PM
(which stands for “particulate matter”). The most common PM indices are PM10 and PM2.5 , which
  (which stands for “particulate matter”). The most common PM indices are PM10               10 and PM2.52.5, which
indicate
  indicatethe
            thetotal
                totalconcentration
                      concentration ofof particles  with aa diameter
                                         particles with     diameterof  ofless
                                                                           lessthan
                                                                                than10
                                                                                     10and
                                                                                         and2.5
                                                                                             2.5µm,    respectively.
                                                                                                 µm,respectively.
PM                                                           −3 of air. Unfortunately, there are still no official
  PMconcentrations
       concentrationsare arecurrently
                             currently expressed
                                        expressed in   µg m
                                                    in µg  m−3
                                                             −3 of air. Unfortunately, there are still no official
indices   for ultrafine   particles  and   nanoparticles.
  indices for ultrafine particles and nanoparticles. We can  We   can get
                                                                        get an
                                                                            an understanding
                                                                                understandingof  of the
                                                                                                     the “order
                                                                                                          “orderofof
magnitude”
  magnitude”ififwe webear
                       bearininmind
                                mind that
                                       that the
                                             the amount
                                                 amount ofof particulate   matter that
                                                             particulate matter    that can
                                                                                        can accumulate
                                                                                            accumulateannually
                                                                                                           annually
ininaapolluted   area is in the  order  of hundreds   of tons   per 10,000   m 2 (per hectare). See Figure 4 for a
       polluted area is in the order of hundreds of tons per 10,000 m22 (per hectare). See Figure 4 for a
microscopic
  microscopicobservation
                observationof  ofthe
                                  theparticulate
                                      particulate matter
                                                   matter deposited
                                                           deposited onon aa biological surface.
                                                                             biological surface.

      Figure 4. Particulate matter deposition on a biological surface. Colors indicate the dimensional ranges
     Figure 4. Particulate matter deposition on a biological surface. Colors indicate the dimensional ranges of
      of particles: red, ∅ < 1 µm; yellow, ∅ ∼ 4 µm; light blue, ∅ ∼ 8 µm; blue/dark blue, ∅ ∼ 11.5 µm.
     particles: red, ∅ < 1 µm; yellow, ∅ ~ 4 µm; light blue, ∅ ~ 8 µm; blue/dark blue, ∅ ~ 11.5 µm. Dimensional
      Dimensional bar = 20 µm. Photo courtesy of Professor G. Lorenzini (University of Pisa, Italy), kindly
     bar = 20 µm. Photo courtesy of Professor G. Lorenzini (University of Pisa, Italy), kindly acknowledged.
      acknowledged.
     The World Health Organization has established that the maximum tolerable limits of PM10 and
       The World Health Organization has established that the maximum tolerable limits of PM10         10 and
PM2.5 must not exceed an annual average of 20 and 10 µg m−3 of air, respectively; and 50 and 25 µg         m−3
 PM2.5
     2.5 must not exceed an annual average of 20 and 10 µg m−3 of air, respectively; and 50 and 25 µg
                                                                    −3
of air in 24 h, respectively. In the European Union and in Italy, the limits are as follows (Legislative
 m−3
   −3 of air in 24 h, respectively. In the European Union and in Italy, the limits are as follows
Decree 155 of 13/8/2010 and EU Directive 2008/50/EC):
 (Legislative Decree 155 of 13/8/2010 and EU Directive 2008/50/EC):
•    PM10 : 40 µg m−3 not to be exceeded as annual mean; and 50 µg µg m−3 not to be exceeded more
 • thanPM10  35
            10: 40times
                    µg mper  year
                         −3 not
                         −3     toasbedaily mean.as annual mean; and 50 µg µg m−3
                                       exceeded                                   −3 not to be exceeded more

•    PMthan   :3525times
                    µg m −3 not
                         per  year
                                 toas
                                    be daily mean.
                                        exceeded as annual mean, with  the aim of not exceeding 20 µg m−3 as
          2.5
 • an  PM   2.5: 25 µg
         annual
           2.5          m starting
                     mean−3
                         −3 not to befrom
                                       exceeded  as annual
                                           1 January 2020. mean, with the aim of not exceeding 20 µg m−3  −3 as

       an annual mean starting from 1 January 2020.
Challenges 2020, 11, x FOR PEER REVIEW 5 of 12
Challenges 2020, 11, 6 5 of 12
3. Particulate Matter has Very Negative Effects on Environmental and Human Health
3. Particulate
Given the Matterabove, basedhas Very on Negative Effects onthe
current legislation, Environmental
overall situation and in Human Health
Italy (particularly in the
Po Valley) is far from reassuring, because the legal limits are frequently
Given the above, based on current legislation, the overall situation in Italy (particularly in the exceeded, sometimes
constantly
Po Valley) in autumn/winter.
is far from reassuring, The UnitedtheNations
because Environmental
legal limits are frequently Program
exceeded, predicts
sometimes that constantly
from 2020in
the number of deaths
autumn/winter. The Unitedin theNations
world Environmental
from air pollution Programcould exceed
predicts that8 from
million2020(whilst in 2001
the number they
of deaths
numbered around 3 million). Unfortunately, little or nothing is known
in the world from air pollution could exceed 8 million (whilst in 2001 they numbered around 3 million). about fine, ultrafine, and
nanoparticles,
Unfortunately,although they canisinknown
little or nothing fact have
abouta devastating
fine, ultrafine, impact
and on human health
nanoparticles, [4–7]. However,
although they can in
one thing is clear: fine, ultrafine, and nanoparticles are like gases, and
fact have a devastating impact on human health [4–7]. However, one thing is clear: fine, ultrafine, and tend to remain in suspension
almost indefinitely.
nanoparticles are like Simply
gases, put, a particle
and tend to remainwithinasuspension
diameter half almost thatindefinitely.
of another,Simply settlesput,
four times
a particle
slower
with a than
diameterthe half
first.that
Indeed, the smaller
of another, the times
settles four particles,
slower the deeper
than theyIndeed,
the first. penetrate tissuesthe
the smaller and cells
particles,
(even in our lungs), causing serious damage and/or carrying toxic
the deeper they penetrate tissues and cells (even in our lungs), causing serious damage and/or carrying substances, spores, viruses,
bacteria [8–13], and
toxic substances, in general
spores, viruses,anything that should
bacteria [8–13], and innot normally
general anything enter theshould
that body.not One significant
normally enter
example is cadmium oxide (CdO), a constituent of particulate matter that
the body. One significant example is cadmium oxide (CdO), a constituent of particulate matter that has has been associated with a
2.5-fold increase in the risk of chronic obstructive pulmonary disease
been associated with a 2.5-fold increase in the risk of chronic obstructive pulmonary disease [14]. [14].
InInthis
thisregard,
regard,we weshould
shouldbearbearininmind
mindone oneserious
seriousissueissueasasregards
regardsindices
indicescodedcodedby bylaw lawfor for
measuring the atmospheric particulate matter. For many years now,
measuring the atmospheric particulate matter. For many years now, it has been a given that 1000 it has been a given that 1000
atmospheric
atmosphericparticles
particles of of 11 µmµm(and,
(and,what
whatisiseveneven more
more serious,
serious, oneone million
million particles
particles fromfrom
100 nm) 100 weigh
nm)
weigh
as much as much as a 10
as a single single 10 µm particle
µm particle [15]. However,
[15]. However, as Dr. Stefanoas Dr. Stefano Montanari
Montanari correctly points correctly points
out, “the law
out, “the law makes no difference between a large particle and a million
makes no difference between a large particle and a million small particles. For science, however, the small particles. For science,
however,
differencethe differenceThe
is immense. is immense.
absurd paradoxThe absurd
is that we paradox
could is that we
breathe could
air that breathe airclean
is “officially” that (i.e.,
is
“officially”
polluted below clean the(i.e.,law
polluted
limits),below
but inthe
factlaw limits), but
composed in fact composed
of thousands of thousands
of particles that have of particles
a potentially
that have a potentially devastating impact on our lungs, our blood
devastating impact on our lungs, our blood and our health” [15]. As a result, current legal limits and our health” [15]. As a result,
are by
current
no means legal limits arethat
a guarantee bythenoparticulates
means a guarantee that the
have little impact onparticulates
the environment haveorlittle
indeedimpact
on ouronbodies.the
environment or indeed on our bodies.
One notable feature of all particulates is that they can convey (and release) toxic molecules
Onemicroorganisms
and/or notable feature and/or of all particulates
spores and/or is that
viralthey can convey
particles, (and These
etc. [8–13]. release) toxic molecules
components can be
and/or microorganisms and/or spores and/or viral particles, etc.
absorbed or adsorbed by the particulate particles, depending on whether they enter them (where [8–13]. These components can be
absorbed or adsorbed by the particulate particles, depending on whether
they are potentially solubilized), or whether they bind to the external surface. Moreover, the particles they enter them (where
they
canarebe potentially
broken, thus solubilized),
multiplying ortheir
whether they bind
polluting andto the external
carrying power. surface. Moreover,
Particulate the especially
matter, particles
can be broken, thus multiplying
fine/ultrafine/nanoparticles, their polluting
can enter the bronchi andandcarrying
the lungpower.alveoliParticulate
(Figure 5) as matter,
well as especially
the blood
fine/ultrafine/nanoparticles,
(both plasma and erythrocytes), the coronary arteries, the heart, the lymphatic system, and,the
can enter the bronchi and the lung alveoli (Figure 5) as well as blood
ultimately,
(both
almost plasma and erythrocytes),
all organs, with serious orthe very coronary
serious arteries,
consequences the heart,
for healththe lymphatic system, and/or
(e.g., carcinogenic and,
ultimately, almost all organs, with serious or very serious consequences for
teratogenic effects). Last but not least, the smallest particles can enter the cell nucleus and target DNA, health (e.g., carcinogenic
and/or teratogenicresults
with devastating effects). Last but not least, the smallest particles can enter the cell nucleus and
[16].
target DNA, with devastating results [16].
Figure 5. The particulate matter of various sizes can penetrate the respiratory tract, in some cases up to
the pulmonary
Figure alveoli. matter of various sizes can penetrate the respiratory tract, in some cases up
5. The particulate
to the pulmonary alveoli.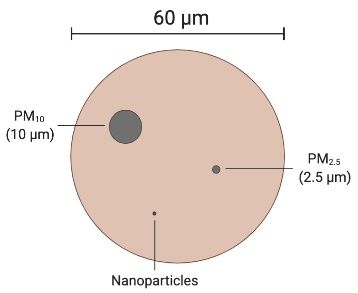
Challenges 2020, 11, 6                                                                               6 of 12

      As long ago as 1997–2001, official studies carried out by the Environmental Protection Agency
of Italy’s Emilia-Romagna region (in the March–April 2020 “red zone”, due to the novel coronavirus
spread) stated that “the qualitative and quantitative differences of the mutagenic effects found in
samples of atmospheric particulate taken at different points of the network, as well as on the same
site at different times, underline how urban atmospheric particulate matter is a complex mixture of
mutagenic substances in continuous evolution, following changes in pressure factors and sources
of pollutants, the influence of weather-climate conditions, place, seasonality, etc. The evidence of
biological activity and the presence of ultrafine particles, above all PM2.5 , poses an important risk
factor for the health of citizens; it is therefore necessary to commit resources to primary prevention,
particularly for long-term health effects, as a consequence of exposure to the finest particles”. The above
was published in a report by Dr. Francesca Cassoni back in August 2002. What has changed in the
intervening decades? Almost nothing, unfortunately.

4. Particulate Matter Causes Severe Diseases, but Drastic Measures to Reduce It have yet to
be Taken
      Taking all the above into account, we reach here the core of the whole issue: authoritative
international publications have correlated atmospheric particulate matter with increased incidence of
human diseases, including viral ones. In particular, lung diseases are significantly affected by the level
of contamination in the atmosphere.
      Italy’s Po Valley is doubtless one of the most polluted areas in the world [2,3]. Alarmingly, in this
area, atmospheric particulate levels are comparable with those found in the Chinese metropolises, such
as Wuhan (Central-Eastern China, over 6 million inhabitants). Of course, we are not presenting here
a simplistic argument that deterioration of the environment is the only cause of the increase in viral
diseases, in this case, of viruses associated with respiratory infections such as the novel coronavirus,
but we are very inclined to believe that it is a significant contributing cause.
      We examined authoritative scientific literature in the world’s leading databases. By way
of example, this included an interesting publication entitled: “PM10 exposure is associated with
increased hospitalizations for respiratory syncytial virus bronchiolitis among infants in Lombardy,
Italy” [17]. This viral disease affecting children can become very severe and therefore require immediate
hospitalization. The aforementioned scientists write that “exposure to environmental factors (e.g.,
air pollution) could influence the immune system and compromise its ability to limit the spread of
infectious agents”, as is the case with the virus they studied. In addition, they add, “Exposure to air
pollution is related to the worsening of respiratory diseases in adults and children”, along the same
lines of the findings reported by Jo et al. [18] in relation to Korea (also badly affected by the novel
coronavirus). Carugno and et al. [17] conclude that the concentration of PM10 in Lombardy, Italy, in the
two weeks preceding hospitalization was strongly associated with an increased risk of hospitalization
for the viral pathology they studied. This general conclusion is also supported by research carried out
by various groups in Israel, Chile, Canada, Australia, and New Zealand, to name a few [19–22].
      Another distinguished study carried out in China on over 36,000 children (city of Hangzhou,
over 6 million inhabitants, Eastern China), reveals a positive correlation between infection with
respiratory syncytial virus and atmospheric levels of PM2.5 and PM10 (almost systematically above the
limits imposed by the World Health Organization); conversely, there is a negative correlation with
temperature [23]. This means that higher temperatures have led to a decrease in the infection rate.
Within the framework of the research, the most critical situation arose below 9 ◦ C, while there was a
marked improvement in health where temperatures were upwards of 20 ◦ C. Essentially, similar results
have been found by a number of studies conducted worldwide. In fact, dozens of experimental works
published in international scientific journals have highlighted the close link between the level of air
pollution and the incidence of respiratory diseases (including viral ones). They include Gordon et al.,
2014; Liang et al., 2014; Walton et al., 2010; and Xu et al., 2013, to name a few [4,24–26].
Challenges 2020, 11, 6 7 of 12
In this regard, some scientists believe that the oxidative stress caused by air pollution, and in
particular by particulate matter, may have negative effects on immune responses by interfering with
the body’s antiviral defenses. Some studies actually support the theory that exposure to atmospheric
pollutants can in fact (1) reduce the ability of macrophages to phagocytize pathogens, even viral ones;
and (2) decrease the expression or activity of particular protective proteins against viral infections [10].
A large number of epidemiological studies conducted worldwide have found a clear link between
air pollution levels and hospitalization for various diseases, particularly of a respiratory kind, as well as
greater associated morbidity and mortality. Viral respiratory infections can be caused by over 200 different
viruses, including rhinovirus, respiratory syncytial virus, influenza and parainfluenza virus, coronavirus,
and adenovirus [27]. Unfortunately, regulations concerning microbial air contamination are lacking.
As regards the “novel coronavirus” (SARS-CoV-2), which causes the current COVID-19 disease
(an acronym of COronaVIrus Disease), Conticini et al. (2020) [28] showed that atmospheric pollution
can be considered a co-factor contributing to the extremely high level of lethality currently occurring in
Northern Italy. Of course, it is not easy to discern between the rate of novel coronavirus spread in the
population versus frequency of severe cases, as data in authoritative literature have been almost absent
until now. However, Wu et al. (2020) [29] have demonstrated a large overlap between cause of death in
COVID-19 patients and long-term exposure to PM2.5 . In particular, these authors state that an increase of
just 1 µg m−3 in PM2.5 is associated with a 15% increase in the COVID-19 death rate. In addition, correctly,
they conclude, “The study results underscore the importance of continuing to enforce existing air
pollution regulations to protect human health, both during and after the COVID-19 crisis”. In addition,
Yao et al. (2020) [30] found in 49 Chinese cities (including Wuhan) that COVID-19 death rates in
winter 2020 were higher where concentrations of PM2.5–10 were greater, possibly affecting the outcome
for patients with mild to severe symptoms, and influencing the prognosis of COVID-19 patients.
Also Martelletti and Martelletti (2020) [31] postulated a correlation between elevated concentrations of
PM and the high spread and mortality rate of the novel coronavirus in Italy.
5. Atmospheric Particulate Acts as a Carrier for Viruses, and might also Have Promoted the
Spread of the Novel Coronavirus
The novel coronavirus (SARS-CoV-2), which has a diameter of 60–140 nm, is highly contagious,
and spreads through respiratory droplets and/or direct contact. In general, temperature and humidity
are known factors affecting the diffusion of viral diseases; in fact, it is no coincidence that many
respiratory viruses become particularly active in autumn and winter (see above). Interestingly, very
recent studies hypothesized significant SARS-CoV-2 spread in cities and areas following a narrow
east-to-west corridor; this roughly corresponds with the 30–50◦ Northern latitude, characterized by
average daily temperatures of 5–11 ◦ C [32]. Another factor that might promote the spread of this and
other pathogens is overcrowding and movement of large numbers of individuals at a given time in
limited spaces, such as in cities or other highly populated areas.
Besides all that, both in Milan (Italy) and in Wuhan (China), the levels of atmospheric particulate
matter have greatly and constantly exceeded legal limits. Indeed, preliminary studies conducted by
research groups headed by Bologna University and the “A. Moro” University of Bari, Italy, together
with the Italian Society of Environmental Medicine (SIMA) have resulted in the publication of an
interesting “position paper” offering strong support to the possible correlations between atmospheric
particulate matter and the spread of coronavirus among the population [33]. The researchers have in
fact highlighted “a relationship between the exceedances of the legal limits of PM10 concentrations
recorded in the period 10–29 February 2020, and the number of cases infected with COVID-19 updated
to 3 March 2020”. In particular, their paper stresses the direct relationship (R2 = 0.98) between the
number of COVID-19 cases and the PM10 pollution status of each Italian province. To this end, the
authors state, “The expansion curves of the infection show anomalous accelerations precisely in the
regions located in the Po Valley, where the outbreaks are particularly virulent, and reasonably suggest
a carrier-mediated spread. These analyses seem therefore to demonstrate that, in relation to the periodChallenges 2020, 11, 6 8 of 12
10–29 February, high concentrations above the PM10 limit in some provinces of Northern Italy8may
Challenges 2020, 11, x FOR PEER REVIEW of 12
have exerted an impulse to the virulent spread of the epidemic in the Po Valley, which was not observed
in
notother areas in
observed of other
Italy that had
areas of cases of contagion
Italy that had casesinof
the same period.
contagion in theInsame
this regard,
period.the caseregard,
In this of Romethe is
emblematic in which the presence of contagions was manifested in the same days
case of Rome is emblematic in which the presence of contagions was manifested in the same days as as the Po regions
without, however,without,
the Po regions triggering such a virulent
however, phenomenon”.
triggering Essentially,
such a virulent the atmospheric
phenomenon”. particulate
Essentially, the
may have acted (and indeed might continue to act) as a carrier of the virus, increasing
atmospheric particulate may have acted (and indeed might continue to act) as a carrier of the virus, its spread
(Figure
increasing6). its spread (Figure 6).
Figure 6. Particulate matter may act as a virus-carrier, and might therefore have contributed to the spread
Figure
of 6. Particulate
the novel matter
coronavirus may act
in highly as a virus-carrier,
polluted environmentsand might
such therefore
as the have
Po Valley contributed
in Italy and Wuhanto the
in
spread Modified
China. of the novel
fromcoronavirus
CC BY-NCin highly
2.0, imagepolluted
created environments such as
by Daniel Lovquist, the Po
kindly Valley in Italy and
acknowledged.
Wuhan in China. Modified from CC BY-NC 2.0, image created by Daniel Lovquist, kindly
In the period 10–29 February 2020, in the city of Milan alone, PM10 values actually reached peaks
acknowledged.
of 70–80 µg m−3 (the legal limit is µg m−3 ), while in the second half of January, at least two peaks of
aboutIn90 the m−3 were
µgperiod 10–29recorded.
February Following
2020, in thethere
city of
is Milan alone, PM10information
some additional values actually reached
on PM peaks
10 levels in
of 70–80
Milan µg from:
(data m−3 (the legal limit is µg m−3), while in the second half of January, at least two peaks of
www.arpalombardia.it):
about 90 µg m−3 were recorded. Following there is some additional information on PM10 levels in
MilanDaily
1. (dataaverage for January 2020: 67.2 µg m−3 (minimum value 34 and maximum value 131): daily
from: www.arpalombardia.it):
limit exceeded 23 times.
1.
2. Daily
Daily average
average for
for January
February2020:
2020:67.2
45.2µgµgmm−3
−3 (minimum value 34 and maximum value 131): daily
(minimum value 13 and maximum value 81): daily
limit
limit exceeded
exceeded 2311 times.
times, and in particular 7 times in the 14 days preceding the start of the rapid
2. Daily average
increase for February
in infections 2020: 45.2 µg m−3 (minimum value 13 and maximum value 81): daily
in Lombardy.
limit exceeded 11 times, and in particular 7 times in the 14 days preceding the start of the rapid
3. In the same time period as above, PM2.5 stood at 40–50 µg m−3 (the legal limit being 25 µg m−3 ),
increase in infections in Lombardy.
while in the second half of January there were 2–3 peaks of up to 70 µg m−3 , making for a highly
3. In the same time period as above, PM2.5 stood at 40–50 µg m−3 (the legal limit being 25 µg m−3),
compromised situation.
while in the second half of January there were 2–3 peaks of up to 70 µg m−3, making for a highly
compromised
Likewise, situation.
Wuhan, where the outbreak preceded the one in Italy by about a month, PM10 peaks
reached 120–130 µg m , whereas in the same dataset, PM2.5 displayed peaks of 100 µg m−3 .
−3
Likewise, Wuhan, where the outbreak preceded the one in Italy by about a month, PM10 peaks
Thus, it is possible to make the assumption that particulate matter acts as a direct carrier for
reached 120–130 µg m−3, whereas in the same dataset, PM2.5 displayed peaks of 100 µg m−3.
the novel coronavirus. “The finer the particles,” says Gianluigi de Gennaro of the University of Bari
Thus, it is possible to make the assumption that particulate matter acts as a direct carrier for the
“the more highways are created for infections. It is necessary to reduce emissions to a minimum”.
novel coronavirus. “The finer the particles,” says Gianluigi de Gennaro of the University of Bari “the
Concerning this, despite the current shortage of data showing that COVID-19 is “piggybacking” on
more highways are created for infections. It is necessary to reduce emissions to a minimum”.
air particulate matter, the assumption that air pollution facilitates the spread of different viruses was
Concerning this, despite the current shortage of data showing that COVID-19 is “piggybacking” on
already shown by Cui et al. (2003) [34] during the SARS-CoV-1 outbreak in China in November 2002.
air particulate matter, the assumption that air pollution facilitates the spread of different viruses was
According to this research, the five areas under investigation (Guangdong, Shanxi, Hebei, Beijing, and
already shown by Cui et al. (2003) [34] during the SARS-CoV-1 outbreak in China in November 2002.
Tianjin) presented a linear relationship between air pollution and fatality rate due to SARS. In this case,
According to this research, the five areas under investigation (Guangdong, Shanxi, Hebei, Beijing,
the lower the air pollution, the lower the mortality rate.
and Tianjin) presented a linear relationship between air pollution and fatality rate due to SARS. In
this case, the lower the air pollution, the lower the mortality rate.
In fact, even animal viruses, which spread with ease in intensive farming, can be carried through
the atmospheric particulate matter. By way of example, airborne transmission played a major role in
the diffusion of the highly pathogenic avian influenza in the USA in 2015 [35].Challenges 2020, 11, 6 9 of 12
In fact, even animal viruses, which spread with ease in intensive farming, can be carried through
the atmospheric particulate matter. By way of example, airborne transmission played a major role in
the diffusion of the highly pathogenic avian influenza in the USA in 2015 [35].
Interestingly, Reche et al. (2018) [36] quantified the wet and dry deposition rates of free and
attached viruses and bacteria in Spain (in areas located approximately 50 km southeast of Granada),
demonstrating that billions of viruses per m2 were deposited each day. Virus deposition rates were
9–461 times greater than bacteria rates, and positively correlated with organic aerosolsChallenges 2020, 11, 6 10 of 12
Table 1. First two columns: total COVID-19-positive cases (including recovered patients and deceased)
in the time range 24 February–17 April 2020 and total population officially residing in each Italian
region on 31 December 2019. Third column: COVID-19-positive cases per region/total residents per
region. In red: Northern regions (NB: Piedmont, Lombardy, Emilia-Romagna, Veneto, Friuli-Venezia
Giulia partly make up the Po Valley), in fuchsia: Central regions; in yellow: Southern/Island Regions.
COVID-19-Positive
COVID-19-Positive Cases per
Cases per Region Total Residents per
Italian Regions Region/Total Residents per Region
(From 24 February Region
(From 27 February 2020—17 April 2020)
2020—17 April 2020)
Lombardy 64,135 10,060,574 0.64%
Trentino Alto-Adige 5672 1,072,276 0.53%
Emilia-Romagna 21,834 4,459,477 0.49%
Piedmont and Valle d’Aosta 20,796 4,482,072 0.46%
Liguria 6188 1,550,640 0.40%
Veneto 15,374 4,905,854 0.31%
Marche 5668 1,525,271 0.27%
Friuli-Venezia Giulia 2675 1,215,220 0.23%
Tuscany 8110 3,729,641 0.22%
Abruzzo 2443 1,311,580 0.19%
Umbria 1337 882,015 0.15%
Lazio 5524 5,879,082 0.094%
Molise 269 305,617 0.088%
Puglia 3327 4,029,053 0.083%
Sardinia 1178 1,639,591 0.072%
Campania 3951 5,801,692 0.068%
Basilicata 337 562,869 0.060%
Sicily 2625 4,999,891 0.052%
Calabria 991 1,947,131 0.051%
Data from the Italian Department of Civil Protection: http://opendatadpc.maps.arcgis.com; and from ISTAT, Italian
National Institute of Statistics http://dati.istat.it/. NB: for the resident population, more recent official data after
31 December 2019 were not available at the time of writing this paper.
6. Conclusions
The Acting Secretary General of the European Public Health Alliance (EPHA) has declared:
“The air may be clearing in Italy, but the damage has already been done to human health and people’s
ability to fight off infection. Governments should have tackled chronic air pollution long ago, but have
prioritised the economy over health. Science tells us that epidemics like COVID-19 will occur with
increasing frequency. So, cleaning up the streets is a basic investment for a healthier future”. Indeed,
administrators and governments must view potential interactions between exposure to pollutants
(not only particulate matter, but also other solid, liquid, and gaseous contaminants) and the onset
of pathologies (including those generated by respiratory viruses) as a tangible risk. The hypothesis
that the novel coronavirus might exploit the “highways” made up of atmospheric particulates is
a challenging point that, in our opinion, deserves further, immediate, and in-depth experimental
investigations. It is to be hoped that steps will be taken promptly to clarify the dynamics involved in
the current pandemic. However, above all, far-sighted measures are urgently needed to reduce air,
water, and soil pollution drastically. The environment around us and our health demand it.
Author Contributions: Conceptualization, data curation, writing, and original draft preparation: L.S.d.T.
(Luigi Sanità di Toppi), L.S.d.T. (Lorenzo Sanità di Toppi), and E.B. All authors have read and agreed to the
published version of the manuscript.
Conflicts of Interest: The authors declare no conflict of interest.
References
1. Cislaghi, C.; Nimis, P.L. Lichens, air pollution and lung cancer. Nature 1997, 387, 464. [CrossRef] [PubMed]
2. European Environment Agency; European Topic Centre on Air Pollution and Climate Change Mitigation
(ETC/ACM). Air Quality in Europe: 2017 Report; European Environment Agency: København, Denmark, 2017.Challenges 2020, 11, 6 11 of 12
3. Van Donkelaar, A.; Martin, R.V.; Brauer, M.; Kahn, R.; Levy, R.; Verduzco, C.; Villeneuve, P.J. Global Estimates
of Ambient Fine Particulate Matter Concentrations from Satellite-Based Aerosol Optical Depth: Development
and Application. Environ. Health Perspect. 2010, 118, 847–855. [CrossRef] [PubMed]
4. Gordon, S.B.; Bruce, N.G.; Grigg, J.; Hibberd, P.L.; Kurmi, O.P.; Lam, K.H.; Mortimer, K.; Asante, K.P.;
Balakrishnan, K.; Balmes, J.; et al. Respiratory risks from household air pollution in low and middle income
countries. Lancet Respir. Med. 2014, 2, 823–860. [CrossRef]
5. Tellabati, A.; Fernandes, V.E.; Teichert, F.; Singh, R.; Rylance, J.; Gordon, S.; Andrew, P.W.; Grigg, J. Acute
exposure of mice to high-dose ultrafine carbon black decreases susceptibility to pneumococcal pneumonia.
Part. Fibre Toxicol. 2010, 7, 30. [CrossRef]
6. Chen, R.; Hu, B.; Liu, Y.; Xu, J.; Yang, G.; Xu, D.; Chen, C. Beyond PM2.5: The role of ultrafine particles
on adverse health effects of air pollution. Biochim. Biophys. Acta (BBA)-Gen. Subj. 2016, 1860, 2844–2855.
[CrossRef]
7. Stone, V.; Johnston, H.; Clift, M.J.D. Air Pollution, Ultrafine and Nanoparticle Toxicology: Cellular and
Molecular Interactions. IEEE Trans. Nanobiosci. 2007, 6, 331–340. [CrossRef]
8. Xia, T.; Korge, P.; Weiss, J.N.; Li, N.; Venkatesen, M.I.; Sioutas, C.; Nel, A. Quinones and Aromatic Chemical
Compounds in Particulate Matter Induce Mitochondrial Dysfunction: Implications for Ultrafine Particle
Toxicity. Environ. Health Perspect. 2004, 112, 1347–1358. [CrossRef]
9. Asgharian, B.; Price, O.T. Deposition of Ultrafine (NANO) Particles in the Human Lung. Inhal. Toxicol. 2007,
19, 1045–1054. [CrossRef]
10. Ciencewicki, J.; Jaspers, I. Air Pollution and Respiratory Viral Infection. Inhal. Toxicol. 2007, 19, 1135–1146.
[CrossRef]
11. Kreyling, W.G. Nanoparticles in the lung. Nat. Biotechnol. 2010, 28, 1275–1276. [CrossRef]
12. Dumkova, J.; Vrlikova, L.; Vecera, Z.; Putnova, B.; Docekal, B.; Mikuska, P.; Fictum, P.; Hampl, A.; Buchtova, M.
Inhaled Cadmium Oxide Nanoparticles: Their in Vivo Fate and Effect on Target Organs. IJMS 2016, 17, 874.
[CrossRef]
13. Onat, B.; Alver Şahin, Ü.; Sivri, N. The relationship between particle and culturable airborne bacteria
concentrations in public transportation. Indoor Built Environ. 2017, 26, 1420–1428. [CrossRef]
14. Rokadia, H.K.; Agarwal, S. Serum Heavy Metals and Obstructive Lung Disease: Results from the National
Health and Nutrition Examination Survey. Chest 2013, 143, 388–397. [CrossRef] [PubMed]
15. Montanari, S. L’insidia Delle Polveri Sottili e Delle Nanoparticelle; Macroedizioni: Cesena, Italy, 2007;
ISBN 978-88-7507-849-2.
16. Kim, K.-H.; Kabir, E.; Kabir, S. A review on the human health impact of airborne particulate matter.
Environ. Int. 2015, 74, 136–143. [CrossRef] [PubMed]
17. Carugno, M.; Dentali, F.; Mathieu, G.; Fontanella, A.; Mariani, J.; Bordini, L.; Milani, G.P.; Consonni, D.;
Bonzini, M.; Bollati, V.; et al. PM10 exposure is associated with increased hospitalizations for respiratory
syncytial virus bronchiolitis among infants in Lombardy, Italy. Environ. Res. 2018, 166, 452–457. [CrossRef]
[PubMed]
18. Jo, E.-J.; Lee, W.-S.; Jo, H.-Y.; Kim, C.-H.; Eom, J.-S.; Mok, J.-H.; Kim, M.-H.; Lee, K.; Kim, K.-U.; Lee, M.-K.;
et al. Effects of particulate matter on respiratory disease and the impact of meteorological factors in Busan,
Korea. Respir. Med. 2017, 124, 79–87. [CrossRef] [PubMed]
19. Yitshak-Sade, M.; Yudovitch, D.; Novack, V.; Tal, A.; Kloog, I.; Goldbart, A. Air Pollution and Hospitalization
for Bronchiolitis among Young Children. Ann. ATS 2017, 14, 1796–1802. [CrossRef]
20. Pino, P.; Walter, T.; Oyarzun, M.; Villegas, R.; Romieu, I. Fine Particulate Matter and Wheezing Illnesses in
the First Year of Life. Epidemiology 2004, 15, 702–708. [CrossRef]
21. Barnett, A.G.; Williams, G.M.; Schwartz, J.; Neller, A.H.; Best, T.L.; Petroeschevsky, A.L.; Simpson, R.W.
Air Pollution and Child Respiratory Health: A Case-Crossover Study in Australia and New Zealand. Am. J.
Respir. Crit. Care Med. 2005, 171, 1272–1278. [CrossRef]
22. Lin, M.; Stieb, D.M.; Chen, Y. Coarse Particulate Matter and Hospitalization for Respiratory Infections in
Children Younger Than 15 Years in Toronto: A Case-Crossover Analysis. Pediatrics 2005, 116, e235–e240.
[CrossRef]
23. Ye, Q.; Fu, J.; Mao, J.; Shang, S. Haze is a risk factor contributing to the rapid spread of respiratory syncytial
virus in children. Environ. Sci. Pollut. Res. 2016, 23, 20178–20185. [CrossRef] [PubMed]Challenges 2020, 11, 6 12 of 12
24. Liang, Y.; Fang, L.; Pan, H.; Zhang, K.; Kan, H.; Brook, J.R.; Sun, Q. PM2.5 in Beijing—Temporal pattern and
its association with influenza. Environ. Health 2014, 13, 102. [CrossRef] [PubMed]
25. Walton, N.A.; Poynton, M.R.; Gesteland, P.H.; Maloney, C.; Staes, C.; Facelli, J.C. Predicting the start week of
respiratory syncytial virus outbreaks using real time weather variables. BMC Med. Inform. Decis. Mak. 2010,
10, 68. [CrossRef] [PubMed]
26. Xu, Z.; Hu, W.; Williams, G.; Clements, A.C.A.; Kan, H.; Tong, S. Air pollution, temperature and pediatric
influenza in Brisbane, Australia. Environ. Int. 2013, 59, 384–388. [CrossRef]
27. Dasaraju, P.V.; Liu, C. Infections of the Respiratory System. In Medical Microbiology; Baron, S., Ed.; University
of Texas Medical Branch at Galveston: Galveston, TX, USA, 1996; ISBN 978-0-9631172-1-2.
28. Conticini, E.; Frediani, B.; Caro, D. Can atmospheric pollution be considered a co-factor in extremely high
level of SARS-CoV-2 lethality in Northern Italy? Environ. Pollut. 2020, 114465. [CrossRef]
29. Wu, X.; Nethery, R.C.; Sabath, B.M.; Braun, D.; Dominici, F. Exposure to Air Pollution and COVID-19
Mortality in the United States. medRxiv 2020. [CrossRef]
30. Yao, Y.; Pan, J.; Wang, W.; Liu, Z.; Kan, H.; Meng, X.; Wang, W. Spatial Correlation of Particulate Matter
Pollution and Death Rate of COVID-19. medRxiv 2020. [CrossRef]
31. Martelletti, L.; Martelletti, P. Air Pollution and the Novel Covid-19 Disease: A Putative Disease Risk Factor.
SN Compr. Clin. Med. 2020. [CrossRef]
32. Sajadi, M.M.; Habibzadeh, P.; Vintzileos, A.; Shokouhi, S.; Miralles-Wilhelm, F.; Amoroso, A. Temperature,
Humidity and Latitude Analysis to Predict Potential Spread and Seasonality for COVID-19. 2020. Available
online: https://papers.ssrn.com/sol3/papers.cfm?abstract_id=3550308 (accessed on 28 April 2020). [CrossRef]
33. Setti, L.; Passarini, F.; de Gennaro, G.; Di Gilio, A.; Palmisani, J.; Buono, P.; Fornari, G.; Perrone, M.G.;
Piazzalunga, A.; Barbieri, P.; et al. Relazione Circa L’effetto Dell’inquinamento da Particolato Atmosferico
e la Diffusione di Virus Nella Popolazione. Position Paper. 2020. Available online: file:///C:/Users/Utente/
Desktop/coronavirus/position%20paper.pdf (accessed on 10 March 2020).
34. Cui, Y.; Zhang, Z.-F.; Froines, J.; Zhao, J.; Wang, H.; Yu, S.-Z.; Detels, R. Air pollution and case fatality of
SARS in the People’s Republic of China: An ecologic study. Environ. Health 2003, 2, 15. [CrossRef]
35. Zhao, Y.; Richardson, B.; Takle, E.; Chai, L.; Schmitt, D.; Xin, H. Airborne transmission may have played a
role in the spread of 2015 highly pathogenic avian influenza outbreaks in the United States. Sci. Rep. 2019, 9,
11755. [CrossRef]
36. Reche, I.; D’Orta, G.; Mladenov, N.; Winget, D.M.; Suttle, C.A. Deposition rates of viruses and bacteria above
the atmospheric boundary layer. ISME J. 2018, 12, 1154–1162. [CrossRef]
37. Van Doremalen, N.; Bushmaker, T.; Morris, D.; Holbrook, M.; Gamble, A.; Williamson, B.; Tamin, A.;
Harcourt, J.; Thornburg, N.; Gerber, S.; et al. Aerosol and surface stability of HCoV-19 (SARS-CoV-2)
compared to SARS-CoV-1. N. Engl. J. Med. 2020, 382, 16. [CrossRef]
38. Setti, L.; Passarini, F.; Gennaro, G.D.; Barbieri, P.; Perrone, M.G.; Borelli, M.; Palmisani, J.; Gilio, A.D.;
Torboli, V.; Pallavicini, A.; et al. SARS-Cov-2 RNA Found on Particulate Matter of Bergamo in Northern
Italy: First Preliminary Evidence. medRxiv 2020. [CrossRef]
© 2020 by the authors. Licensee MDPI, Basel, Switzerland. This article is an open access
article distributed under the terms and conditions of the Creative Commons Attribution
(CC BY) license (http://creativecommons.org/licenses/by/4.0/).You can also read