NSW MID NORTH COAST FLOOD IMPACT RESEARCH - Steven George, Salome Hussein, Ryan Crompton & Thomas Mortlock
←
→
Page content transcription
If your browser does not render page correctly, please read the page content below

NSW MID NORTH COAST FLOOD
IMPACT RESEARCH

Steven George, Salome Hussein, Ryan Crompton & Thomas Mortlock

Risk Frontiers & Bushfire and Natural Hazards CRC

NSW MID NORTH COAST FLOOD IMPACT RESEARCH | REPORT NO. 659.2021

  Version       Release history                                    Date

  1.0           Initial release of document                        21/04/2021

 © 2021 Bushfire and Natural Hazards CRC

 All material in this document, except as identified below, is licensed under the
 Creative Commons Attribution-Non-Commercial 4.0 International Licence.

 Material not licensed under the Creative Commons licence:
       •     Department of Industry, Science, Energy and Resources logo
       •     Cooperative Research Centres Program logo
       •     Bushfire and Natural Hazards CRC logo
       •     Any other logos
       •     All photographs, graphics and figures

 All content not licenced under the Creative Commons licence is all rights
 reserved. Permission must be sought from the copyright owner to use this
 material.

 Disclaimer:
 Risk Frontiers and the Bushfire and Natural Hazards CRC advise that the
 information contained in this publication comprises general statements based on
 scientific research. The reader is advised and needs to be aware that such
 information may be incomplete or unable to be used in any specific situation. No
 reliance or actions must therefore be made on that information without seeking
 prior expert professional, scientific and technical advice. To the extent permitted
 by law, Risk Frontiers and the Bushfire and Natural Hazards CRC (including its
 employees and consultants) exclude all liability to any person for any
 consequences, including but not limited to all losses, damages, costs, expenses
 and any other compensation, arising directly or indirectly from using this
 publication (in part or in whole) and any information or material contained in it.

 Publisher:
 Bushfire and Natural Hazards CRC

 April 2021

 Citation: George S, Hussein S, Crompton R & Mortlock T (2021) NSW Mid North
 Coast flood impact research, Bushfire and Natural Hazards CRC, Melbourne.

 Cover: 20 March 2021, Wingham NSW. Source: Mark Anning

                                                                          1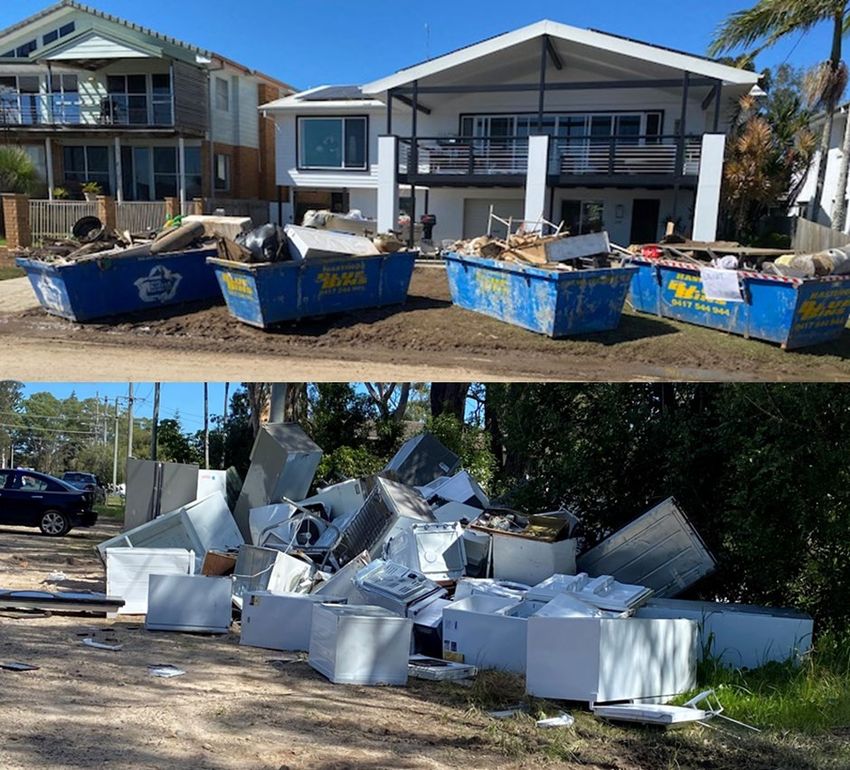
NSW MID NORTH COAST FLOOD IMPACT RESEARCH | REPORT NO. 659.2021

TABLE OF CONTENTS
ACKNOWLEDGEMENT                                                   4

ABSTRACT                                                          5
Overview                                                           5

WEATHER AND FLOODING                                              6
Rainfall analysis                                                  6
Flood depth analysis                                               7

IMPACTS                                                           9
Bulahdelah                                                         9
Taree                                                              9
Wingham                                                            9
Port Macquarie                                                    10
Camden Haven                                                      13

CONCLUSION                                                        15

                                                              3
NSW MID NORTH COAST FLOOD IMPACT RESEARCH | REPORT NO. 659.2021

ACKNOWLEDGEMENT
This field research was supported by the BNHCRC quick response grant.

                                                              4
NSW MID NORTH COAST FLOOD IMPACT RESEARCH | REPORT NO. 659.2021

ABSTRACT
On March 18, 2021, an extreme rainfall event kicked off, resulting in severe
flooding in the Mid North Coast of New South Wales. 18,000 people were
evacuated, including 1,000 flood rescues. Flooding also impacted the North
Coast, Hunter, Western Sydney, South Coast, Central West, and North West
Regions of NSW. Flooding was also experienced in Southeast Queensland. The
focus of this briefing is on flood impacts experienced on the NSW Mid North
Coast.

OVERVIEW
On March 24, Risk Frontiers, with assistance from the BNHCRC, deployed a survey
team to the NSW Mid North Coast region to observe and report on significant
flooding in the area. Areas surveyed included, Bulahdelah, Taree, Wingham, Port
Macquarie, North Haven, Laurieton, and Dunbogan. In addition to measuring
flood depths and recording noteworthy damages to belongings and
infrastructure, the team spoke with residents, business owners, and rescue
personnel (Rural Fire Service, NSW Fire and Rescue, and State Emergency
Services). Discussions covered evacuation, emergency response and
communication, community resilience, and the insurability of their homes.
A couple of key issues emerged during the investigation. The first was insurance
affordability in areas that were clearly at risk of flooding. Some residents and
business owners we spoke with cited quotes for policies covering flood ranging
from $5k - $30k per year. Our survey indicates that the full extent of damage will
not be evident in claims data due to the low rates of insurance as a lot of
individuals had chosen to remain uninsured due to the prohibitive costs quoted
for them. Disaster mitigation needs to be considered in these areas to assist with
insurance affordability.
Another common concern expressed was the lack of warning and mitigative
action. For example, some residents had not considered sandbagging. Residents
claimed they were either misinformed or warned too late, and then felt aspects
of the process to recover were unclear.

                                                              5
NSW MID NORTH COAST FLOOD IMPACT RESEARCH | REPORT NO. 659.2021

WEATHER AND FLOODING
On 18th March 2021, a low pressure trough formed along the eastern seaboard
(Figure 1), causing intense and prolonged rainfall and extensive flooding across
Southeast QLD, coastal and inland NSW and parts of Victoria. The trough was
extensive, covering some 1,200 km of north-south length.
This type of synoptic pattern is not uncommon for this time of year (late
summer/early autumn), but there were two main factors that contributed to the
heightened flood risk. The first was that this event occurred at the end of a wetter-
than-usual summer period driven in part by the La Niña state of the Southwest
Pacific region. The second was the stationarity of this event. Heavy rain persisted
for 4 to 5 days (depending on the location) from the onset of the event on
17th/18th March 2021 through to 22nd March. The trough was held in place by a
blocking high pressure system in the Southern Tasman Sea (seen in Figure 1).

FIGURE 1. SYNOPTIC PATTERN AT 11AM AEST ON 20TH MARCH 2021, SHOWING THE DEVELOPMENT OF THE LOW PRESSURE TROUGH ALONG THE EASTERN
SEABOARD AND THE BLOCKING HIGH PRESSURE SYSTEM IN THE SOUTHERN TASMAN SEA. SOURCE: BOM (2021)

RAINFALL ANALYSIS
Seven-day rainfall totals for the period 17th-23rd March 2021 were obtained for
every BoM gauge in flood-affected regions. In total, 1,487 gauges were
analysed. The 95th percentile of 7-day rain totals for each region was calculated,
and gauges registering values greater than the 95th percentile were run through
the Australian Rainfall and Runoff (AR&R) 2016 data portal to estimate return
periods (Figure 2).

                                                               6
NSW MID NORTH COAST FLOOD IMPACT RESEARCH | REPORT NO. 659.2021

FIGURE 2. RETURN PERIOD ESTIMATES OF RAIN VOLUMES FOR THE MARCH 2021 FLOOD EVENT (REGIONS ORDERED APPROXIMATELY NORTH TO SOUTH).

Results show that while this rain event impacted a large geographic area, there
were some significant regional variations in rain volumes. As shown in Figure 2,
the highest return period estimates and rain volumes were experienced on the
NSW Mid North Coast (~ 500 years) and North West (~ 300 years) regions. The NSW
Central Coast region also experienced return period rainfall at around the 100-
year level. All other regions were at or below the 50-year return period level.
The largest 7-day rain total recorded of almost 1,500 gauges analysed was at
Bellwood (Nambucca Heads), where 1,064 mm of rain (over 1 metre) was
recorded between 17th-23rd March 2021. According to AR&R 2016, this is in
excess of the 2,000-year return period level.

FLOOD DEPTH ANALYSIS
While the rain volumes recorded at some locations were very large - with long
associated return periods - peak water levels (flood depths) recorded at river
gauges did not, in general, equate to comparably long return periods. This
highlights the importance of not using rainfall return periods as proxies for flooding
- there are a number of rainfall-runoff processes that mean the relationship
between rainfall and flood depth is most often not linear.
Flood depths recorded at river gauges were analysed for some of the highest-
impacted areas surveyed: Taree, Wingham, Port Macquarie and Laurieton. The
return periods of the BoM Peak Water Levels were estimated from the SES Greater
Taree City Local Flood Plan (2014) and SES Port Macquarie-Hastings Local Flood
Plan (2015) (Table 1).

                                                               7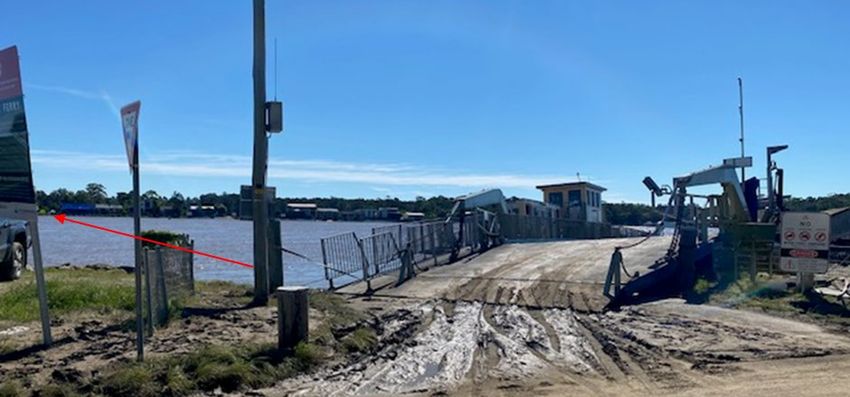
NSW MID NORTH COAST FLOOD IMPACT RESEARCH | REPORT NO. 659.2021

TABLE 1. PEAK WATER LEVEL (FLOOD DEPTH) AND ESTIMATED RETURN PERIOD, FOR A SELECTION OF GAUGES IN AREAS OF RECORDED FLOOD DAMAGE.

 Location/Gauge               Peak Water     Return Period                         Reference              Catchment /
                              Level (m, BoM) (years)                                                      Water Source

 Taree                        5.65                       ~ 100                     SES 2014               Manning
 (Traffic Bridge)                                                                                         River

 Wingham                      14.5            ~ 50                                 SES 2014               Manning
                              (peak value not                                                             River
                              yet verified)

 Settlement Point 1.89                                   ~ 10                      SES 2015               Hastings
 (Port                                                                                                    River
 Macquarie)

 Laurieton                    2.47                       ~ 20                      SES 2015               Camden
                                                                                                          Haven River

As can be seen, return period estimates of river flood depths were, in general,
considerably lower than those estimates obtained from rain gauges.

FIGURE 3. THE MANNING RIVER ADJACENT TO THE TAREE CBD. THE VEGETATION DEBRIS (LEFT) AND WATER HEIGHT (RIGHT) ON THE MARTIN BRIDGE
INDICATE THE FLOOD PEAK.

                                                                8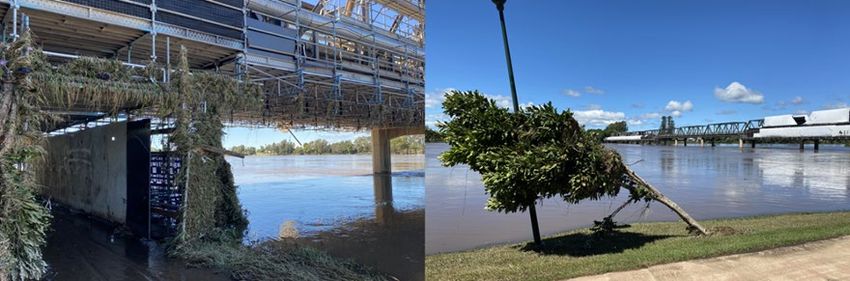
NSW MID NORTH COAST FLOOD IMPACT RESEARCH | REPORT NO. 659.2021

IMPACTS

BULAHDELAH
We visited a holiday accommodation business that experienced only minor
flooding, none of which entered buildings. An employee mentioned that another
holiday business at the end of Bombah Point Road had experienced severe
flooding and much more extensive damage. Bombah Point road was not
accessible at the time and there were other road closures in the area as the
flood water had not receded.

TAREE
Much of the damage in Taree was focused in a portion of the CBD near Brown’s
Creek. Nearby residential areas in lower lying areas, near the old railway, also
experienced significant water levels with belongings piled by the curb for
collection. The Martin Bridge, the main bridge over the Manning River, was
undergoing general maintenance before the storm, but received significant
structural damage at the flood’s peak because of the heavy debris - contractors
repairing the bridge cited a concrete tank, a cargo shipping container, and a
floating house as having collided with the bridge (the final location of this debris
was unknown). A significant amount of mud had been deposited on the banks
of the river and was being cleaned from public walkways and parks near the
bridge. There was seemingly little knowledge or concern about the potential for
the flood water to be contaminated as many children were taking the
opportunity to enjoy the river following several days of rain. The Taree Aquatic
Centre was 75cm underwater and closed, as were a number of businesses near
Brown’s Creek, including an antique furniture store and motorcycle shop.

WINGHAM
The situation in Wingham was much more extreme regarding impact on residents
and the extent of damage. The entrance to Wingham, Chrissy Gollan park, a
local sheltered picnic area, shaped first impressions of the town and the fast, high
flowing water it experienced. The water had raised and carried shelters from their
concrete foundations and scattered them in the area, as well as dislodging
mosaics and plaques from the paved walkways. The waterway at its back,
Cedar Party Creek, also passes around a nearby neighbourhood Mortimer Street.
Homes on this road were submerged past their eaves, with residents being
rescued from their roofs via a neighbour’s boat around 4am. No belongings were
salvageable. The water height inside was at least 61cm higher than the 1978
flood as recalled by a resident on Mortimer Street, who has lived their entire life
there.
In the nearby but higher elevated Appletree Street, a resident shared text
messages from the SES issued at two different times - during the night and early
the following morning. The first communicated minor to moderate flooding and
suggested voluntary evacuation for residents in lower lying areas. A few hours
later, after this resident had already been awoken and alerted by a neighbour
at 2am (and water had already reached shin-deep in their garage), they got

                                                              9
NSW MID NORTH COAST FLOOD IMPACT RESEARCH | REPORT NO. 659.2021

the second message regarding evacuation (around 7am). Sandbags had not
been suggested or offered, and he said up until the first text message, he had no
reason to be concerned, even from watching news bulletins, which had only
indicated there would be severe rain. When evacuation was expressed as being
voluntary, the reason people stayed was because they had animals to manage.
In Wingham’s main street, a retail business had been inundated to 1.75m, losing
all their stock with an estimated value above $1 million. The staff indicated that
the business was not insured. They indicated that there was no warning and this
was worse than the 1978 flood event. A general store, selling produce and
animal feed, also lost all of their stock.
Tinonee Road was still underwater and closed with visible subsidence pictured in
Figure 4. On Farquhar Street, we found examples of how powerful and damaging
the flood waters were with heavy white goods strewn in the grass, many large
scraps from farm buildings, and even an entire caravan wrapped around a tree
(bottom left image of Figure 4). Saplings and shorter trees in the nearby
floodplain were completely bent over, if not uprooted and carried from
elsewhere.

FIGURE 4. POST-FLOODING IMPACTS AT WINGHAM. CHRISSY GOLLAN PARK (TOP). DEBRIS SCATTERED ACROSS THE FLOODPLAIN INCLUDING THIS
CARAVAN WRAPPED AROUND A TREE (BOTTOM LEFT) AND THE CLOSURE OF TINONEE ROAD (BOTTOM RIGHT) DUE TO SUBSIDENCE.

PORT MACQUARIE
Our first stop was in Hibbard Drive and despite land being inundated, early
indications were that the flood was well below the 100-year return period level.
This was based on discussions with residents whose floor level was constructed
10cm above the 100-year level and the flood was substantially below this. We
then travelled to Settlement Point Road, where the flood had impacted houses,

                                                              10
NSW MID NORTH COAST FLOOD IMPACT RESEARCH | REPORT NO. 659.2021
some businesses including a cafe and bed and breakfasts and the ferry (Figure
5). Emergency services and the Australian Defence Force were using shovels,
bobcats and other machinery to move mud and debris, and the entire street
was lined with piles of damaged furniture, spoiled groceries and white goods.
FIGURE 5. THE SETTLEMENT POINT FERRY AGROUND AND FACING ~45° DOWNSTREAM AFTER IT’S STEEL GUIDING CABLES RUPTURED BY THE VELOCITY OF
THE HASTING RIVER FLOW. RED ARROW INDICATES THE FERRY’S USUAL DIRECTION OF TRAVEL AND WHERE THE FERY WAS LOCATED ON THE OPPOSITE
BANK PRIOR TO THE CABLES RUPTURING.
Local residents also expressed major discrepancies between warnings received
and the ultimate outcomes of the storm as it proceeded. One recounted that
after watching how quickly the water was rising, he initially called the SES and
was told the flood would not exceed 1.65m. Not convinced this would be the
case, he phoned the BoM who in turn referred him back to the SES. He then
began photographing flood heights when it surpassed the 2m level on the flood
depth indicator directly across from his property. Figure 6 shows this resident
indicating the peak water height on an external wall just below his power box.
11NSW MID NORTH COAST FLOOD IMPACT RESEARCH | REPORT NO. 659.2021
FIGURE 6. A RESIDENT FROM SETTLEMENT POINT ROAD, PORT MACQUARIE INDICATING THE PEAK WATER LEVEL FROM THE FLOOD ON AN EXTERNAL
WALL OF HIS HOME.
In the CBD, an office supply and consumer electronics business on one side of
Short Street reported water depths as ankle deep (27cm), with an estimated $20-
$40k damage (insured), mainly furniture products. Water entered through the
front door gap and rear dock. The worst affected businesses on the other side of
the street experienced depths almost above the pedestrian curbside rubbish bins
(Figure 7), with a printer and fax shop, a sushi restaurant, and a tobacconist,
losing most of their stock. The maximum water height on the inside of these
businesses ranged from 80cm to 120cm.
12NSW MID NORTH COAST FLOOD IMPACT RESEARCH | REPORT NO. 659.2021
FIGURE 7. WATER LEVEL AT THE SOUTH WEST END OF SHORT STREET, PORT MACQUARIE
CAMDEN HAVEN
The last surveyed townships were Laurieton, Dunbogen, and North Haven along
the Camden Haven River. The damage here was primarily residential, uninsured
and numerous impacted dwellings were older, particularly in North Haven. Some
buildings along Ocean Drive in North Haven saw water depths of ~20cm and
greater depths were experienced in surrounding streets. Both North Haven and
Dunbogan have large caravan parks (with permanent residential sections) and
these suffered significant damage (Figure 8). These towns were reportedly
inundated from multiple directions - from the rain itself (a resident from Kendell’s
rainwater gauge measured 980mm in 5 days), runoff from North Brother Mountain
as well as the surrounding Camden Haven River, Gogleys Lagoon, Queens Lake
and Stingray Creek. Residents on Camden Head Road saw water depths of at
least one metre.
13NSW MID NORTH COAST FLOOD IMPACT RESEARCH | REPORT NO. 659.2021
FIGURE 8. A CARAVAN PARK IN DUNBOGAN IN CLOSE PROXIMITY TO THE INLET THAT HAD BEEN HEAVILY IMPACTED.
14NSW MID NORTH COAST FLOOD IMPACT RESEARCH | REPORT NO. 659.2021
CONCLUSION
The observations from this field study further support the need for flood mitigation
to reduce flood damages and promote insurance affordability. Effective
warning systems are critical to enable communities to reduce damages and
keep people safe. Further study on the effectiveness of flood warnings during this
event and the community response to these warnings in impacted areas is
recommended.
Risk Frontiers has recently undertaken another field trip to survey flood damage
in Western Sydney and the findings will be reported in a follow-up Briefing Note.
FIGURE 9. SKIP BINS FULL OF WATER DAMAGED BELONGINGS (TOP), A COMMON SIGHT THROUGH MANY OF THE SURVEYED NEIGHBOURHOODS. PILES
OF WHITEGOODS SUCH AS FRIDGES, FREEZERS, WASHERS AND DRYERS WERE FREQUENTLY ENCOUNTERED (E.G. NORTH HAVEN, BOTTOM)
15You can also read