NSW ROAD SAFETY STRATEGY 2012-2021 - NSW Centre for ...
←
→
Page content transcription
If your browser does not render page correctly, please read the page content below
NSW ROAD
SAFETY STRATEGY
2012–2021
NSW ROAD SAFETY STRATEGY 2012–2021

    NSW Road Safety Strategy 2012–2021
    December 2012                                  Disclaimer
                                                   While every reasonable effort has been made to
    Copyright notice                               ensure that this document is correct at the time of
    © State of New South Wales through the         printing, the State of NSW, its agents and employees,
    Director General of Transport for NSW, 2012.   disclaim any and all liability to any person in respect
    Transport for NSW                              of anything or the consequences of anything done or
    18 Lee Street                                  omitted to be done in reliance upon the whole or any
    Chippendale NSW 2008                           part of this document.

2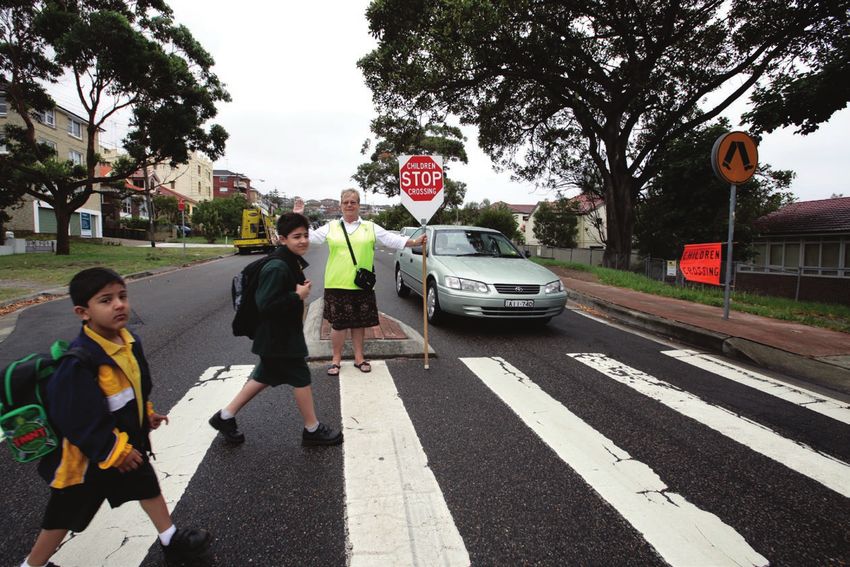
NSW ROAD SAFETY STRATEGY 2012–2021

CONTENTS

  FOREWORD                                  4

1. CONTEXT FOR A NEW ROAD SAFETY STRATEGY    6

2. FATALITY AND INJURY TRENDS                8

3. VISION AND TARGETS                       16

4. KEY CHALLENGES                           18

5. “SAFE SYSTEM” DIRECTIONS                 19

6. SAFE SYSTEM ISSUES AND INITIATIVES       20

7. MANAGING THE STRATEGY                    36

  APPENDIX A – SERIOUS INJURIES             41

  APPENDIX B – GLOSSARY                     42

                                                 3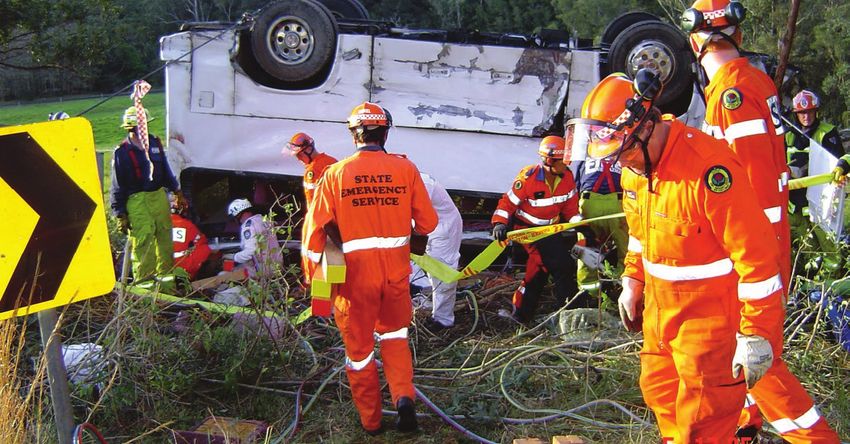
NSW ROAD SAFETY STRATEGY 2012–2021

    FOREWORD

    It is with great pleasure I am able to release the
    NSW Road Safety Strategy 2012-2021. As Minister
    responsible for road safety in NSW, I see and hear
    about the tragic loss of lives on our roads and think
    there is more we can do. And there is.

    We have seen in NSW significant improvements in
    the level of road trauma over the last 30 years. From
    a peak of 1,384 fatalities in 1978, with the lowest road
    toll in 2011 since 1926, of 364 fatalities. While this
    overall performance is significant, road crashes are
    still a leading cause of death for people aged one
    to 44 years in NSW and they cost the community
    around $5.37 billion in 2011. Each year there are
    around 42,000 recorded road crashes in NSW, with           There are many new and exciting road safety
    more than 26,000 injured.                                  developments which the Government will explore
                                                               over the next ten years, including a strong focus
    It is against this background that this new strategy
                                                               on road investment, Local Government and
    has been developed to set out a 10 year direction for
                                                               technologies to deliver road safety improvements.
    road safety in NSW.
                                                               Key initiatives from this strategy include:
    Death or serious injury on NSW roads is
                                                               •• A new Safer Roads program
    unacceptable for the community. As a step towards
    a vision of zero deaths or serious injuries on NSW         •• Continued integrated road safety enforcement
    roads, the NSW Road Safety Strategy 2012-2021 aims         •• Working with Local Government to share road
    to make the roads safer through at least a 30 per            safety information and resources
    cent annual reduction in road deaths and serious
    injuries by the end of 2021.                               •• Increased focus on addressing serious injuries
                                                                 and post crash care and response
    As the key next step, the Government is focused
    on striving to achieve the NSW 2021 target of              •• Targeting repeat offenders
    reducing the fataility rate to 4.3 per 100,000             •• NSW Stars on Cars Program
    population by 2016.
                                                               •• Exploring new road safety technologies
    Transport for NSW released the draft NSW Road
                                                               •• Separate strategies to support speed
    Safety Strategy 2012-2021 seeking community
                                                                 enforcement, motorcycle safety and Aboriginal
    feedback in September. We’ve listened to
                                                                 road safety.
    what the community raised, and this has been
    considered as part of the ongoing action plans to          Additionally, the NSW Government has now
    deliver the strategy.                                      established a new NSW Community Road
                                                               Safety Fund, ensuring any revenue raised from
                                                               all speed cameras detecting speeding and traffic
                                                               light offences will now go directly towards
                                                               improving road safety, including road safety
                                                               education, high visible police enforcement and
                                                               road safety infrastructure.

                                                               The Hon. Duncan Gay MLC
                                                               Minister for Roads and Ports

4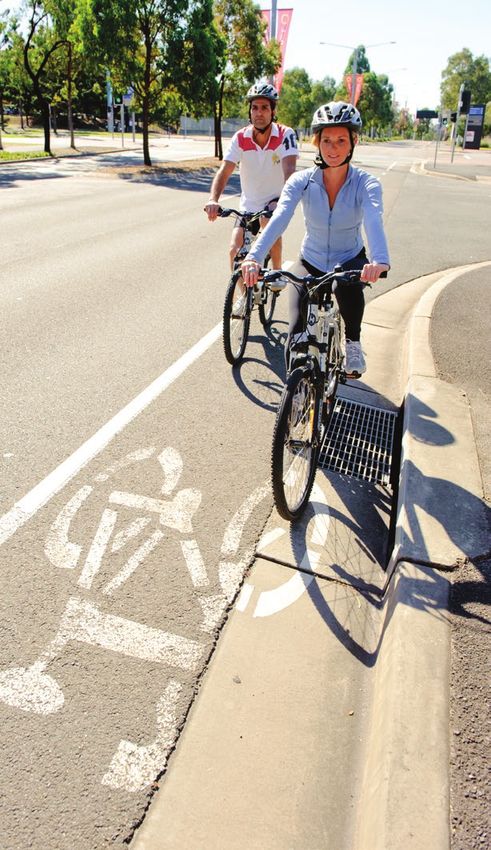
SYDNEY’S RAIL FUTURE

                       KEY POINTS
                       The NSW Road Safety Strategy 2012-2021:

                       •• Set key objectives and initiatives for the
                         next decade 2012-2021

                       •• Will be supported by detailed three year
                         action plans

                       •• Focuses equally on lowering fatalities and
                         serious injuries

                       •• Encourages shared responsibility for road
                         safety outcomes

                       •• Supports the delivery of the National
                         Road Safety Strategy 2011-2020.

                                                                       5
NSW ROAD SAFETY STRATEGY 2012–2021

    1. CONTEXT FOR A NEW ROAD SAFETY STRATEGY

    The NSW Road Safety Strategy 2012-2021 establishes the direction of road safety in NSW for the next 10 years.
    The Strategy is set in the context of the current and future policy operating environments of Transport for
    NSW. Transport for NSW is the lead agency for road safety in NSW, and therefore will lead and coordinate
    road safety interventions across State Government, Local Government, stakeholders and the community.

    There are a number of key documents which have influenced the development of this strategy.
    These include:

    NSW 2021                                                10 years. Australia is a signatory to the resolution,
    The NSW Government’s strategic plan for the state       proclaimed by the UN General Assembly in
    of NSW aims to reduce the fatality rate on NSW          March 2010.
    roads to 4.3 per 100,000 population by 2016. NSW        According to a World Health Organisation report,
    2021 aims to improve road safety by identifying         road traffic injuries are predicted to become the
    and upgrading black spots, promoting safety             fifth leading cause of death in the world by 2020.
    features in cars, enforcing speed limits and other      Hence the need to take strong action globally. The
    road rules, and education to encourage road users       report found more than 1.3 million people die
    to take less risks on NSW roads.                        every year due to road crashes with a further 20
                                                            – 50 million injured. This is predicted to grow to
    National Road Safety Strategy 2011 – 2020
                                                            1.9 million deaths by 2020.
    The National Road Safety Strategy 2011 – 2020
    (released in May 2011) aims to reduce the annual        Working with the community and
    number of fatalities and serious injuries by at least   stakeholders
    30 per cent by 2020. On average four people die         The customer is at the centre of the NSW Road
    and 90 people are seriously injured on Australian       Safety Strategy 2012–2021. The Government will
    roads every day. The National Road Safety               work in partnership with the community and
    Strategy 2011 – 2020 aims to elevate Australia’s        stakeholders to deliver the practical road safety
    road safety ambitions through the coming decade         initiatives identified in this Strategy to ensure that
    and beyond.                                             it delivers road safety benefits in NSW.
    As part of the National Strategy, NSW has               NSW 2021 states that:
    committed to addressing the actions detailed in
                                                               across the state, Regional Ministers and
    the one to three year action plan.
                                                               Members of Parliament will consult with local
    NSW Long Term Transport Master Plan                        government and communities to develop local
                                                               and regional action plans aligned to NSW 2021.
    Transport for NSW has developed a Transport
                                                               These plans will focus on the most important
    Master Plan to address the transport challenges
                                                               action the NSW Government can take to
    over the next 20 years. The plan identifies
                                                               improve outcomes in each region and locality.
    solutions and actions that integrate, modernise
    and manage the transport system in the short            Transport for NSW works with the Roads
    term, medium term and the longer term for               and Maritime Services, NSW Police and Local
    NSW. More details are included in the Transport         Government to address road trauma issues in NSW.
    Master Plan relating to the uptake of cycling
                                                            Transport for NSW also works with the Motor
    and development of connected networks and
                                                            Accidents Authority, Ministry of Health, education
    infrastructure for cycling and improved pedestrian
                                                            sectors – Department of Education and
    access and amenity across the network.
                                                            Communities, Catholic Education Commission,
    United Nations Decade of Action for Road                Association of Independent Schools, NRMA
    Safety 2011 – 2020                                      Motoring and Services, industry and road user
                                                            community groups to deliver a range of initiatives
    The Decade of Action for Road Safety 2011 – 2020
                                                            to improve road safety.
    is a United Nations initiative aimed at halving the
    projected global road traffic deaths over the next

6
NSW ROAD SAFETY STRATEGY 2012–2021
Operating Environment
The 10 year strategy for road safety in NSW is set in the context of the current and future road transport
environment of the state. Some of the main factors influencing the rate of road trauma in NSW are:
•• The economy – the continuous expansion of •• Ageing population – NSW is the most populous
the domestic economy in the last 15 years state in the Australia, and Sydney has the
and associated increased travel exposure has largest population of any city in Australia. The
presented a significant challenge in efforts to projected ageing of the population in NSW
achieve road safety targets. means that over time safety issues related to
older road users will have a greater impact on
•• Increasing fuel costs – sharp increases in fuel
the road toll. There is a strong need for state
costs over recent years can influence travel
and local government planning to consider the
patterns and consumer choice in a number of
safety of older road users.
ways. It can affect performance to maintain
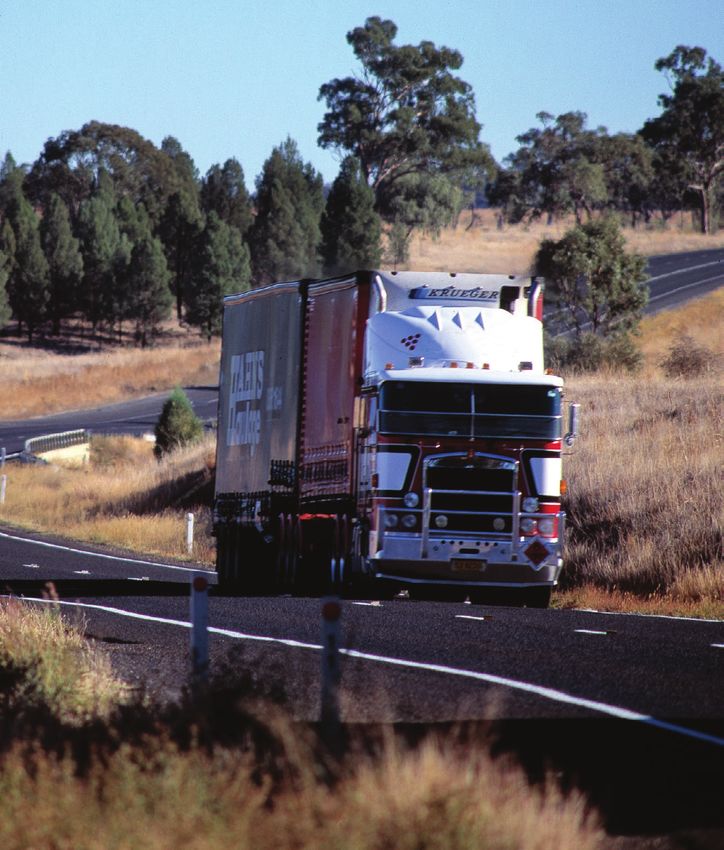
operator profitability and/or result in less travel •• Increased freight movements – within NSW
or new patterns of travel. there are a large number of key freight routes
supporting the vital heavy vehicle industry.
•• Motor vehicle sales – increases in fuel prices
Demands for freight services will continue to grow
have given rise to an increased popularity of
strongly. It is projected that the overall freight task
smaller, more fuel-efficient vehicles including
in NSW will almost double over the next 20 years,
scooters and motorcycles.
and therefore it is critical to work in partnership
•• Urban development and travel patterns with industry to improve safety. Further, 60 per
– household travel patterns have changed cent of freight hauled on NSW roads has an
with travel growth greatest in the developing origin and destination outside of NSW.
outlying suburbs, reflecting continued
•• Workplace Safety – increased support is
population growth and varying levels of access
required for companies and industry to
to alternative modes of transport. Travel
recognise that road safety is a key workplace
projections for the Greater Metropolitan Area1
safety issue, in particular for companies with
suggest that aggregate car travel will increase
staff who work in their vehicles as a primary
by around one per cent per annum over the life
place of work.
of the strategy.
This ten year road safety strategy presents an opportunity for Government,
industry, stakeholders and the community to make a difference on our roads to reduce
road trauma. There are a number of key challenges facing NSW in the future which we
must act to address.
I am confident that this document will provide a way forward towards achieving our goals.”
Margaret Prendergast, General Manager,
Centre for Road Safety, Transport for NSW
1 Source: Trans Figures: Travel Forecasts 2006-2036,
Bureau of Transport Statistics, TfNSW (February 2012)
7
NSW ROAD SAFETY STRATEGY 2012–2021

    2. FATALITY AND INJURY TRENDS

    Where we are now
    In order to be successful in meeting our road safety                                 2011 serious injury result represents a decrease
    targets, it is important to understand the nature                                    of around nine per cent from 1990 levels. These
    and extent of serious road trauma across NSW. This                                   results were achieved despite strong growth in the
    section contains an overview of the incidence of                                     NSW population, the number of licence holders
    road crashes across NSW, classified by factors such                                  and registered vehicles over the period 1990 to
    as location, crash type and road user type in order                                  2011. This reduction in serious road trauma over
    to help identify the key problem areas.                                              the past two decades has been a significant
                                                                                         achievement and the challenge is to further
    The 2011 road toll was 364, representing the eighth
                                                                                         reduce the level of deaths and serious injuries
    annual decrease over the last nine years and
                                                                                         across the state.
    the lowest annual total since 1926. There were a
    further 26,366 persons injured in 2011, of which it                                  Appendix A details some of the issues around
    is estimated that 6,855 were seriously injured. The                                  serious injury and work underway.

    Figure 1 – Trends in road deaths, population, licence holders, motor vehicle registrations

                         30

                         25

                         20
    Ratio (1926 = 1.0)

                         15

                         10

                          5

                         0
                              1926

                                     1930

                                            1935

                                                   1940

                                                          1945

                                                                 1950

                                                                        1955

                                                                               1960

                                                                                      1965

                                                                                                1970

                                                                                                        1975

                                                                                                               1980

                                                                                                                      1985

                                                                                                                             1990

                                                                                                                                    1995

                                                                                                                                           2000

                                                                                                                                                  2005

                                                                                                                                                         2011

                                                                                             Year

                                     Registered Motor Vehicles                                         Population
                                     Licence Holders                                                   Road Toll

8
Number of Serious Injuries Number of fatalities
0
1000
2000
3000
4000
5000
6000
7000
8000
0
100
200
300
400
500
600
700
800
1990 – 1990 –
797
7546
1991 – 1991 –
(1990)
(1990)
1992 – 1992 –
1993 – 1993 –
1994 – 1994 –
1995 – 1995 –
1996 – 1996 –
1997 – 1997 –
1998 – 1998 –
Figure 3 – Road traffic serious injuries 1990-2011
NSW ROAD SAFETY STRATEGY 2012–2021
Figure 2 – Road traffic fatalities in NSW 1990 – 2011
1999 – 1999 –
2000 – 2000 –
2001 – 2001 –
2002 – 2002 –
2003 – 2003 –
2004 – 2004 –
2005 – 2005 –
2006 – 2006 –
2007 – 2007 –
2008 – 2008 –
374
6252
(2008)
(2008)
2009 – 2009 –
453
6268
(2009)
(2009)
2010 – 2010 –
405
(2010)
6402
(2010)
364
2011 – 2011 –
(2011)
6855
(2011)
9
NSW ROAD SAFETY STRATEGY 2012–2021
Figure 4 – Road traffic Injuries in NSW 1990-2011
32,153
(1990)
35
30
26,366
Number of Injuries (in thousands)
(2011)
25
24,048 24,623
(2008) (2010)
20
15
10
5
0
1990 –
1991 –
1992 –
1993 –
1994 –
1995 –
1996 –
1997 –
1998 –
1999 –
2000 –
2001 –
2002 –
2003 –
2004 –
2005 –
2006 –
2007 –
2008 –
2009 –
2010 –
2011 –
Figure 5 – Road traffic crash fatalities per 100,000 population, NSW, 1908-2011
Peak of the Dec 1982
roaring 1920s 1970 (28.9) Random
30 Breath
Testing
Fatalities per 100,000 population
25
20
15
10
2010
(5.7)
5
1908 1930s WWII 1950-60s Oct 1971 1992 2008 2011
(7.6) Depression Rapid Compulsory Road Safety (5.4) (5.0)
0 Motorisation Seat Belts 2000 Strategy
1910 1920 1930 1940 1950 1960 1970 1980 1990 2000 2010
Figure 5 above, shows a range of road safety initiatives which have been implemented successfully
across NSW over the past four decades. These key initiatives (and others) have contributed to significant
reductions in the fatality rate per population. Similarly, injury trends in NSW have followed those for
fatalities since the peaks in the 1970s, with injury levels for 2008 through to 2010 being at the lowest
levels since 1962.
10NSW ROAD SAFETY STRATEGY 2012–2021
Setting the scene for road The Monash University’s Accident Research Centre
(MUARC) has undertaken modelling to inform
safety priorities the development of this strategy. As part of this
The extent and nature of the road trauma problem project, and due to the lack of serious injury data
in NSW provides important insight which helps in NSW, MUARC derived an estimate of the current
address the key road safety risks and issues. Some levels of serious injuries. MUARC undertook
key overall road crash data highlights areas of modelling that incorporated NSW crash data,
risk that set the scene for road safety priorities is crash types, and class of road user by specified
detailed in this section. region, and then used Queensland casualty data
to estimate the expected levels of serious motor
The below map has been developed to categorise
vehicle injury for NSW. The MUARC modelling
regions based on population density and access to
found that around 25 per cent of injuries were
services. This has been classified into five regions:
serious injuries for the three year period.
•• Major cities (Sydney, Newcastle, Wollongong) –
A recent project linking NSW crash data and
Dark blue
hospital and Registry of Birth Deaths and
•• Inner regional (Bathurst, Coffs Harbour, Albury) Marriages data between 2005 and 2009
– Green confirmed that 26 per cent of injuries in NSW
are serious injuries. This is further detailed in
•• Outer regional (Coonabarabran, Glen Innes,
Appendix A.
Narrandera) – Yellow
The figures 6 and 7 below highlight the overall
•• Remote (Cobar, Walgett, Menindee) – Mid blue
road toll and serious injuries based on the five
•• Very remote (Wilcannia, Lightning Ridge, Lord regions along with a breakdown of key casualties.
Howe Island) – Light blue
Sydney
Canberra
11NSW ROAD SAFETY STRATEGY 2012–2021
Figure 6 – Fatalities all NSW, 2008-2010 Figure 7 – Serious casualties all NSW, 2008-2010
45 50
40 45
40
35
35
30
30
25
25
Percent
Percent
20
20
15
15
10
10
5 5
0 0
Regions Regions
Major Cities 25.2% Major Cities 49.1%
Inner Regional 41.6% Inner Regional 34.1%
Outer Regional 29.8% Outer Regional 15.2%
Remote 2.4% Remote 1.1%
Very Remote 0.9% Very Remote 0.5%
Figure 8 – Run-off road serious casualties, 2008-2010 Figure 9 – Head-on serious casualties, 2008-2010
45 50
40 45
40
35
35
30
30
25
25
Percent
20
20
15
15
10
10
5 5
0 0
Regions Regions
Major Cities 29.9% Major Cities 29.1%
Inner Regional 40.8% Inner Regional 47.1%
Outer Regional 26.3% Outer Regional 22.8%
Remote 2.1% Remote 1.0%
Very Remote 1.0% Very Remote 0.1%
12NSW ROAD SAFETY STRATEGY 2012–2021
Figure 10 – Young driver serious casualties, 2008-2010 Figure 11 – Pedestrian serious casualties, 2008-2010
50 100
45 90
40 80
35 70
30 60
25 50
Percent
Percent
20 40
15 30
10 20
5 10
0 0
Regions Regions
Major Cities 48.1% Major Cities 73.1%
Inner Regional 37.1% Inner Regional 20.0%
Outer Regional 13.6% Outer Regional 6.2%
Remote 0.7% Remote 0.5%
Very Remote 0.4% Very Remote 0.2%
Figure 12 – Drivers and riders involved in fatal crashes in Figure 13 – Fatalities, NSW, 2008 to 2010,
country NSW, 2008 to 2010, residence of driver/rider class of road user
Same LGA 41% Driver 48%
Other Country 31% Passenger 21%
Metropolitan 12% Motorcyclist 15%
Interstate / Overseas 13% Pedestrian 13%
Unknown 3% Pedal Cyclist 3%
13NSW ROAD SAFETY STRATEGY 2012–2021
Location
•• While only one third of the NSW population resides in country areas, two-thirds of all fatalities occur
there. On a rate basis, country residents have a fatality rate per 100,000 population more than four
times that of their metropolitan counterparts.
•• In country areas, the majority (72 per cent) of drivers and riders involved in fatal crashes are country
residents, with around half of these living in the same Local Government Area as the location where
the crash occurred (see figure 12).
•• A large proportion of fatalities in country areas occur on 100km/h roads.
Road user type
•• The majority of fatalities (68 per cent) are vehicle occupants (drivers and passengers) while nearly one
third of all fatalities are vulnerable road users (pedestrians, cyclists and motorcyclists).
CRASH TYPE – THE MOST COMMON TYPES OF FATAL CRASHES ARE:
•• Vehicle-to-vehicle head-on (not overtaking)
•• Run off path on straight or curves (generally in country areas)
•• Intersection
•• Vehicle-pedestrian crashes – usually in built-up areas.
Figure 14 – Fatalities by crash type by urbanisation NSW 2008 to 2010
400
350
300
Number of fatalities
250
200
150
100
50
0
Run off road Head on Intersection Pedestrian Rear impact
Crash Type
Metropolitan Country
14NSW ROAD SAFETY STRATEGY 2012–2021
Risk Taking Behaviours Age
•• As part of the crash reporting process, NSW •• A distribution of fatal crashes by age group
Police provide assessments of the likely key shows young adults aged 17 to 25 years account
contributing factors to crashes that they attend. for one-quarter of all deaths, the 30 to 59
It is this information that forms the basis for years age group for more than 40 per cent of
estimates of behavioural factors in fatal crashes all deaths and those aged 80 years or more
described in Figure 15 below. account for seven per cent of deaths.
•• During the three year period 2008 to 2010,
excessive or inappropriate speeding accounted
Gender
for 42 per cent of all fatalities, illegal alcohol
for at least 20 per cent and driver fatigue for •• In NSW, during the three year period 2008 to
16 per cent of all road deaths whilst restraint 2010, nearly three times as many males as females
non usage was recorded for one in six vehicle were killed on the roads. Males also figure more
occupant deaths. prominently in taking risks on the road including
speeding, illegal alcohol levels, driver fatigue and
the non-use of restraint or helmet.
Figure 15 – Fatalities by behavioural factors NSW 2010
50%
% of Fatalities / % of Veh Occ Fatalities
40%
30%
45%
20% 42%
36%
10% 23%
20% 19%
16% 17% 18%
15% 14%
10%
0
Excessive Speed Illegal Alcohol Fatigue Restraint non usage
Behavioural Factor
All NSW Metropolitan Country
SUMMARY OF MAJOR ROAD SAFETY ISSUES:
•• Addressing fatalities in rural regional NSW – Head on, run off road and curve crashes
•• Addressing serious injury crashes in urban/metro areas
•• Speeding, illegal alcohol, non restraint usage, driver fatigue
•• Pedestrian, cyclists and motorcyclists
•• Male drivers
15NSW ROAD SAFETY STRATEGY 2012–2021
3. VISION AND TARGETS
Vision The 30 per cent reduction in fatalities and serious
injuries represents a significant commitment to
The Safe System approach is a pathway that has reducing road trauma in NSW.
an end goal of no death or serious injury occurring
Historically, NSW has seen fatalities fall by around
on the road transport network. Crashes may
30 per cent per decade – a 35 per cent reduction,
continue to occur because, as humans, we make
from 931 in 1988-1990 to 603 in 2000 and a 30 per
mistakes but the consequences need not be death
cent reduction from 579 in 1998-2000 to 405 in
or life disabling injury.
2010. These achievements have been made even
The vision of the NSW Road Safety Strategy with a growth in motor vehicle travel and population
2012-2021 is: growth. The projected growth of the NSW population
”Working Towards Vision Zero” and associated growth motor vehicle travel, will
present a challenge to achieve the targets of the
However, this vision cannot be achieved in the 10
strategy. However, experience has shown successful
years of the life of the strategy. The initiatives to be
implementation of the appropriate strategies could
introduced as part of the strategy will be the start
still deliver substantive road trauma reductions.
of constructing a truly safe system for road travel.
During the period in which data for serious injuries
was available, the reductions for serious injuries
Target have not been as great as those for fatalities.
For example, serious injuries decreased by only
The target for the National Road Safety Strategy
26 per cent between 1988-90 and 1996 whilst
2011-2020 is the reduction of the annual number
fatalities decreased by 38 per cent over the
of fatalities and serious injuries by at least 30 per
same period. Given that improvements in the
cent by the end of 2021.
reduction of serious injuries have been around half
NSW is committed to achieving a reduction in to three-quarters of those for fatalities, a 30 per
the fatality rate to 4.3 per 100,000 population cent reduction in serious injuries represents a
by 2016, and at least a 30 per cent reduction in significant challenge.
fatalities and a 30 per cent reduction in serious
A detailed section has been included on serious
injuries by the end of 2021.
injuries as appendix A.
16NSW ROAD SAFETY STRATEGY 2012–2021
Figure 16 – Fatalities per 100,000 population target
10
9
8
Fatalities per 100,000 Population
7 5.7
5.0
6
5
3.4
4
3
2
1
0
2000 2005 2010 2015 2020 2021
Year
Fatalities per 100,000 population (Actual)
Fatalities per 100,000 population (2008-10 Baseline to NRSS 2020 Target)
Exponential Line (Based on 2000-2010 data)
Figure 17 – Estimated serious injuries per 100,000 population target
140
120
Serious Injuries per 100,000 Population
95
88
100
80 62
60
40
52
20
0
2000 2005 2010 2015 2020 2021
Year
Serious Injuries per 100,000 population (TARS Research estimates)
Serious Injuries per 100,000 population (2008-10 Baseline to NRSS 2020 Target)
Exponential Line (Based on 2000-2010 data)
17NSW ROAD SAFETY STRATEGY 2012–2021
4. KEY CHALLENGES
The data in chapter two – fatality and injury trends show a snapshot of the factors contributing to the road
trauma problem in NSW. They point to a range of behavioural and environmental factors that play a role
in the incidence and severity of road crashes. They also point to the best practice framework to support
addressing these factors which is outlined in the next chapter – the Safe System approach.
BASED ON THESE FACTORS, SOME OF THE KEY CHALLENGES FOR
NSW TO ADDRESS ARE:
•• Highlight speed as socially unacceptable.
•• Address driver and pedestrian distraction such as mobile phone usage.
•• Address heavy vehicle safety.
•• Address high-risk groups, including the over representation of young drivers in crashes.
•• Reduce death and serious injury arising from the four key crash types – run-off-road, head-on,
intersection and pedestrians.
•• Protect vulnerable road users – pedestrians, cyclists, older road users, children, young people
and motorcyclists.
•• Encourage the availability and take up of safer vehicles, especially by those most at risk.
•• Form closer partnerships with local government to further progress road safety outcomes.
•• Address a growing disparity in the size and mass of freight vehicles introduced on the network.
NRMA believes there are three important pillars to saving lives - safer cars, safer
drivers and safer roads. NSW has seen a gradual decline in the road toll over the last few
decades, however hundreds of people are still dying on our roads each year and we need
to get that figure down. The NSW Road Safety Strategy can be the catalyst to bringing
down that toll if it focuses on those three crucial pillars. Too many people are still dying on
our roads - we must all work together to help save lives.”
Wendy Machin, President NRMA Motoring & Services
18NSW ROAD SAFETY STRATEGY 2012–2021
5. “SAFE SYSTEM” DIRECTIONS
The NSW Road Safety Strategy 2012-2021 is The key principles underpinning the Safe System
underpinned by the Safe System approach to approach are:
improving road safety. This approach takes a
•• Inclusive view of the whole road transport
holistic view of the road transport system and the
system and the interactions between all
interactions among the key components of that
elements: roads and roadsides, vehicles, travel
system – the road user, the roads and roadsides,
speeds and all users of the system.
the vehicle and travel speeds. It recognises that all
components of the system have a role to play in •• There are physical limits to what the human
helping to keep road users safe. body can endure. The impact forces in any
major crash type are well known and, if they are
The system builders, including the road authorities
exceeded, can result in death or serious injury.
and the vehicle manufacturers and importers, and
system users including drivers and motorcycle We must therefore design a road transport
riders, passengers, pedestrians, cyclists and heavy system that is forgiving of human error to ensure
vehicle operators all must play a part. that users are not killed or seriously injured in
any crash.
We must also ensure that we have safe and
compliant road users.
Road crashes
affect more
than just you.
Don’t rush.
Dr. Brian Owler. Neurosurgeon. Westmead Hospitals.
19NSW ROAD SAFETY STRATEGY 2012–2021
6. SAFE SYSTEM ISSUES AND INITIATIVES
The following section outlines the NSW Road Safety Strategy 2012-2021 initiatives aligned with the
Safe System framework: safer roads, safer vehicles, safer people, safer speeds and post crash trauma
treatment. Two additional sections have been developed to meet the needs of NSW: heavy vehicle
operations and Aboriginal safety.
The strategy will build on existing safety programs and involve new initiatives over the next 10 years.
Three year action plans will be developed throughout the life of the strategy to address road safety
trends and provide detailed actions to be undertaken.
A number of key consultation sessions have been conducted with the Road Safety Advisory Council and
the heavy vehicle industry to develop a range of initiatives for this strategy.
Safer roads
Issues
The Safe System approach places particular importance on the design of safe roads and roadsides. The
construction of safe roads that match the specific environment, travel needs and road user behaviour
contributes significantly to road trauma outcomes. Some of the broad crash data show the main crash
types that need to be considered when developing safer roads. They include:
Major crash types
Serious casualties by type of crash, 2008 to 2010 average
Fatalities Serious Injuries*
Number % Number %
All Crash Types 411 6307
Intersections 76 19% 2984 47%
Run Off Road 179 44% 1735 28%
Head On 95 23% 347 6%
Rear Impact 10 2% 1352 21%
* Serious Injuries have been estimated using 26% match rate from the TARS research study
Safe System principles recognise that human error in the road environment is inevitable and that road
infrastructure should accommodate this error and minimise the consequences. Safer Roads applies to
safety aspects relating specifically to road design, traffic management, the roadway and its adjoining
surroundings and environmental conditions.
The ongoing development and upgrade of the NSW road network is essential to improve road safety.
NSW will continue to invest in road infrastructure and, given that NSW experiences the highest level of
travel in Australia, the NSW Government will also advocate for Commonwealth funding to support road
development and safety programs.
20NSW ROAD SAFETY STRATEGY 2012–2021
SAFER ROADS KEY FOCUS
Developing innovative and cost effective •• Develop and promote land use planning
treatments for safe road use are highly procedures and policies and urban
important to reaching the Strategy targets. development guidelines at State and local
levels to incorporate Safe System principles.
There is potential to address fatal and serious
injury crashes on the road network through •• Strengthen links between road safety,
improved intersection design, eliminating or land use planning and active transport policy
shielding road users from roadside objects or and planning.
from opposing vehicles and by considering
•• Implement and maintain road infrastructure
pedestrians and bicycle riders particularly in
on state and local roads leading to Aboriginal
urban areas. Following the Safe System approach
communities to enhance road safety.
will bring positive road safety outcomes.
•• Research and implement innovative or
In line with the NSW crash information and
cost effective infrastructure treatments
the safer roads principles, the following
to enhance safety outcomes for all road
initiatives have been identified to improve the
users including motorcyclists, for lower
NSW road network:
volume routes and vehicle to infrastructure
•• Ensure road safety is considered throughout communications.
the design, construction, maintenance,
•• Address the safety needs of vulnerable
operation and audit of the road network for
road users through infrastructure and traffic
all road users including targeting treatments
management treatments, including lower
to address head-on, intersection, run-off-
speed limits and traffic calming measures.
road crashes.
•• Work with local government to improve
•• Implement and enhance a NSW Safer
consistency and guidance on road safety for
Roads program with targeted infrastructure
vulnerable road users including on road and
safety works programs including safety
off road bicycle facilities.
barriers, highway route reviews, local roads,
pedestrian safety measures, and motorcycle •• Investigate infrastructure treatments to
recreational routes. enhance road safety on the highway network
for heavy vehicle drivers and to support
•• Work with agencies to develop pro-active
enforcement activities.
approaches to road safety engineering,
including road safety audits. •• Establish systems to assess the
performance of the road network for
•• Continue to deliver Nation Building and State
road safety outcomes based on the Safe
programs with road safety objectives, including
System principles.
the program of highway duplications.
21NSW ROAD SAFETY STRATEGY 2012–2021
Safer vehicles
Issues
Vehicle safety has improved dramatically in recent times and this is reflected in road trauma data. Air
bags, electronic stability control, child restraints, seat belts, anti-lock braking systems and speed limiters
are just some of the vehicle improvements that have contributed to positive road safety outcomes.
However, some key issues that are still impacting safe vehicle use include:
•• Younger drivers are more likely to drive older, less safe vehicles.
•• The average age of the vehicle in a fatal crash driven by a young driver is three years older than for a
middle-aged driver similarly involved.
•• The improvement in safety of passenger cars over the past two decades, has not been matched in the
safety of light commercial vehicles.
•• The risk of death or serious injury in a crash is lower for later model cars, with the risk of a 2007 vehicle
about half that of a vehicle produced in 1987 1.
•• Mobility scooters have become increasingly popular.
•• Heavy vehicles account for around 17 per cent of fatal crashes on NSW roads, with the NSW road
network carrying approximately 60 per cent of all land based goods movements within Australia.
The graph below displays light vehicles registered in NSW (as at December 2011), and from 2006 includes
the proportion of the vehicles ANCAP safety rating.
Figure 18 – Light vehicles registered in NSW and in later years, includes the proportion of the vehicles’
ANCAP safety rating.
350
300
Number of Vehicles (in Thousands)
250
200
150
100
50
0
1997 1998 1999 2000 2001 2002 2003 2004 2005 2006 2007 2008 2009 2010 2011
Year of Manufacture
ANCAP no rating ANCAP 1 or 2 stars ANCAP 3 stars
ANCAP 4 stars ANCAP 5 stars
1 Newstead S, Watson L and Cameron M, 2009 Vehicle Safety Ratings estimated from Police reported Crash Data,
report 287 MUARC, Clayton, Vic
22NSW ROAD SAFETY STRATEGY 2012–2021
SAFER VEHICLES KEY FOCUS
The aim of making vehicles safer is to reduce •• Work with the Federal Government and
the number and severity of injury incidents by other jurisdictions to continue improving
improving the safety characteristics of vehicles vehicle standards.
and protective equipment for all road users.
•• Promote road safety through effective
Research is already showing a growth in demand schemes for the roadworthiness of in-service
for safer vehicles and manufacturers are vehicles and ensuring modified vehicles
increasingly incorporating new safety features comply with safety standards.
in their vehicles. Historically, these features have •• Undertake research and assessment of
served to protect the occupant in the event of the impact of alternative vehicles and new
a crash (passive safety), but attention is now technologies.
turning to the role that technologies can play in
•• Undertake further research in the areas of
preventing a crash from occurring (active safety)
vehicle design, crash studies including roll-
as well as securing further benefits in passive
over, and occupant protection.
safety and safety features in other road vehicles.
•• Conduct further research into heavy vehicles
The intelligent vehicle of the future will have
to ensure safety and productivity objectives
the capacity to deliver strong safety returns
are balanced.
to the NSW community. Key vehicle safety
initiatives in the next 10 years to improve •• Promote improved technologies to increase
vehicle safety include: the safety of heavy vehicle operations.
•• Develop a NSW Stars on Cars program to
•• Investigate improvements to the safety
promote safer vehicle purchases at the point
standards for new vehicles.
of sale.
•• Work with industry to improve safer vehicles
•• Continue to support the ANCAP crash
and technology availability.
testing program and the assessment of Used
•• Trial and work with industry on the
Car Safety Ratings.
development and deployment of fatigue,
•• Continue supporting the national working
distraction monitoring and collision
group on alternative vehicles.
avoidance technologies.
•• Research and promote motorcycle safety
•• Promote consumer awareness and uptake of
features.
road safety technologies.
•• Continue research into restraints including
•• Investigate methods to increase the uptake
safer child restraints.
of safer vehicles in the NSW fleet.
The advances in road safety achieved since the Staysafe Committee was formed
30 years ago are remarkable. These include substantial reductions in injury and fatality
rates, improved road safety infrastructure on all roads and evidence based solutions to
create safer road environments. This is a testament to the Committee’s work, as well as to
all whose job it is to keep motorists, passengers and pedestrians safe. There is still more
work to be done and I know that the past and present contributions of Staysafe, together
with the experts at Transport for NSW and Roads and Maritime Services, will continue to
further the goal of reducing risks on NSW roads. We all look forward to building on the
very solid safety foundations which have been achieved to date”
Greg Aplin MP, Chair, Staysafe Committee
23NSW ROAD SAFETY STRATEGY 2012–2021
Safer road users
There is no doubt that human decision-making and actions, whether inadvertent or deliberate, contribute
significantly to the incidence of serious road crashes. The Safe System approach acknowledges that
people make mistakes and that the transport system should accommodate those mistakes. There is also
a strong need for road users to be educated, licensed and have access to information to improve their
own safety so their behaviour does not put them at risk in a system that would otherwise be safe.
As road users, we need to drive responsibly and comply with the road rules to minimise the risk of a crash.
Impaired road users, whether fatigued or under the influence of alcohol or drugs, are endangering their
own lives as well as other road users. Action must be taken to reduce unsafe behaviour on our roads.
The interaction between road users also leads to crashes. There is a need to address behaviours that
create this crash risk by the development of a share the roads message to address interaction issues and
create a level of respect between different road users.
Road user initiatives will be supported by positive and engaging road safety communication campaigns.
At-risk road users
Children and young people
Children and young people, because of their inquisitive Novice drivers aged under 26 years represent 16
and unpredictable behaviour, are at risk of injuries per cent of licensed drivers but they are involved
and in particular, road related injuries. Risk taking in around 28 per cent of all fatal crashes. A
is a normal and expected developmental element. combination of factors is likely to account for this
Education on road safety issues is a key component over-representation. They include inexperience, a
to assist parents, carers and school professionals. propensity to take risks, travel at high-risk times of
Education materials and resources need to be age the week and access to older, less safe vehicles, as
appropriate, ongoing and sequential to reinforce mentioned earlier.
road safety messages throughout their schooling. It
From 2000 to 2010, the number of fatal crashes
is important through partnerships between schools
involving young drivers (aged under 26 years)
and homes for road safety education to be further
has fallen by 47 per cent. This is nearly twice
developed in the real traffic environment.
the decrease for fatal crashes not involving a
NSW currently has an extensive program of young driver. Although these are very substantial
measures in place focusing on the safety of improvements, we should not be complacent.
children and young people. In accordance with
the above, the NSW Staysafe Committee in 2011
conducted an inquiry into school zone safety.
The Committee recommended a range of further
policy developments which are being considered
by the NSW Government.
24NSW ROAD SAFETY STRATEGY 2012–2021
KEY FOCUS FOR CHILDREN AND YOUNG PEOPLE
•• Continue the rollout of flashing lights to enhance the visibility of school zones and at risk road users.
•• Review the licensing arrangements for learner drivers, develop a Safer Driver Course and
programs to support disadvantaged people.
•• Further review the graduated licensing scheme in a national context.
•• Support education on safe cycling and walking practices in the road traffic environment.
•• Continue to develop and refine the road safety education program in schools for Kindergarten
to Year 12 and early childhood programs to highlight key road safety issues that is
developmentally appropriate.
•• Improve data, initiatives and communications to reduce low speed run over crashes (e.g.
driveway crashes).
25NSW ROAD SAFETY STRATEGY 2012–2021
Pedestrians
Pedestrians are considered at risk road users due KEY FOCUS FOR
to the lack of protection provided by the vehicle in PEDESTRIANS
the event of a crash, which results in more severe
•• Improve pedestrian crossing safety,
outcomes.
including reviewing signal phasing for
Pedestrians account for 14 per cent of the NSW pedestrians.
road toll and are a significant group among road
•• Work with local government to
users killed in the Sydney Region. At least 33 per
undertake road safety audits to address
cent of pedestrian fatalities between 2008 and
the maintenance and upgrade of
2010 were alcohol impaired and 40 per cent of
pedestrian facilities.
pedestrian fatalities were aged 60 years or more.
•• Support the Long Term Transport Master
There is a strong desire for pedestrian safety across
Plan and the walking investment program
the road network. This includes the provision of
to address the infrastructure needs of
40km/h High Pedestrian Activity Areas which
pedestrians.
are being progressively rolled out at identified
locations and 10km/h Shared Zones, pedestrian •• Trial innovative technology solutions
fencing and other infrastructure treatments, along to address pedestrian safety, including
with safer vehicles which are pedestrian friendly. vehicle to person systems and vehicle
These will all contribute to the achievement of the based pedestrian detection systems.
targets of this strategy.
•• Landuse planning guidelines to consider
pedestrian requirements, especially
at transport hubs, new residential
developments and in regional NSW.
•• Research pedestrian distraction
devices and the effects within the road
environment.
•• Develop communications and
awareness campaigns to promote safety
with pedestrians and other road users.
•• Review the application of shared paths and
safer interaction between pedestrians and
bicycle riders.
26NSW ROAD SAFETY STRATEGY 2012–2021
Bicycle riders
The NSW Government is committed to encouraging KEY FOCUS FOR BICYCLE
and increasing the level of bicycle riding in the NSW RIDERS
community. To allow for this, infrastructure must
•• Support the Long Term Transport Master
be appropriate to allow for the safety of bicycle
Plan development of a connected cycling
riders, together with respect from other road users.
network and a long term NSW cycling
A combination of infrastructure and behavioural
investment program.
education campaigns to support safe cycling will
result in fewer serious and fatal injuries. •• Work with local government to undertake
assessment of new bicycle routes
with bicycle community and address
maintenance and upgrading of cycling
facilities, with a focus on improved safety.
•• Develop consistent standards and
guidance for cycling facilities, including
shared paths, to ensure the consistent
application of treatments.
•• Develop programs and communications
to support bicycle riders to increase
usage of helmets, riding skills and
confidence, bicycle maintenance and
visibility.
•• Landuse planning guidelines to consider
the requirements of bicycle riders,
especially at transport hubs and in
regional NSW.
•• Investigate opportunities to enhance
signage on and around popular bicycle
cycling routes to highlight their presence
to drivers.
•• Develop communication and awareness
campaigns to promote safety of bicycle
riders with other road users. .
•• Conduct bicycle surveys to gain insights
into unsafe behaviours of bicycle riders.
A Safe System is effective when all road users benefit from improved safety. Bike
riders are one of the most vulnerable road users currently. The Amy Gillett Foundation
strives to work with Transport NSW to reduce all road user fatalities and serious injuries by
30 per cent over the next 10 years. That is, to realise for bike riders the safety gains made
for motorists over the past 30 years.”
Tracey Gaudry,
Chief Executive Officer , Amy Gillett Foundation
27NSW ROAD SAFETY STRATEGY 2012–2021
Motorcyclists
Motorcycle crashes tend to result in serious road KEY FOCUS FOR
trauma in NSW. While motorcyclists represent less MOTORCYCLISTS
than four per cent of registered motor vehicles
•• Research impacts of fatigue upon
and less than one per cent of overall vehicle travel,
motorcyclists.
they accounted for 15 per cent of all fatalities
between 2008 and 2010. On a ‘per kilometre of •• Increase motorcycle awareness and risk
travel’ basis, motorcyclists are around 20 times management among other road users.
more likely to be killed compared to an occupant
•• Develop communications to highlight
of a passenger vehicle.
light vehicle awareness of motorcyclists.
Transport for NSW has been working with the
•• Investigate enforcement strategies and
motorcycling community in the development of a
education campaigns to deter risk taking
new NSW Motorcycle Safety Strategy 2012–2021.
behaviour.
The number of motorcycles on the road network
in NSW is increasing. There is currently very
strong growth in both the number of motorcycle
registrations and rider licences in NSW. This
growth is more pronounced than the growth in
other transport modes.
In addition to engineering treatments aimed at
improving the safety of motorcyclists, there is a
need to address specific behaviours that lead to
crashes involving motorcyclists.
Older road users
As detailed earlier, the ageing population is KEY FOCUS FOR OLDER ROAD
projected to increase across the next decade. USERS
NSW is the most populous state in Australia and
•• Develop programs with local government
Sydney is the most populous city. A key focus is
to provide safe convenient transport
to address the safety of older road users. Two key
options for older people.
areas are older pedestrians and older drivers.
•• Work with road authorities to provide
Older pedestrians, older drivers and passengers
facilities for older road users including
are over represented in fatal crashes. This is due to
improved pedestrian access, longer
frailty and a reduced tolerance from the force of a
green light phasing and local education
crash, rather than risk taking.
campaigns.
There is a strong need to maintain mobility and
•• Improve mobility scooter safety for older
access for older road users, with a large proportion
road users.
living in suburban locations.
•• Review the driver licensing for older
drivers.
•• Deliver communication campaigns to
target older pedestrian safety.
•• Progress road safety related actions from
the NSW Ageing Strategy.
28NSW ROAD SAFETY STRATEGY 2012–2021
Impaired road users
Issues
Impaired road users refer to people affected by IMPAIRED ROAD USERS KEY
alcohol, drugs, fatigue or distraction. Over the past FOCUS
two decades, NSW has had considerable success
Strong education campaigns coupled
in reducing levels of high-risk driving behaviours,
with Police enforcement have seen strong
such as drink driving, drug driving and driving while
improvements in changing the community’s
fatigued. Well-publicised enforcement activity,
attitude to drink driving. However, there is
coupled with appropriate penalty systems have
currently no specific legislation for light vehicle
proved to be a highly effective means of reducing
driver fatigue management. This means that
this unsafe behaviour and associated road trauma.
education strategies need to stand on their
Despite improvements over recent years in NSW, own, unlike fatigue management for heavy
drink-driving continues to be a major factor in death vehicle drivers. Impaired road users, whether
and serious injuries with at least 20 per cent of all fatigued, under the influence of alcohol and/or
fatalities between 2008 and 2010 involving a driver drugs and driver distraction remain a key focus
or rider with an illegal blood alcohol concentration. for NSW. To reduce the impact NSW will:
The evidence obtained from research is •• Work with NSW Police to strengthen random
unequivocal; there is a corresponding rapid breath and drug testing programs, unlicensed
increase in crash risk as motorists’ blood alcohol driving detection and illegal mobile phone
levels increase. This is true for all motorists but risks use, including a focus in rural NSW.
are significantly higher for young drivers. While
•• Develop revised education
levels of drug driving are not yet detailed in crash
communications and programs, to address
data, research has shown that the use of drugs,
drink driving including alcohol interlocks.
both illicit and prescription can increase crash risk.
•• Continue to research road user distraction
Between 2008 and 2010, fatigue was a factor in
and facilitate an in-vehicle naturalistic
16 per cent of all fatalities, equating to 197 deaths.
study research program to better
The majority of fatigued drivers and riders involved
understand the behaviours of drivers,
in casualty crashes are males, particularly aged
including the impact of distractions.
17 to 49 years.
•• Develop a strategy to address mobile
phone use, inducing strengthening
Country areas critically depend on enforcement and communication about
its danger.
roads to get people where they need to go.
•• Monitor the proliferation of devices used
Many people from the Parkes, Forbes and
in vehicles that may have an impact on
Lachlan Shire Council areas travel extensively
driver distraction.
on the roads – many in the course of their
•• Work with medical associations to
work. We are acutely focused on ensuring
research issues around the combination of
the roads are as safe as possible and that prescription drugs.
motorists and other road users are educated •• Develop a strategy to address light
about safe behaviour. Every life saved on vehicle driver fatigue.
the state’s roads is a win and through this •• Enhance NSW crash data to include
strategy and beyond I hope we can information about the involvement
continue to make real gains in this area.” of drugs and driver distraction in the
reporting of crashes on NSW roads.
Melanie Suitor – Injury Prevention Officer,
Parkes, Forbes and Lachlan Councils
29NSW ROAD SAFETY STRATEGY 2012–2021
Safer speeds
Issues speed limits. The capability of the Safer Roads
In NSW speed is a factor in about 42 per cent of website has also been expanded to allow the
road deaths, resulting in 520 fatalities over the community to nominate locations to be considered
three year period from 2008 to 2010. for speed camera enforcement, harnessing the
high level of community support for speed camera
Speeding, which encompasses excessive speed
activities.
(driving above the speed limit) and inappropriate
speed (driving too fast for the prevailing Speed limits alone, without engineering measures
conditions) is recognised as a major contributing and enforcement, are insufficient to achieve road
factor in both the number and severity of crashes. safety outcomes. Research conducted by the NSW
Centre for Road Safety has found that almost
As a vehicle’s speed increases so does the
a quarter of people report that they speed all
distance needed to stop. This means that as speed
or most of the time. Annual speed surveys also
increases, so does the risk of a crash. Also, higher
suggest that broadly eight per cent of drivers
vehicle speed equates to a greater amount of
exceed the speed limit by more than 10km/h.
kinetic energy that must be absorbed in the event
of a crash. The challenge in achieving safer speeds is to
address the social acceptability of speeding
Current and past research in Australia and
through a comprehensive speed management
internationally provides compelling evidence that
strategy, while balancing safety with the mobility
increased travel speeds, even at low levels, are
needs of motorists. The success of drink driving
directly related to both the likelihood of a crash
campaigns and other measures demonstrate the
occurring and the severity of crash outcomes.
possibilities to change the social acceptability of
A critical component of the Safe System approach risky behaviour
to road safety is that speed limits are set so that
A NSW Speed Camera Strategy was announced
they are safe for the type of road, and road users.
by the Government in June 2012. The strategy
The Government is committed to balancing safety outlines how speeding impacts upon the
and mobility needs and achieving improved community, how sites are selected for the four
consistency of speed zoning in NSW. The Safer types of speed cameras used in NSW, and how
Roads NSW website (www.saferroadsnsw.com.au) the Government will monitor speed camera
has been successful in facilitating community input performance and reporting of this back to
on speed zoning issues and the revised speed zone the community to ensure speed cameras are
guidelines provide guidance in setting appropriate improving road safety.
The past decade has certainly seen some great improvements in road safety but as
we embark on this strategy and look to the next 10 years I feel confident we can achieve
much more. A decade ago people probably saw road safety as being an important, but
separate issue but that can no longer be the case. In much the same way as OHS and
Environmental issues have been engrained in our thinking over time, so too must road
safety. Everyone must take ownership and play their part.”
Brad Turner, Regional Manager Southern Region
Roads and Maritime Services
30NSW ROAD SAFETY STRATEGY 2012–2021
SAFER SPEEDS KEY FOCUS •• Continue to develop and maintain the NSW
Speed Zoning guidelines in line with the
The adverse consequences of speeding,
Safe System approach and best international
particular the risks imposed on others from
practice in speed management.
an individual driver’s speed choice, require
a multi-faceted Safe System approach. This •• Develop systems to encourage the uptake of
would include the setting of appropriate Intelligent Speed Adaptation for motorists.
speeds for the environment, implementation •• Regularly review speed limits across the
of engineering measures to minimise the network to achieve greater consistency
severity of crashes and enforcement to ensure of speed zones, including the ongoing
compliance. The following key initiatives have consideration of feedback via the Safer
been identified in accordance with the Safe Roads NSW website.
Systems approach for safer speeds:
•• Monitor and evaluate speed limit
•• Maximise coordination between traditional compliance across the network to decrease
police speed enforcement and automated levels of speeding.
speed camera enforcement activities.
•• Utilise lower speed limit schemes for high
•• Increase high visibility police enforcement. pedestrian activity areas and roads with high
•• Implement the over-arching speed volume of on-road cyclists.
camera strategy to guide effective speed •• Address the wide-spread social acceptability
enforcement activities, including: of speeding through the continued
1. Improved communications with the development and implementation of
community around speed cameras and public education campaigns and greater
locations, annual reporting of speeding involvement of the community about speed
crash trends, revenue and infringements. related trauma.
2. Revised site selection criteria for camera •• Develop improved information and
locations. communications around the speed problem.
3. Establishment of NSW Community Road •• Implement more consistent application of
Safety Fund, into which money raised the general urban 50km/h speed limit across
from red-light, point-to-point and speed the network.
cameras will be directed to fund road •• Improve the safety of pedestrians and
safety programs. bicycle riders through the utilisation of lower
speed limit schemes, including 40km/h high
pedestrian activity areas and shared zones.
31You can also read