Offering memorandum huge price reduction! - NavPoint Real Estate Group
←
→
Page content transcription
If your browser does not render page correctly, please read the page content below
Long-Term Cr
                                                                       edit Anchor

                                     huge price reduction!
               offering memorandum
               2 3 I n v e r n e s s Way E a s t | E n g l e w o o d , C O

    U C E D
RED Price
 $9,995,000
                                 Price
                              $8,990,000

           D U C E D
        RE    Cap Rate
               7.38%
                                         Cap Rate
                                          8.23%

                           NOI
                         $739,875

                                Building Size
                                56,391 RSF

                                                            Click Here to View a
                                            Site Size
                                           4.67 Acres
Matt Call                             Matt Kulbe     Jeff Brandon
Principal                Brokerage Services          Brokerage Services
303.956.5781             720.635.4591                303.870.4091
matt.call@navpointre.com matt.kulbe@navpointre.com   jeff.brandon@navpointre.com

                                                                                   Execu t ive Summary 		                                   1

                                                                                     Propert y Descript ion 		                             2

                                                                                        Financial Model		                                  3

                                                                                           locat ion Overview                             4

                                                                                              marke t Overview                             5

2 - 2 3 I n v e r n es s Way E as t                                                                        N av p o i n t R e a l Es tat e G r o u P - 3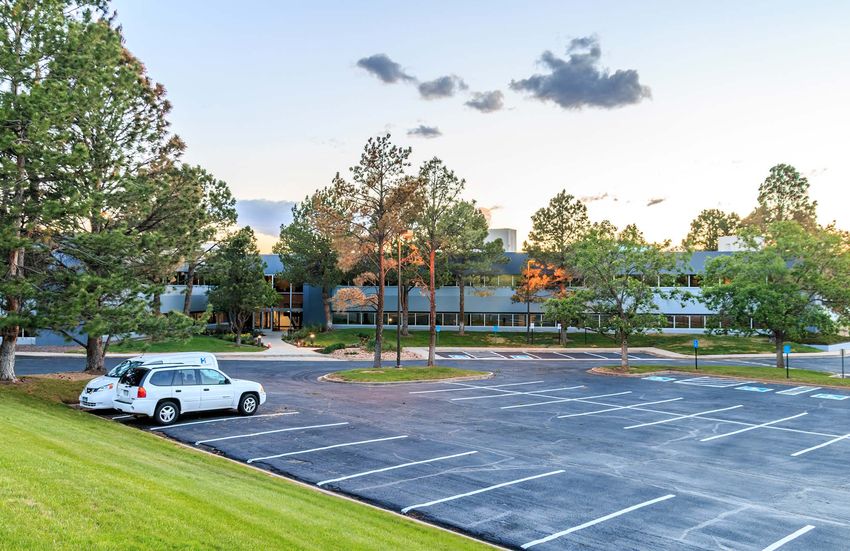
E x ecu t iv e Summ a ry
                           Execu t ive Summary - 1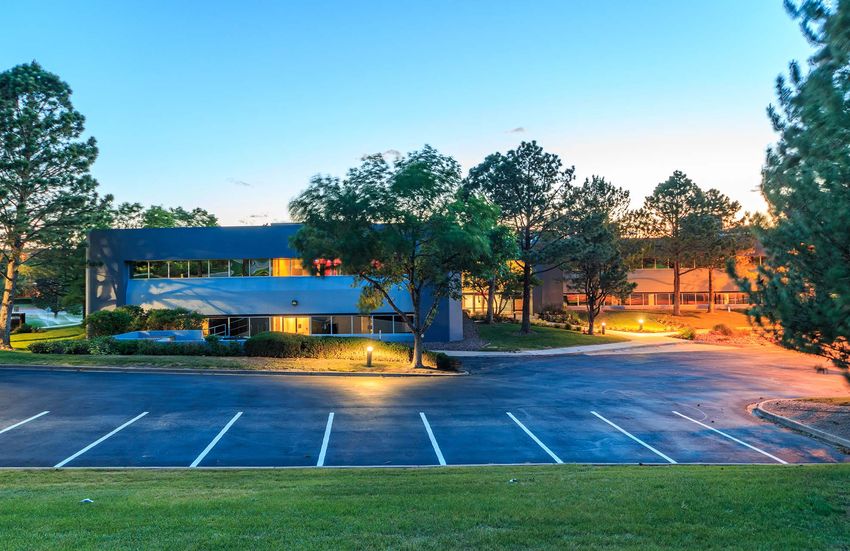
E x ecu t iv e Summ a ry
                                                                                                                                                                                         E x ec u t i v e S u m m a ry

                           Propert y T ype
                                 Office

                               Propert y Size
                                   56,391 RSF

                                      Occupancy
                                          97.59%

                                             Y e ar Built
                                                  1981
                                                                                           s i g n i f i can t i m p rovem en t s co m p let e d in 2 0 1 8 - 2 0 2 0
                                              Y e ar Renovat ed                                New Lobby &                   New                                              Exterior
                                                    2019-2020                                 Common Areas                                         New Roof                  Repainted
                                                                                                                          Bathrooms

                                                         Parking
                                                         4.21/1,000 SF                      E xe c utive Sum m a ry
                                                                                            NavPoint Real Estate Group is pleased to offer the opportunity to acquire 23 Inverness Way
                                                              Zoning                        East, a two-story, multi-tenant office building anchored by a strong credit Property Management
                                                             I-1, Englewood                 Company. The building consists of 56,391 rentable square feet and is located in the prestigious
                                                                                            Inverness Business Park just south of the Denver Tech Center. The property features ample parking
                                                                     NOI                    and excellent access to Interstate 25 and it’s ideal location is further enhanced by its proximity to
                                                                    $739,875
                                                                                            multiple light rail stations, Park Meadows Mall, Colorado Athletic Club, and Inverness Hotel and
                                                                                            Conference Center.
                                                                     Asking Price
                                                                         $8,990,000

                                                                              Cap R at e
                                                                                 8.23%
                                                                                                                                                                         N av p o i n t R e a l Es tat e G r o u P - 7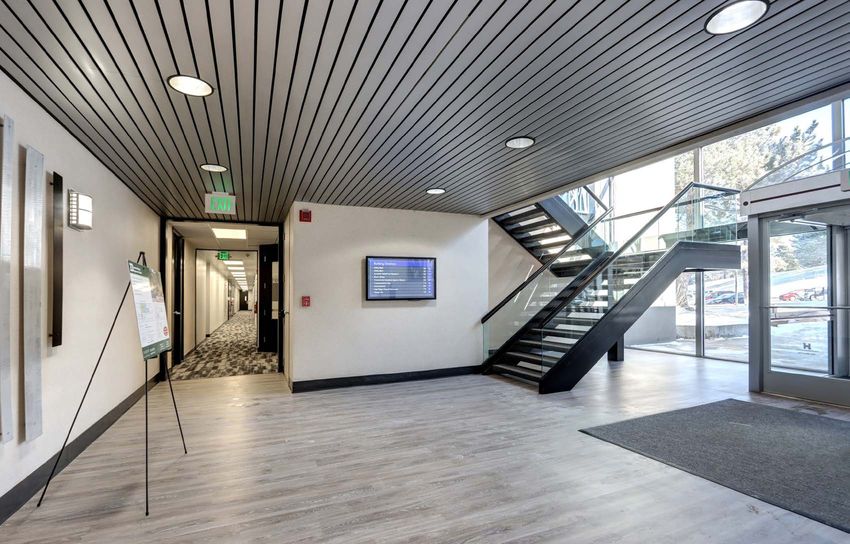
S Hav
E x ec u t i v e S u m m a ry                                          denver tech center                                                                                                          E x ec u t i v e S u m m a ry

                                                                                                                      ana S
                                                                                                                           t
                                                         Dry Creek light rail station
                                        E Dry Creek Rd

                                   St
                                te
                       mi
                    ose

                                                                                                                                                                                 Centennial
                  SY

                                                                                                                                                                                  Airport

                                                                                                                                                     rE
                                                                                                                                                            property

                                                                                                                                                   D
                                                                                                                                                ss
                                                                                                                                              ner
                                                                                                                                             ve
                                                                                                                                           In
                                                                                                       Inverness Pkwy                                          Inverness Way E
                       E County Line Rd

                                                                                                                               Inve
                                                                               Park Meadows light rail station

                                                                                                                                rnes
                                                                                                                                 s Pk
                                                                                                                                      wy
                                                                                                                                                    Inverness Dr S

8 - 2 3 I n v e r n es s Way E as t                                                                                                                                                N av p o i n t R e a l Es tat e G r o u P - 9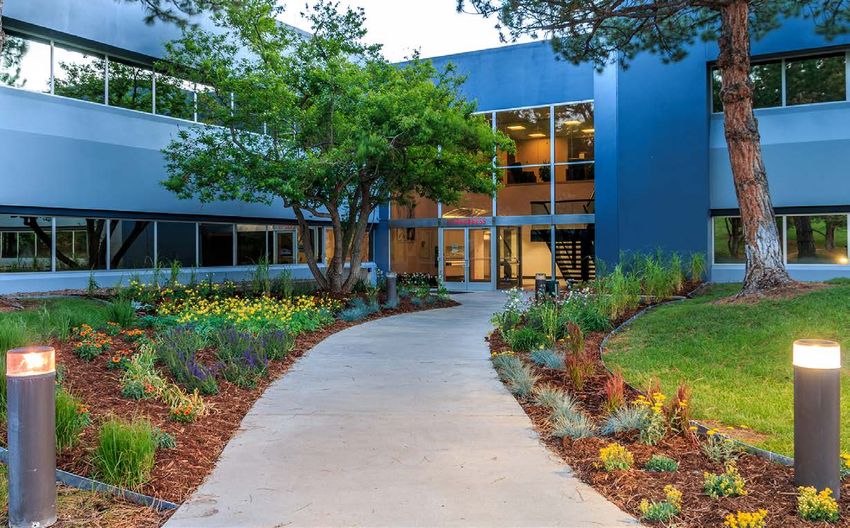
E x ec u t i v e S u m m a ry                                                                                                              E x ec u t i v e S u m m a ry

In vest m e nt highl ights
Inverness Business Park
A multi-tenant professional office building offering both large and small suites to accomodate a variety
of tenants. Located within the Inverness Business Park, tenants can enjoy the myriad of amenities offered
to tenants of the district.

Healthy Submarket Fundamentals
The Inverness submarket recorded an average direct rental rate of $25.47 PSF. While still elevated, the
vacancy rate was close to three year lows entering the fourth quarter of 2019, buttressed by several
large blocks of space recently being occupied by tenants.

 Superior Accessibility
     23 Inverness Way is ideally located within the Inverness Business Park, just north of E-470 and C-470,
      and minutes east of I-25. The business park has two foot bridges to allow access to both Dry Creek
         and Park Meaodws Light Rail Stations. With the building being accesible via Light Rail, I-25 to
           the West, and C-470 & E-470 to the South, it is located in prime position for quick commute to
             the entire Denver Metro area.

                          Highly Amenitized Area
                                23 Inverness Way East provides close proximity to an abundance of amenities.
                                 Additional retailers, restaurants, hotels, parks, and entertainment venues are located
                                    just minutes away at Park Meadows Mall, Centennial Promenade, Colorado
                                      Athletic Club, and within Inverness Business Park.

                                         Secure Long-Term Cash Flow and value add potential
                                            23 Inverness Way East, at 97.59% occupancy, offers investors the
                                              opportunity to acquire an ideally located, Southeast Denver office asset
                                                with secure, increasing cash flow. This asset also offers investors the
                                                  opportunity to add value by increasing existing below market rental
                                                    rates.

                                                              23 Inverness Average      Submarket         Market
                                                                  In-Place Rents         2-4 Star         Overall

                                                                   $22.13/SF            $25.47/SF        $28.57/SF

10 - 2 3 I n v e r n es s Way E as t                                                                                      N av p o i n t R e a l Es tat e G r o u P - 11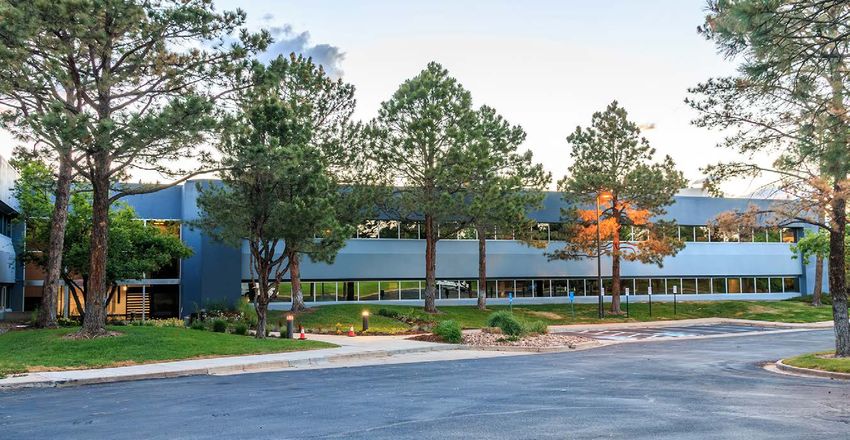
p ro p ert y D es cript io n
                               Propert y Descript ion - 2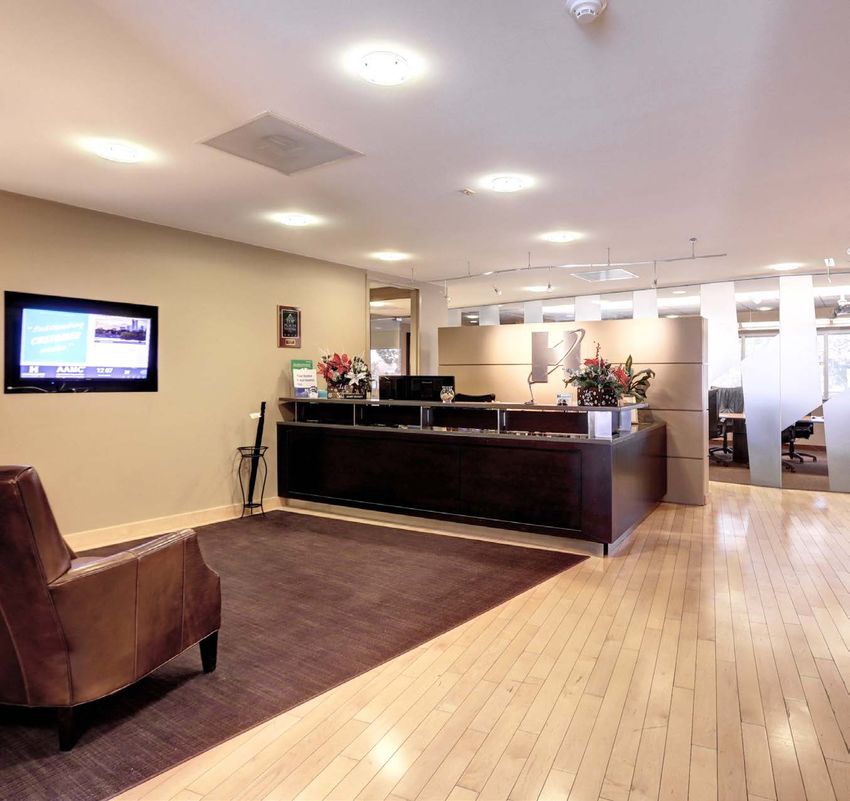
property Description
p ro p ert y D es cript io n
a p p r ox im at e ly $1. 7 m il l ion in r e c e n t imp rovements
p rop e rty d esc ri pti on • New Roof in 2019
Building Details
Address Year of Construction Zoning
• Several HVAC Units Replaced in 2017
23 Inverness Way East 1981 I-1, Englewood
Englewood, CO 80112
Building Type Year Renovated Parcel Number • Common Area and Bathrooms Remodeled in
Office 2019-2020 2075-35-3-05-005 2019-2020
Rentable Area Site Size Parking • New TI and Lighting in 2019-2020
56,391 RSF 4.67 Acres 4.21 per 1,000 SF
• New Slurry Coat on Parking Lot in 2020
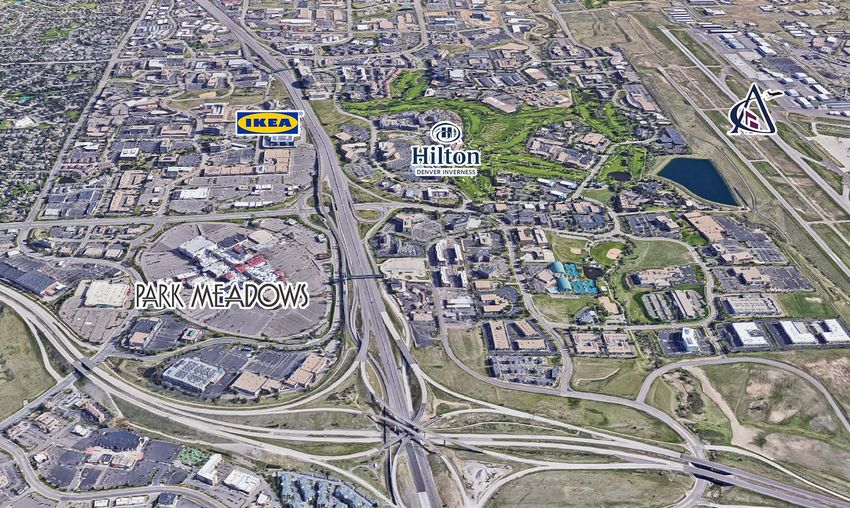
• Located in the prestigious Inverness Business Park
• Ample parking • Building Exterior Repainted in 2020
• Well maintained with professional landscaping and outside seating area
• Minutes from Park Meadows Mall, Colorado Athletic Club, and Inverness
Hotel & Conference Center
• Close Proximity to Light Rail Stations
N av p o i n t R e a l Es tat e G r o u P - 15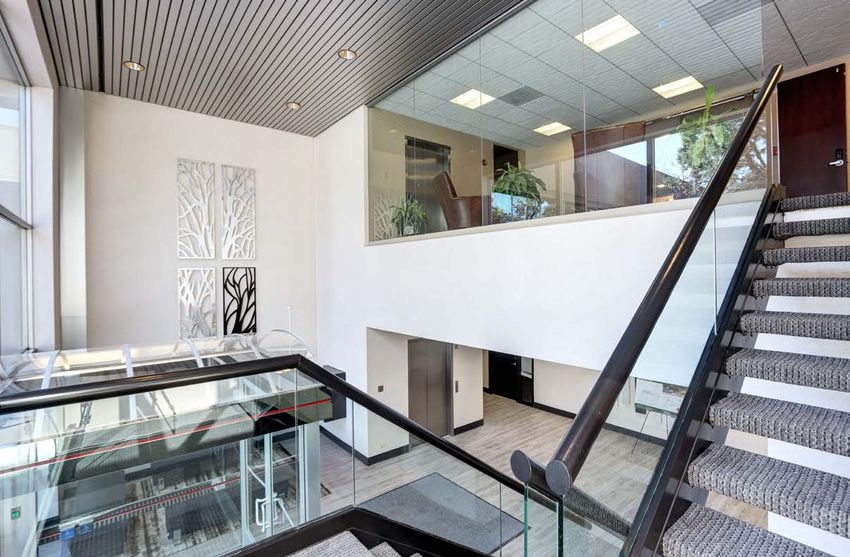
property Description                                                                   property Description

Po t e n t i a l Out parcel Ups i de

                                       • Potential outparcel could be subdivided
                                         to a user or investor to build an 8,000-
                                         10,000 SF flex/office/industrial building

                                       • Tight Inverness Submarket vacancy
                                         accompanied by strong rental rates would
                                         make site desirable if marketed

                                       • Preliminary feedback from Inverness
                                         Metro District very positive for potential
                                         subdivision

16 - 2 3 I n v e r n es s Way E as t                                 N av p o i n t R e a l Es tat e G r o u P - 17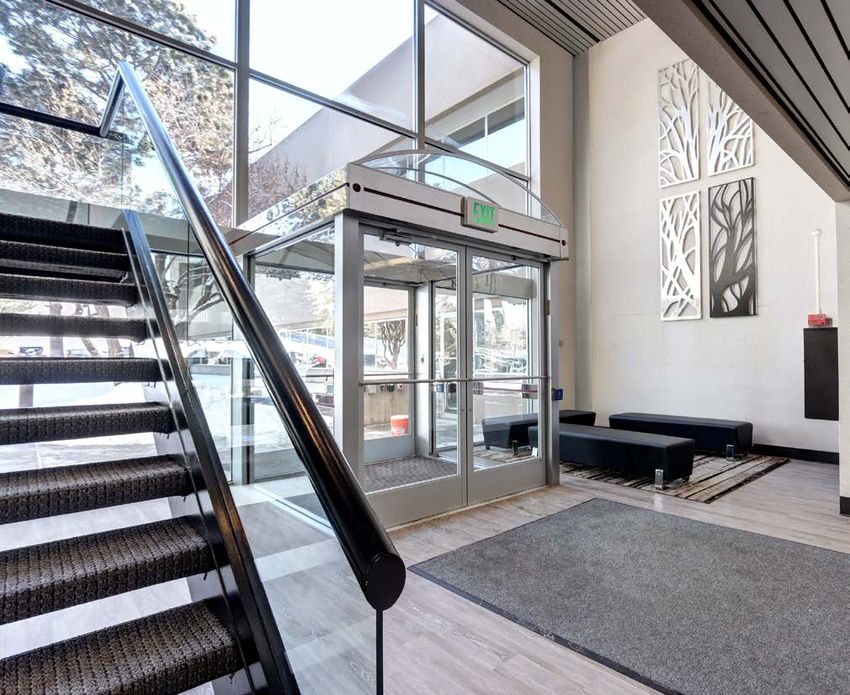
property Description                                                                                                                                                                            property Description

pro p e rt y Loc at ion

                                            36

                                                                               25
                                                 119                                                      76
                                                                                              85

                                                                   287
                                       36

                                                                                                                                                 229K +/- VPD
                                                                               70
                                                                                    E470

                119

      E470
                                                                         36

                                                 93
                                                                                     270
                                                       58

                                                                                                                                                                              property
                               6
                                                               6                                               70
                                       70

                                                                                            225
                                                                                                                                   34K +/- VPD
                                                                                                   E470

                                                            C470

                                                                              85

                                                                                             property
                         285                                                           25

                                                                                                                    109K +/- VPD

                                                                                                                                                                46K +/- VPD

18 - 2 3 I n v e r n es s Way E as t                                                                                                                                          N av p o i n t R e a l Es tat e G r o u P - 19
property Description property Description
Te n a n t s - long t e r m cr edi t anchor ha m m e r sm ith va lue s
Excellence Integrity
Hammersmith Management Inc. Comes from focused There’s never a wrong
At Hammersmith®, we specialize in full service Community Association Management. One of a select effort and inner time to do the right
few to hold the Accredited Association Management Company® accreditation, we were the very first strength of character. thing.
in Colorado to be awarded this prestigious designation, earning us our spot as Leaders in Community
Management® since 1981. professionalism
Working directly with Boards and Homeowners, the Hammersmith Team builds strong Communities based A quality that
on best practices in the industry. But we don’t stop there. We apply blended solutions from other industries characterizes an
to the challenges facing Associations. From hospitality standards for on-site staff, to the implementation individual and marks
of best practices in the segregation of duties within our accounting process, we continuously find, learn, the organization.
and apply the best methods to help our clients.
Partnership Life Balance
ehammersmith.com
Working together, The purpose of life is
winning together, a life balance...work
growing together. hard, play hard.
2 0 - 2 3 I n v e r n es s Way E as t N av p o i n t R e a l Es tat e G r o u P - 21property Description property Description
Te n a n t s T e na nts
COntinental Insurance Agency alliance Alternatives Pregnancy Center
The total solution for successful independent agencies. Whether you’re a captive agent or independent producer Alternatives Pregnancy Center cares for Denver-area women and men in pregnancy-
looking to start your own Insurance agency, or an existing independent agency seeking broader success, we related crisis and offers them a meaningful alternative to abortion. Following the example
provide the tools, resources & benefits that are specifically designed to help you be more successful and earn more. of Christian love, we seek to meet their emotional, physical and spiritual needs. And we
ciaalliance.com enable and encourage them to choose life every day.
youhavealternatives.org
Accumed Healthcare Research
We work with Plaintiff Attorneys to establish and defend their clients’ historical medical bills and future needs. Brave Global
We work with Life Care Planners offering in-depth solutions to their medical cost projections. And we work with
Brave Global is the church planting arm of Brave Church based in Denver, Colorado. Brave Global equips
Defence Attorneys to be the transparent solution to the reasonable cost of medical care.
pastors and ministry teams throughout the world to plant like minded churches to bring the good news of the
www.accumedintel.com
gospel of Jesus Christ to all people. Brave Media is the radio and video production arm of Brave Church that
produces media content and syndicated radio programming that is broadcast throughout the United States.
bravechurch.co/brave-global
Young Life Front Range Region
Young Life doesn’t start with a program. It starts with adults who are concerned enough about kids to go to
them, on their turf and in their culture, building bridges of authentic friendship. These relationships don’t happen
overnight — they take time, patience, trust and consistency.
Our Mission: Introducing adolescents to Jesus Christ and helping them grow in their faith.
frontrangeregion.younglife.org
2 2 - 2 3 I n v e r n es s Way E as t N av p o i n t R e a l Es tat e G r o u P - 2 3f in a n ci a l M o del
Financial Model - 3financial model
assumptions
ALL CASH SUMMARY EXPENSE ASSUMPTIONS
Property Purchase Price $8,990,000 Initial Year Expenses Per Sq. Ft. $6.93
Initial Capitalization Rate 8.23% Management Fee* 2.50%
Initial Cash-On-Cash Return 7.60% Property Taxes Annual Escalator 2.00%
Price Per Square Foot $159.42 Operating Expenses - Annual Escalator 2.00%
All Cash Ten Year IRR 8.11% Insurance Annual Escalator 2.00%
Capital Reserves Initial Year $15,000
GLOBAL ASSUMPTIONS Capital Reserve - Annual Escalator 3.00%
Total Rentable Square Feet 56,391
f in a n ci a l M o del
Holding Period 10 Years LEASE-UP OF VACANT SPACE
Analysis Start Date 5/1/2021 Total Currently Vacant Sq. Ft. 1,360
Percent Vacant of Total NRA 2.41%
LEVERAGE ASSUMPTIONS Absorption Period From 5/1/21 13 Months
Fixed Interest Rate 3.95% LeaseTerm 5 Years
Amortization Period 25 Years Tenant Improvements Per Sq. Ft. $20.00
Loan-To-Value Ratio 75.00% Leasing Commissions Per Sq. Ft. $7.50
Loan Fee 0.50% Initial Market Rent Per Sq. Ft. Market Rents
Initial Debt Service Coverage Ratio 1.74 Annual Rent Adjustment Market Rents
Initial Debt Constant 6.30%
Leveraged Ten Year IRR 15.89% Second Generation Tenants
Loan Amount 6,742,500 Initial Market Rent Per Sq. Ft. Market Rents
Annual Rent Adjustment Market Rents
INCOME ASSUMPTIONS Recovery Type Base Year
Market Rents - Initial Year $23.00 Retention Ratio 85%
Market Rents - Annual Escalator $0.50 Lease Term 5 Years
Other Income - Annual Escalator N/A Tenant Improvements Per Sq. Ft. $5.00-$10.00
General Vacancy Loss Percentage 5.00% Leasing Commissions Per Sq. Ft. $5.00
Downtime - Months Vacated: 2
Residual INCOME ASSUMPTIONS W/A: 0
Residual Capitalization Rate 8.00% Base Year Expenses
Cap Rate Decay 0.05% Seller Actuals 2015 $420,787
Cost of Sale 3.00% Seller Actuals 2018 $362,344
Seller Actuals 2019 $411,561
Seller Actuals 2020 $381,143
Seller Budget 2021 $390,889
*Long Term Management Contract in place with Hammersmith
This information has obtained from sources believed reliable. While we do not doubt its accuracy, we have not verified it and make no guarantee, warranty, or representation about it. It is your
responsibility to independently confirm its accuracy and completeness. Any projections, opinions, assumptions, or estimates used are for example only and do not represent the current or future
performance of the property. The value of this transaction to you depends on tax and other factors which should be evaluated by your tax, financial and legal advisors. You and your advisors
should conduct a careful, independent investigation of the property to determine to your satisfaction the suitability of the property for your nees. 2/23/2021
N av p o i n t R e a l Es tat e G r o u P - 27financial model financial model
m a rk e t R ent T e n a n t Sum m a ry
Current
Year Most Space $ Increase Suite Tenant SF Lease Start Lease End
Rent
100 Brave Global 6,911 1/1/2020 12/31/2024 $22.00
Year 1 $23.00 N/A 101 Alternatives Pregnancy Center 3,987 8/1/2020 1/31/2026 $22.50
102 AccuMed HealthCare Research 4,037 2/1/2020 1/31/2023 $24.00
Year 2 $23.50 $0.50
120 Continental Insurance Agency Alliance, a Wyoming corporation 3,762 5/1/2015 1/31/2025 $19.00
130 Young Life Front Range Region 3,401 10/1/2019 1/31/2023 $21.50
Year 3 $24.00 $0.50
150 &
Brave Media 3,042 6/1/2020 5/31/2024 $24.00
170
Year 4 $24.50 $0.50 160 VACANT 1,360
175 KNelson Consulting LLC 1,501 10/1/2015 1/31/2022 $24.00
Year 5 $25.00 $0.50 200 Hammersmith Management Inc. 28,390 3/1/2017 11/30/2026 $19.00
56,391 $22.13
Year 6 $25.50 $0.50
Year 7 $26.00 $0.50
w e i gh t e d ave rage l e a s e t e rm (o c c u p i e d s pac e ) : 5 .0 2 y e a r s
Year 8 $26.50 $0.50 Brave Global - 12%
l
Year 9 $27.00 $0.50
Alternatives Pregnancy Center - 7%
l
Year 10 $27.50 $0.50
Year 11 $28.00 $0.50 Hammersmith Management Inc. - 50% g
fAccuMed HealthCare Research - 7%
fContinental Insurance Agency Alliance - 7%
Le a s e u p Sc he d ul e
2023 j
Square Month Starting Tenant Lease Young Life Front Range Region - 6%
Suite Bumps Term
Footage Leased Rent Improvements (PSF) Commissions j
j Brave Media - 5%
SUITE 160 1,360 13 $23.50 $0.50 $20.00 $7.50 5 Years h VACANT - 3%
KNelson Consulting LLC - 3%
Total 1,360
This analysis is part of a package and is subject to the same conditions set forth in the disclaimer located in the Table of Assumptions.2/23/2021
*See Rent Roll pages 34/35
This analysis is part of a package and is subject to the same conditions set forth in the disclaimer located in the Table of Assumptions. 2/23/2021
2 8 - 2 3 I n v e r n es s Way E as t N av p o i n t R e a l Es tat e G r o u P - 2 9financial model financial model
Ex p e n se s r e a l e state ta x a ssum ptio ns
2019 2020 2021 BUDGET YEAR PAY- ASSESSED
TAX YEAR ACTUAL VALUE 2 MILL LEVY 4 OTHER TAXES DUE TAXES PSF 1
ABLE VALUE 3
OPERATING EXPENSES ACTUALS 2 /SQ. FT. 1 ACTUALS 2 /SQ. FT. 1 ESTMATE 2 /SQ. FT. 1
2019 2020 $3,863,000 $1,120,270 94.480 $3,880 $109,723 $1.95
JANITORIAL $52,027 $0.92 $45,443 $0.81 $45,840 $0.81
2020 2021 2 $3,863,000 $1,120,270 97.583 $3,984 $113,303 $2.01
JANITORIAL SUPPLIES $6,871 $0.12 $4,496 $0.08 $5,400 $0.10
2021 2022 2 $6,500,000 $1,885,000 97.583 $3,984 $187,928 $3.33
TRASH REMOVAL $3,204 $0.06 $7,537 $0.13 $5,256 $0.09
GENERAL REPAIRS AND MAINTENANCE $10,627 $0.19 $15,577 $0.28 $10,716 $0.19
2022 2023 2 $6,500,000 $1,885,000 97.583 $3,984 $187,928 $3.33
PARKING LOT MAINTENANCE $2,600 $0.05 $0 $0.00 $1,000 $0.02 2023 2024 2 $8,500,000 $2,465,000 97.583 $3,984 $244,526 $4.34
ROOF REPAIR $0 $0.00 $0 $0.00 $1,000 $0.02 2024 2025 2 $8,500,000 $2,465,000 97.583 $3,984 $244,526 $4.34
PLUMBING REPAIR $379 $0.01 $2,090 $0.04 $750 $0.01
REAL ESTATE TAX NOTES
ELECTRICAL REPAIR $0 $0.00 $6,047 $0.11 $3,000 $0.05 (1) $/psf amounts based on property rentable square footage in the Table of Assumptions
(2) Actual values for future years are estimates only. In Colorado, Actual Values used to determine Real Estate Taxes for commercial properties are re-appraised
HVAC REPAIRS AND MAINTENANCE $0 $0.00 $20,752 $0.37 $3,996 $0.07 every odd year using comparable sales from the previous 2 years. (i.e. the 2019 reappraisal year uses sales between 7/1/2016 - 6/30/2018 for Tax Years 2019 and
2020).
DOORS / LOCKS / KEYS $3,420 $0.06 $2,253 $0.04 $360 $0.01 (3) ASSESSED VALUES assume no change to the 1982 Gallagher Amendment which sets the current Assessment Rate at 29% for commercial.
(4) MILL LEVY is assumed to remain flat for future years
WINDOW WASHING $1,710 $0.03 $3,400 $0.06 $3,500 $0.06 (5) Future Tax Years not shown on this page are assumed to increase per the rate in the Table of Assumptions.
$1,040 $0.02 $0 $0.00 $0 $0.00
E xpir atio n Sc h e dule
INTERIOR PLANT CARE
HVAC MAINTENANCE CONTRACT $6,170 $0.11 $2,938 $0.05 $6,180 $0.11
ELEVATOR $2,889 $0.05 $2,037 $0.04 $2,400 $0.04
AREA EXPIRING (SF)
FIRE PROTECTION $1,881 $0.03 $2,921 $0.05 $2,710 $0.05 FISCAL YEAR NUMBER OF UNITS
TOTAL ANNUAL (AS % OF NRA) CUMULATIVE (AS % OF NRA)
LANDSCAPING MAINTENANCE $14,354 $0.25 $7,063 $0.13 $18,350 $0.33
PEST CONTROL $600 $0.01 $600 $0.01 $1,008 $0.02 2022 1 1,501 2.66% 2.66%
SNOW REMOVAL $22,929 $0.41 $24,825 $0.44 $26,000 $0.46 2023 2 7,438 13.19% 15.85%
PARKING LOT SWEEPING $0 $0.00 $0 $0.00 $0 $0.00
2024 0 0 0.00% 15.85%
METAL REFINISHING $5,198 $0.09 $344 $0.01 $0 $0.00
2025 3 13,715 24.32% 40.17%
EXTERIOR LIGHTING $1,255 $0.02 $120 $0.00 $180 $0.00
GAS AND ELECTRIC $84,193 $1.49 $74,324 $1.32 $84,000 $1.49 2026 1 3,987 7.07% 47.24%
WATER AND SEWER $10,637 $0.19 $9,362 $0.17 $7,200 $0.13 2027 1 28,390 50.34% 97.59%
SECURITY $12,020 $0.21 $0 $0.00 $0 $0.00
2028 0 0 0.00% 97.59%
ADMINISTRATIVE FEES $1,588 $0.03 $2,530 $0.04 $2,087 $0.04
2029 0 0 0.00% 97.59%
OTHER EXPENSES
2030 0 0 0.00% 97.59%
MANAGEMENT FEE 3 $15,849 $0.28 $21,013 $0.37 $28,269 $0.50
2031 0 0 0.00% 97.59%
REAL ESTATE TAXES $99,018 $1.76 $109,723 $1.95 $113,303 $2.01
INSURANCE $0 $0.00 $15,748 $0.28 $18,384 $0.33 2032 0 0 0.00% 97.59%
SUBTOTAL 8 55,031 97.59% 97.59%
TOTAL OPERATING EXPENSES $411,561 $7.30 $381,143 $6.76 $390,889 $6.93
VACANT 1 1,360 2.41% 100.00%
OPERATING EXPENSE NOTES
(1) $/psf amounts based on property rentable square footage in the Table of Assumptions TOTAL 9 56,391 100.00% 100.00%
(2) Initial Year Estimate based on Ownership 2021 Budget unless otherwise noted below.
(3) Management Fee is a percentage as defined in the Table of Assumptions. This analysis is part of a package and is subject to the same conditions set forth in the disclaimer located in the Table of Assumptions.2/23/2021
3 0 - 2 3 I n v e r n es s Way E as t N av p o i n t R e a l Es tat e G r o u P - 31financial model financial model
Cas h Fl o w C a sh F lo w
Per Sq. Ft. FY 2022 FY 2023 FY 2024 FY 2025 FY 2026 FY 2027 FY 2028 FY 2029 FY 2030 FY 2031 FY 2032
INCOME
BASE RENTS $20.87 $1,176,794 $1,191,495 $1,218,404 $1,246,971 $1,293,628 $1,327,200 $1,369,736 $1,405,366 $1,442,628 $1,483,988 $1,529,182
LESS LAG VACANCY (0.66) (37,034) 0 0 0 0 0 0 0 0 0 0
RENT ABATEMENTS (2,877) (7,282) 0 (8,617) (2,580) (16,634) (6,041) 0 (9,990) (2,991) (19,283)
EFFECTIVE BASE RENT 20.16 1,136,883 1,184,213 1,218,404 1,238,354 1,291,048 1,310,566 1,363,695 1,405,366 1,432,638 1,480,997 1,509,899
EXPENSE REIMBURSEMENTS 0.31 17,368 87,869 90,298 138,044 123,477 85,529 32,884 37,536 46,528 52,607 47,671
GROSS INCOME 20.47 1,154,251 1,272,082 1,308,701 1,376,398 1,414,525 1,396,095 1,396,580 1,442,901 1,479,166 1,533,604 1,557,570
GENERAL VACANCY (0.42) (23,487) (63,604) (65,435) (68,820) (70,726) (69,805) (69,829) (72,145) (73,958) (76,680) (77,878)
TOTAL INCOME 20.05 1,130,764 1,208,477 1,243,266 1,307,578 1,343,799 1,326,291 1,326,751 1,370,756 1,405,208 1,456,924 1,479,691
EXPENSES
OPERATING EXPENSES 4.10 230,933 235,552 240,263 245,068 249,969 254,969 260,068 265,269 270,575 275,986 281,506
MANAGEMENT FEE 0.50 28,269 30,212 31,082 32,689 33,595 33,157 33,169 34,269 35,130 36,423 36,992
PROPERTY TAXES 2.01 113,303 187,928 187,928 244,526 244,526 249,417 254,405 259,493 264,683 269,976 275,376
INSURANCE 0.33 18,384 18,752 19,127 19,509 19,899 20,297 20,703 21,117 21,540 21,971 22,410
TOTAL EXPENSES 6.93 390,889 472,443 478,399 541,793 547,990 557,840 568,345 580,149 591,928 604,356 616,284
NET OPERATING INCOME 13.12 739,875 736,034 764,867 765,785 795,809 768,451 758,406 790,608 813,280 852,567 863,407
CAPITAL COSTS
TENANT IMPROVEMENTS 2.04 30,020 114,992 0 167,376 49,630 199,291 113,942 0 184,797 54,796
LEASING COMMISSIONS 0.91 11,258 51,183 0 78,230 23,197 83,725 53,255 0 86,373 25,611
CAPITAL RESERVES 0.27 15,000 15,450 15,914 16,391 16,883 17,389 17,911 18,448 19,002 19,572
TOTAL CAPITAL COSTS 1.00 56,278 181,625 15,914 261,998 89,709 300,405 185,108 18,448 290,171 99,978
OPERATING CASH FLOW 12.12 683,597 554,410 748,954 503,788 706,099 468,045 573,298 772,160 523,109 752,589
ACQUISITION COST/RESALE Acquisition
ACQUISITION COST (8,990,000) 0 0 0 0 0 0 0 0 0 0
All Cash IRR
PROPERTY RESALE (NET) 0 0 0 0 0 0 0 0 0 10,469,210
CASH FLOW BEFORE DEBT (8,990,000) 683,597 554,410 748,954 503,788 706,099 468,045 573,298 772,160 523,109 11,221,799 8.11%
FINANCING
LOAN PRINCIPAL 6,742,500 0 0 0 0 0 0 0 0 0 (4,802,529)
Leveraged IRR
DEBT SERVICE AND LOAN FEES (33,713) (424,842) (424,842) (424,842) (424,842) (424,842) (424,842) (424,842) (424,842) (424,842) (424,842)
CASH FLOW AFTER DEBT (2,281,213) 258,755 129,568 324,112 78,946 281,257 43,203 148,456 347,317 98,267 5,994,427 15.89%
Capitalization Rate 8.23% 8.19% 8.51% 8.52% 8.85% 8.55% 8.44% 8.79% 9.05% 9.48%
Unleveraged Cash-On-Cash Return 7.60% 6.17% 8.33% 5.60% 7.85% 5.21% 6.38% 8.59% 5.82% 8.37%
Leveraged Cash-On-Cash Return 11.34% 5.68% 14.21% 3.46% 12.33% 1.89% 6.51% 15.23% 4.31% 14.37%
Debt Service Coverage Ratio 1.74 1.73 1.80 1.80 1.87 1.81 1.79 1.86 1.91 2.01
Annual Growth in Base Rents 1.25% 2.26% 2.34% 3.74% 2.60% 3.20% 2.60% 2.65% 2.87%
This analysis is part of a package and is subject to the same conditions set forth in the disclaimer located in the Table of Assumptions.2/23/2021
3 2 - 2 3 I n v e r n es s Way E as t N av p o i n t R e a l Es tat e G r o u P - 3 3financial model financial model
Fl oo r p l a n F lo o r pla n
Fiscal Years Beginning 5/1/2021
Alternatives
Continental Insurance Brave Pregnancy AccuMed Healthcare
Agency Alliance Media Center Research
ELEV.
Brave
Media
Brave Global
Expirations
Knelson 2021 2027
Consult-
ing LLC Young Life Front 2022 2028
Range Region 2023 2029
Vacant 2024 2030
2025 2031
2026 Vacant
Hammersmith Managment
Expirations
2021 2027
2022 2028
2023 2029
2024 2030
2025 2031
2026 Vacant
3 4 - 2 3 I n v e r n es s Way E as t N av p o i n t R e a l Es tat e G r o u P - 3 5financial model financial model
Rent R oll R e nt R o ll
AS OF 5/1/2021
Rentable Lease Current Rent Escalations
% of Security Rate/RSF/ Expence
Tenant Suite Square Monthly Base Notes Base Year
Total SF Deposit Yr Reimb. Type
Footage Commence Expiration Rent Increase Date
Brave Global 100 6,911 12.3% 1/1/2020 12/31/2024 $12,670.17 $12,670.17 $22.00 $12,814.15 1/1/2022 95% Gross Up Provision. Base Year 2020
$12,985.13 1/1/2024
Alternatives Pregnancy Center 101 3,987 7.1% 8/1/2020 1/31/2026 $7,600.00 $7,475.63 $22.50 $7,548.72 2/1/2023 Two, three year options to renew at 2.00% annual escala- Base Year 2020
$7,625.14 2/1/2024 tions.
AccuMed HealthCare Research 102 4,037 7.2% 2/1/2020 1/31/2023 $7,064.75 $8,074.00 $24.00 $8,158.10 8/1/2021 95% Gross Up Provision. FSG
$8,242.21 8/1/2022
Continental Insurance Agency Alliance, a Wyoming corporation 120 3,762 6.7% 5/1/2015 1/31/2025 $5,799.75 $6,113.25 $19.50 $6,270.00 2/1/2022 Management Fees shall not exceed 4.0% of gross rents for Base Year 2015
$6,426.75 2/1/2023 the building.
$6,583.50 2/1/2024
Young Life Front Range Region 130 3,401 6.0% 10/1/2019 1/31/2023 $6,093.46 $6,164.31 $21.75 $6,235.17 2/1/2022 95% Gross Up Provision. Base Year 2020
Brave Media 150 & 170 3,042 5.4% 6/1/2020 5/31/2024 $6,200.00 $6,084.00 $24.00 $6,147.38 6/1/2022 Two, three year options to renew at rates defined in Lease Base Year 2020
$3,210.75 6/1/2023
VACANT 160 1,360 2.4%
KNelson Consulting LLC 175 1,501 2.66% 10/1/2015 1/31/2022 $27,000.00 $3,002.00 $24.00 Management Fees shall not exceed 4.0% of gross rents for Base Year 2015
the building.
Hammersmith Management Inc. 200 28,390 50.3% 3/1/2017 11/30/2026 $49,682.50 $45,542.29 $19.25 $46,725.21 3/1/2022 95% Gross Up Provision Base Year - 2018
$47,908.13 3/1/2023 $6.42 STOP
$48,499.58 3/1/2024
$49,682.50 3/1/2025
SF Per Leases 56,391 100.0% $122,110.63 $95,125.65 $22.13
This analysis is part of a package and is subject to the same conditions set forth in the disclaimer located in the Table of Assumptions. 2/23/2021
3 6 - 2 3 I n v e r n es s Way E as t N av p o i n t R e a l Es tat e G r o u P - 37Locat io n Ov erv ie w locat ion Overview - 4
lo cat i o n ov e rv i e w
Locat ion & M a rk e T

                         Colorado State Rankings
    Ov erv ie w

                              #1 State for Labor Supply
                                          Forbes
                                                                                         T he r e ’s so m e th in g spe c ia l a b o u t co l o ra d o
                                                                                         Maybe it’s something to do with our air; but people who live and work here have a zest for life and the drive to
                                   2nd Most Educated State                               think boldly. Innovators, makers, large corporations and Fortune 500 have already discovered that Colorado does
                                               US Census                                 business better. When companies choose to do business in Colorado, they know that it means they’ll be able to tap
                                                                                         into our invigorated workforce, partner with innovative executives, reach global markets, and collaborate with a

                                        2nd Best State for Jobs                          business-friendly government that has their bottom line in mind. Sure, we’ve got storybook scenery, blue skies for
                                                                                         days and endless recreational opportunities, but we also have one of the most resilient economies in the nation.
                                                     Wallethub
                                                                                         In fact, Colorado is the fastest growing economy and 5th best in the US. We continually top the charts for job and
                                                                                         economic growth, and with an unemployment rate below the national average, Colorado is being recognized as

                                              4th Best State Economy                     one of the best places in the nation to do business. Companies ranging from established corporations to cutting-
                                                                                         edge startups are enjoying the state’s abundant labor supply that is highly-educated and skilled, while employees
                                                           Business Insider
                                                                                         are finding well-paying opportunities with leading companies in Colorado’s key industries.

                                                   5th Most Innovative State
                                                                     Wallethub

                                                           8th Best State for Business
                                                                              Forbes

                                                                                                                                                                                N av p o i n t R e a l Es tat e G r o u P - 41
lo cat i o n ov e rv i e w lo cat i o n ov e rv i e w
de n v e r me t ro de nve r m e tr o
Denver is situated in the high plains at the eastern edge of the Rocky Mountains, which protect An excellent quality of life is critical to the attraction and retention of Denver’s dynamic workforce,
the city from severe winter weather. These mountains, reaching higher than 14,000 feet, are the essential to successful and growing businesses and industries. Denver is a magnet for energetic
dominant feature of the area. The South Platte River bisects the city, and many creeks, small lakes, people in all walks of life for several key reasons. Living in Denver offers reasonable commute
and reservoirs grace the metropolitan area. Denver’s climate is semiarid and relatively mild, with times, phenomenal recreational opportunities, a mild 4-season climate, excellent cultural facilities,
more sunny days than either Miami, Florida or San Diego, California. Although visitors must make spectacular scenery, world-class school systems, and an overall healthy populace, that combined
some adjustment to the high altitude, they find that the area’s low humidity makes even the highest makes the Denver area and its front range neighbor cities, an unrivaled and ideal place to call home.
and lowest temperatures seem less extreme. Colorado has abundant artistic & cultural resources with broad public and private support. The
Living in Denver affords an enviable quality of life that makes it one of the best places to work state is a national leader in funding for the arts, which are greatly supported by the private and non-
and raise a family. Denver offers a panoramic view of the Rocky Mountains, the nation’s largest profit sectors. A small sales tax set aside for culture and the arts was recently renewed by Colorado
public park system, and 300 days of sunshine a year. Recreation and an active lifestyle are huge, voters to assure continued enhancement to the community life in Colorado. The Denver Performing
and this is why Denver residents are among the nation’s healthiest. Living in Denver offers distinct Arts Complex is the largest facility of its kind under one roof, outside of New York City. Red Rocks
advantages for individuals and families that you won’t find elsewhere! Amphitheater is a world-renowned concerts venue. Living in Denver provides music and performing
Denver is the gateway to the Rocky Mountains. It has four distinct seasons, but overall has arts festivals that include something for everyone - pop, rock, classical, jazz, bluegrass and country
an exceptional climate year-round! Spring is typically very pleasant with cool nights and an western, along with ballet, opera, Broadway, and several excellent regional theaters.
occasional brief snow. Summer is warm, not hot, with many very comfortable evenings and Camping, fishing, hiking, biking . . . Colorado is home to one of the fittest populations in the US.
nights. Fall seems to last for months, and is the favorite season of many living in Denver. What are all these people doing to stay active and healthy? Just about any outdoor activity you
It’s not unlikely to have nice comfortable weather throughout. Winter brings a contrast of can think of, including skiing, boarding, hiking, biking, kayaking, camping and climbing. The Denver
sun and snow. Storms are short-lived, and snow melts rapidly. Occasionally Denver has area boasts the nation’s largest public park system with thousands of acres of open space available
an extended period of snow days, but that is not the norm. Most Winters see typical snow for personal use. The Rocky Mountains are just minutes away and offer an amazing diversity of
days that come and go quickly, and Denver has recorded over 300 days of sunshine every mountain peaks and valleys, forests and rivers, as well as old mining and ghost towns. Denver also
year. The Denver Metro Area is renowned for its overall nice weather, while the mountain offers outstanding diversity in culture, music, nightlife, food, art and architecture along with major
areas and ski resorts receive significant annual snowfall, enabling Denver area residents to enjoy professional sports teams including football, baseball, hockey, soccer and basketball.
an active outdoor lifestyle year round. Professional Sports Venues
• Denver Broncos Football - Mile High Field
Me t ro Denver R ankings • Colorado Rockies Baseball - Coors Field
• Colorado Mammoth Lacrosse - Pepsi Center
1 st Best Large Airport in the U.S. • Colorado Rapids Soccer - Dick’s Sporting Goods Park
The Wall Street Journal Night Life Denver locals are customarily a friendly bunch—all that sun and natural splendor create
2
obvious reasons to be cheerful. Add wine, beer and liquor to the mix, and Denverites can be
nd Best Place to Live in the U.S.
US News & World Report positively jolly. A historical mining town with a long history of drinking and saloons, Denver nightlife
is today a varied scene.
5 th Best City for Working Women
Magnify Money
6 th Most Desirable City for Millennials
Business Insider
8 th Best Place to Start a Career
Wallethub
4 2 - 2 3 I n v e r n es s Way E as t N av p o i n t R e a l Es tat e G r o u P - 4 3lo cat i o n ov e rv i e w lo cat i o n ov e rv i e w
de n v e r me t ro r e gio n a lism
Legend has it that first building ever constructed in Denver was a drinking establishment and with a high brewery The region has a long history of getting big projects done. In the last three decades, they
count per capita, Denver specializes in select microbrews and authentic breweries with a local, Western flavor diversified their oil and gas-dependent economy, spearheaded construction of the nation’s
LoDo, or Lower Downtown, is a hip enclave of see-and-be-seen bars alongside packed sports bars. And saloons only new airport in the past 25 years, and rolled on the nation’s largest, single transit build out.
still have their place, albeit in this century they sport names like Martini Ranch. In the center of the country, The Metro Denver Economic Development Corporation (Metro Denver EDC), the nation’s first
Denver restaurants showcase the various influences of America’s regional cuisines, including Ted’s Montana regional economic development entity, operates under a Code of Ethics. The Metro Denver EDC
Grill and authentic Louisiana cuisine at Gumbo’s. A world-class city with a Western flavor, Denver restaurants and its predecessor organizations – the Greater Denver Corporation and the Metro Denver Network
also specialize in international cuisine. In the West, known for ranches and rural landscapes, steak houses, barbecue – have been working and acting regionally since the mid-1980s.
and contemporary American cuisine dominate the Denver restaurant landscape. Asian, Latin and Continental Denver
Today, the Metro Denver region is recognized nationally and internationally for its collaborative approach
restaurants do still rank among Denver’s most popular dining spots, including Prima Restaurant for traditional Italian. For
toward economic development. With community-wide support for the arts, bipartisan dialogue among the
one of the chicest dining experiences in Denver, try downtown Denver’s Kevin Taylor restaurant for an artful fusion of French
region’s mayors, and proactive efforts to attract major sporting events, teamwork and enthusiasm abound in
and American cuisines in a sophisticated setting.
Metro Denver.
Shopping opportunities abound with the city offering something for everyone. Perhaps the most prominent feature of
Economic development without boundaries An affiliate of the Denver Metro Chamber of Commerce, the Metro
Denver shopping is The 16th Street Mall, an outdoor pedestrian shopping promenade over a mile long and connecting
Denver EDC is the nation’s first and only truly regional economic development entity, bringing together more than
downtown Denver with LoDo, Denver’s trendy Lower Downtown district. The free shuttle that runs the shopping mile, lined
70 cities, counties, and economic development agencies in Metro Denver and Northern Colorado. Each of the Metro
with boutiques, restaurants and galleries, is a mobile bonus for Denver shoppers. Just south of downtown Denver, Cherry
Denver EDC’s economic development partner organizations is committed to the economic vitality of the entire region, and
Creek is one of Denver’s most affluent neighborhoods and is home to some of Denver’s most well heeled shopping, boutiques
is able to communicate the benefits of Metro Denver first—and individual communities second.
and galleries. An up and coming shopping district in Denver, Colfax Avenue, once lined with manicured mansions in Denver’s
mining heydays, now boasts hip local boutiques and a flock of new Denver restaurants. For those looking for rugged Western Metro Mayors Caucus Issues like air quality, water use, growth, and transportation don’t stop at the city limits. The Metro
fashion, Denver boasts many Western wear outlets. Mayors Caucus was formed in 1993 by a small group of Denver area mayors. Given the multi-jurisdictional nature of many
of their core challenges, the founders saw the need for a forum for regional dialogue from which consensus solutions might
Located just north of Downtown, RiNo (River North Art District) includes a remarkable concentration of creative
emerge. The Caucus, a voluntary and collaborative regional association of mayors, quickly grew to 27 members in its first
businesses: architects, art galleries, ceramicists, designers, furniture makers, illustrators, authors, wineries, distilleries,
year. The Metro Mayors Caucus has since grown to include 40 cities and towns from across the Denver metropolitan region.
small-batch breweries, painters, media artists, performance artists, sculptors, photographers, urban agriculture, and an
Nationally recognized for its ability to unite around difficult issues for its decision making, the Caucus was the first of its kind
array of studio spaces.
in the nation and has served as the model for many similar organizations around the country.
While retaining its industrial roots, the RiNo neighborhood is now fertile ground for arts and artists. The River North Art
The Rockies and beyond . . . Denver’s central location, just 346 miles west of the exact geographic center of the country—is
District is dedicated to promoting and supporting the people and businesses that reside in the area.
an ideal position for future economic development and growth. Analysts predict that the U.S. population is shifting south
and west, with future concentration expected from California to Utah and to the Gulf coast in Texas. Sitting at the center of
this region, Denver is becoming a high-technology research, development, and manufacturing hub for the entire Southwest.
Denver’s downtown banking district consists of major national and international institutions. The city is the transportation
hub for a large portion of the western United States; consumer and industrial goods are transported by air, rail, and
truck through Denver to more than 30 million people annually. Denver is a Foreign Trade Zone, providing advantages to
companies involved in international trade. To its advantage, the city’s geographic position and location within the Mountain
Time Zone make it the largest city in the United States to offer one-bounce satellite uplinks with real-time connections to 6
of 7 continents in one day.
Metro Denver is a national model for regional cooperation in economic
development, political action culture, and sports.
4 4 - 2 3 I n v e r n es s Way E as t N av p o i n t R e a l Es tat e G r o u P - 4 5lo cat i o n ov e rv i e w lo cat i o n ov e rv i e w
m e t r o d enver region i ndus try clu s ter s tr a n spo r tatio n
Denver International Airport is the largest airport in the United States by total
6 of the 13 clusters/subclusters grew more than 20% between
Aerospace area and has the longest public use runway in the United States. In 2012 Denver
2012 and 2017.
International Airport was the 15th busiest airport in the world by passenger traffic and the
fifth-busiest airport in the world by aircraft movements. The Airport is the main hub for low-cost
12 of the 13 clusters and subclusters posted positive Aviation
carrier Frontier Airlines and commuter carrier Great Lakes Airlines. It is also the fourth-largest hub
employment growth between 2016 and 2017.
for United Airlines. The airport is a focus city for Southwest Airlines. Since commencing service to Denver in
Banking & Finance January 2006, Southwest has added over 50 destinations, making Denver its fastest-growing market.
6 of the 13 clusters/subclusters ranked among the top 10 in
The RTD FasTracks Program is a multi-billion dollar comprehensive transit expansion plan to build 122 miles of new
employment concentration, led by aerospace. Aerospace
commuter rail and light rail, 18 miles of bus rapid transit, 21,000 new parking spaces at light rail and bus stations, and
employment increased for the 3rd consecutive year in 2017 Beverage Production
enhance bus service for easy, convenient bus/rail connections across the eight-county district.
and grew at its fastest pace since 2007.
Source: www.metrodenver.org, www. rtd-fastracks.com
Aviation was the fastest growing cluster in the 9-county region Cleantech
in 2017 in terms of employment, increasing 5.7% from 2016- Denver is the transportation hub for a large portion of the western United States; consumer and industrial
2017. goods are transported by air, rail, and truck through Denver to more than 30 million people annually.
Fossil Fuels
IT-Software was the fastest growing cluster from 2012-2017,
rising 32.2% compared with 26.1% nationwide. Healthcare & Wellness
The investments subcluster had the highest average wage of
all 13 clusters/subclusters, totaling $156,770 in 2017. Insurance
Investment
IT-Software
Medical Devices
Pharma
Telecomm
WWW.METRODENVER.ORG
4 6 - 2 3 I n v e r n es s Way E as t N av p o i n t R e a l Es tat e G r o u P - 47lo cat i o n ov e rv i e w lo cat i o n ov e rv i e w
In vern e ss demographics
Located just 15 miles south of downtown Denver and
about 30 miles from Denver International Airport (DIA), Inverness R ankings 1 MILE 3 MILES 5 MILES
#1
the upscale commercial and residential community of POPULATION Population
Best Suburb for Young Professionals in Col-
Inverness, Colorado is managed by the Inverness Met- 2024 Projection 664 65,708 221,885 206,019
orado
ropolitan Improvement District. The District maintains 2019 Estimate 581 60,740 206,019
a beautiful recreational park featuring manicured,
garden walkways and sports amenities within Inver-
#5 Best Suburb in Colorado
Growth 2019-2024
Growth 2010-2019
14.29%
148.29%
8.18%
23.52%
7.70%
17.67%
ness. This unique environment for business owners,
employees, and residents provide unity with work and 10 th Best Place to Retire in Colorado Average Household Size
Median Age
1.7
35.6
2.3
37.2
2.5
38.0
5 Year Growth
a healthy lifestyle. www.niche.com/places-to-live/inverness-arapahoe-co/ HOUSEHOLD INCOME 7.70%
Keeping the neighborhood top notch, the District is re- 2019 Average $131,309 $119,934 $129,822
sponsible for ongoing maintenance services as well as regional transportation and other improvement projects for HOUSING
common area roadways and landscaping. With easy access to the County Line and Dry Creek Light Rail Stations, Median Home Value $398,836 $435,135 $435,672
Park Meadows Retail Resort, restaurants, The AAA Four Star Inverness Hotel and Conference Center featuring a EMPLOYMENT
4,500 square foot day spa and 18-hole Preston Maxwell championship golf course, Colorado Athletic Club, and Employed 68.53% 70.67% 70.22%
the upscale residential communities at The Vallagio at Inverness, there is a great sense of pride and excitement in College Degree
5 Mile Radius
Non-Workforce 29.40% 27.58% 28.01% 57.74%
this growing community for many good reasons.
Unemployed 2.07% 1.68% 1.63%
Source: CoStar Realty Information Inc.
www.invernessmetro.com
Income
$129,822
5 Miles
3 Miles
1 Mile Businesses
15,048
10 Minute Drive
Employees
208,652
4 8 - 2 3 I n v e r n es s Way E as t N av p o i n t R e a l Es tat e G r o u P - 4 9m a rk e t Ov erv ie w
marke t Overview - 5m a r k e t ov e rv i e w m a r k e t ov e rv i e w
de n ver offic e mar ket r epor t de n ve r o f f ic e m a r k e t r e po r t
Denver’s office fundamentals are buoyed by skyrocketing job growth in tech. Demand for office space remains near
L E ASING
cyclical highs as new supply continues to pump into the market. Denver, and greater Colorado as a whole, is one of Denver office fundamentals are arguably stronger now than they have
the biggest winners of this expansion due to its robust workforce, quality of living, and favorable business climate. been at any other point during this cycle. Even with elevated levels of
Absorption & Deliveries In Thousands SF
construction, new office space has leased at a rapid clip and keeps va-
As companies compete for top talent in one of the strongest labor markets in the past 50 years, high-end office cancies near cyclical lows. Fueled by outsized growth in techsector jobs,
space in burgeoning Downtown can give employers an edge. Strong demand for 4 & 5 Star space is driving Denver’s Denver’s trailing 12-month net absorption remains well above the long-
healthy rent gains. The top three submarkets for rent growth are located in Downtown (CBD, LoDo, and Platte Riv- term average. This comes after a cyclical high in deliveries in 2018, and
er), where tech firms are clustering. over 1.3 million SF in deliveries entering 19Q4.
Denver’s recipe for consistent office demand isn’t complex, but its ingre-
Speculative development has ramped up, and tenants considering major expansions or relocations have far more dients are ideal. Over 45% of residents 25 years or older hold a bache-
options today than they did a few years ago. Still, conditions remain well-controlled relative to historical averages lor’s degree, US News & World Reports ranked Denver America’s 2nd
(and exceptionally tight for low- to mid-tier office space). It is not uncommon for at least half of office space under best place to live, and few major metros are as probusiness.
construction to be in core downtown submarkets. Most of Denver’s positive absorption is derived from 4 & 5 Star properties. Landlords are leveraging employer sentiment that modern, highly
amenitized space is critical in the battle for talent. Strong leasing at large scale spec developments, both downtown and in the suburbs, has
Despite some volatility in the energy sector, Denver’s well-diversified economy continues to support the office sec- 4 & 5 Star vacancies on track to compress for the second straight year. Supplementing demand is sustained interest from tenants across the
tor. Several larger firms that initially started out in smaller co-working spaces (such as Slack and Facebook) have country.
since announced major permanent leases—a testament to the metro’s deep and talented labor pool. LoDo remains one of Denver’s premier office submarkets, and national tenants have shown a willingness to pay top dollar to be there. This was
Source: CoStar Realty Information Inc. made clear when a rare, ultra-large block of space was pounced on by VF Corp, which inked a deal for all 285,000 SF at 1551 Wewatta on a
Locat ion & M a rk e T
key indicators lease that runs through 2030. The Fortune 260 company, which owns outdoor brands The North Face, JanSport, and Altra, will relocate its
Ov erv ie w
headquarters to Denver from Greensboro, NC. VF Corp plans to move into their new space in 2020 as it fills 800 tax-subsidized jobs.
The two locally-headquartered tenants that vacated 1551 Wewatta, Gates Corporation and DaVita, moved into new construction projects,
both on the border of the LoDo submarket (Gates at 1144 Fifteenth in the CBD, and DaVita at 16 Chestnut in Platte River). For DaVita, which
occupied just over half of 1551 Wewatta, the move perpetuates a major expansion in the area. The firm will take almost 350,000 SF at 16
Chestnut, which delivered in late 2018.
A host of startups have set up operations in the metro in recent years, but a major tech player is also expanding in the metro. Amazon is slated
to move into 73,000 SF at 1515 Wynkoop in LoDo aiming to hire 400 employees by the end of the year. Two fast-growing tech companies from
the Bay Area also recently expanded into the Denver market: Gusto (formerly Zen Payroll) announced it will add 1,000 jobs over the next few
years, and Slack plans to hire over 500.
WeWork is all in on Downtown Denver. In the past eighteen months, the embattled co-working provider has leased more than five-hundred-thou-
sand square feet at eight new locations. WeWork’s footprint will near 700,000 SF, which would make it the largest leaseholder in Downtown
Denver.
Despite a rapid expansion, WeWork accounts for less than one-half, of one percent, of all occupied office space in the Denver area. Co-working
tenants in general only account for about one percent of office space. So even if you believe co-working is destined to fail, the overall impact will
be minimal in Denver.
12 Month Vacancy 12 Month 12 Month Denver’s energy-sector exposure has impacted fundamentals in the past—particularly downtown, where these tenants are clustered—and
Deliveries in SF Rate Absorption in SF Rent Growth could again in the future.After posting negative net absorption of 900,000 SF from 15Q2 through 17Q3 (a period where crude oil prices
1.4 M 10.2% 1.5 M 2.0%
dipped to decade lows), the submarket rebounded with positive net absorption of over one million SF from 17Q4 through 18Q4 (or +700,000
SF excluding moveins at the recently delivered 1144 Fifteenth). Many of the sublet spaces placed on the market during the oil downturn have
now been leased, often by energy tenants.
Oil price volatility has reared its head again in 2019, and several local energy companies have announced significant layoffs. Whiting Petro-
leum, which last August signed a lease for 135,000 SF at the Wells Fargo Center in the CBD submarket and is scheduled to move in by the end
of 2019, cut 254 employees this summer. The oil company had already marketed a small portion of its space for sublease prior to the layoff, and
more could become available in the near future.
Suburban submarkets will continue to play a role in Denver’s robust absorption trends. As downtown submarkets have grown increasingly un-
affordable and congested for employees, or no longer fit the lifestyle of Millennials with families, companies have found plenty of talent in pe-
ripheral areas of the metro. Cigna moved into 136,000 SF in the Colorado Blvd/I-25 submarket in 19Q1; Lockheed Martin occupied 106,000
Sf in the Highlands Ranch submarket in 19Q1; and tech firm Conga settled into 88,000 SF in the Broomfield County submarket in 19Q2. Major
upcoming move-ins in suburban submarkets over the next 12 months include Newmont Mining taking 145,000 SF in 2020 in the Denver Tech
Center, and Cochlear Americas occupying 161,000 SF this fall on a sublease space that had sat vacant since 18Q3.
Source: CoStar Realty Information Inc.
N av p o i n t R e a l Es tat e G r o u P - 5 3m a r k e t ov e rv i e w m a r k e t ov e rv i e w
de n v e r o ffic e mar ket r epor t de nve r o f f ic e m a r k e t r e po r t
Ren t Market Rent Growth (YOY) Sa l es
Strong demand for office space in Denver has fueled rent Investment firms from coastal markets are making the biggest splashes in Denver’s office market in 2019. Rock solid fundamentals and
growth that outperforms the national average. Downtown a rapid rise in job growth in the professional, scientific, and technical service sector has made Colorado’s capital a sound bet for major
submarkets (CBD, LoDo, and Platte River) are driving the players. Overall investment activity remains elevated after a record-breaking 2018, even though pricing and cap rates are flattening
metro’s annual gains. Entering 19Q4, office rent growth in out.
each downtown submarket exceeded the Denver average. With robust demand and rent growth trends, the headline trades have unsurprisingly involved institutional assets in the CBD. The
While the total square-footage under construction is off of submarket has been responsible for about one-third of the metro’s sales volume dating back to 2018. CBD generated more than $600
cyclical peaks, the amount of speculative development at million in sales volume through early August, and last year the submarket garnered $1 billion worth of trades.
all-time highs, notably in the greater downtown area with- One of the biggest trades this year was Los Angeles based Rising Realty Partners’ June acquisition of the 600,000 SF Civic Center Pla-
in a mile of Union Station. Even with peak levels of specu- za in the CBD submarket for $143 million ($239/SF). The 4-Star asset was originally built in 1994, but received more than $7.3 million
lative construction, the availability rate, which includes in renovations beginning in 2017, which included an upgraded lobby, elevators, restrooms, HVAC, and an expanded conference center.
available under construction space, has been within 100 MARKET RENT PER SQUARE FOOT Civic Center Plaza received LEED Gold certification after receiving upgrades. The building was more than 95% occupied with tenants
basis points of cycle lows in 2019. including WeWork, State of Colorado, and the Regional Transportation District.
Stronger oil prices for most of 2018 helped to remove a Another major asset in the CBD bought by a coastal investment firm commanded an even higher price per SF. Miami-based Rialto
glut of bargain-rate space sublet in the CBD. However, Holdings acquired 410 17th St, a 436,000 SF building, for $127.3 million ($292/SF) in June. Rialto plans to make capital improvements
volatile oil prices in 2019 have already led to layoffs in the to the common areas of the 1977 built property, which reportedly had no deferred maintenance. The cap rate, based on actual income
energy sector, namely Whiting Petroleum’s elimination of and expenses, was in the neighborhood of 5.3%. Existing tenants include Bonanza Creek Energy, Weatherford US, and Brownstein
254 positions at the end of July. Whiting is scheduled to Hyatt Farber Schreck.
move into 135,000 SF at Wells Fargo Center in the CBD Source: CoStar Realty Information Inc.
by the end of the year. centennial submarket office sales
With an expanded roster of high-end options hitting the
market at the same time oil move-outs began in earnest,
existing high-end properties experienced the most acute rent growth slowdown several years ago.
The story has changed in the past six quarters. Highend rent growth has continually trended upwards, and 4 & 5 Star rent growth is
exceeding that of low- to mid-tier product.
Strength at the high-end likely stems from a rebounding economy, more incentive to upgrade space in an exceptionally tight labor mar-
ket, along with more money to potentially throw into office space via corporate tax cuts.
Over 1.1 million SF of co-working space has opened or been leased in Downtown Denver since the start of 2015, and there are reasons
to expect this could be a factor in the slowdown for 1-3 Star properties.
First, while co-working space is often in high-end or brand new buildings, the space-per-employee is a fraction of traditional office
space. For example, WeWork’s 147,000 SF Tabor Center location has 2,200 desks, or about 68 SF per-worker assuming 100% occu-
pancy. That’s about one-quarter of the 250 SF perworker average for traditional office space. The result is that WeWork and other
co-working providers can offer significantly lower costs ‘per-employee’ than 4- and 5- Star market rents would otherwise imply.
Second, co-working has provided a compelling new option for smaller tenants, tenants that drive a majority of leasing activity for low-
to mid-tier offices: Over 95 percent of new leases signed in 2018 for 1- to 3-Star offices in Downtown Denver were for less than 10,000
square feet. In square-footage terms, these smaller deals represented more than 60% of space leased.
Source: CoStar Realty Information Inc.
Subject Submarket Market YTD Average Average
Market Property 2-4 Star Overall Volume Price Per SF Cap Rate
Rent PSF
$21.71 $25.45 $28.33 22.7 M $234 7.5%
5 4 - 2 3 I n v e r n es s Way E as t N av p o i n t R e a l Es tat e G r o u P - 5 5m a r k e t ov e rv i e w
c o n f ide n tia lity & d i s cl a i me r
The property described herein is being offered for sale in an “as-is, where-is” condition and Seller
and NavPoint Real Estate Group make no representations or warranties as to the accuracy of the
information contained in this Offering Memorandum. Information within this Confidential Offering
Memorandum was obtained from sources we believe to be reliable; however, we have not verified
its accuracy and make no guarantee, warranty or representation about it. The enclosed materials
include highly confidential information and are being furnished solely for the purpose of review by
prospective purchasers of the interest described herein. Neither the enclosed materials nor any in-
formation contained herein is to be used for any other purpose or made available to any other per-
son without the express written consent of the Seller.
It is submitted subject to the possibility of errors, omissions, change of price or other conditions, prior
sale, lease or financing, or withdrawal without notice. We include projections, opinions, assumptions
or estimates for example only, and they may not represent current or future performance of the
property. You and your tax and legal advisors should conduct your own investigation of the property
and transaction. This Confidential Investment Summary is subject to the terms of the property trans-
action. The use of this Offering Mem randum and the information provided herein is subject to the
terms, provisions and limitations of the confidentiality agreement furnished by Agent prior to deliv-
ery of this Offering Memorandum. Reproduction, disclosure, or distribution of this document and its
contents is strictly prohibited without the expressed written consent of NavPoint Real Estate Group.
©2019, NavPoint Real Estate Group.
5 6 - 2 3 I n v e r n es s Way E as t N av p o i n t R e a l Es tat e G r o u P - 57offering memorandum
23 Inverness Way East | Englewood, CO
Matt Call
Principal
303.956.5781
matt.call@navpointre.com
Matt Kulbe
Brokerage Services
720.635.4591
matt.kulbe@navpointre.com
Jeff Brandon
Brokerage Services
303.870.4091
jeff.brandon@navpointre.comYou can also read