OIL, GAS AND THE CLIMATE: An Analysis of Oil and Gas Industry Plans for Expansion and Compatibility with Global Emission Limits
←
→
Page content transcription
If your browser does not render page correctly, please read the page content below
OIL, GAS AND
                THE CLIMATE:
                 An Analysis of Oil and Gas Industry Plans
                     for Expansion and Compatibility with
                                     Global Emission Limits

December 2019
“It is the urgent responsibility and moral obligation of wealthy
fossil fuel producers to lead in putting an end to fossil fuel
development and to manage the phase-out of existing production.”

Quote from The Lofoten Declaration (lofotendeclaration.org),
calling for leadership towards a phase out of fossil fuel production,
signed by over 700 organisations in 80 countries.

CAN Rac
CLIMATE ACTION
      NETWORK
                 RÉSEAU ACTION
                 CLIMAT
EXECUTIVE SUMMARY
Key Findings 2
Oil and Gas, and the Carbon Budget 3
THE OIL AND GAS INDUSTRY PLANS TO INCREASE CARBON EMISSIONS 4
Publicly Listed Companies are Largely Responsible 5
Companies with the Largest Expansion Plans 5
The Five-Year Threat: Oil and Gas Expansion Around the World 6
Country Profiles 8
A BETTER FUTURE IS POSSIBLE: PHASING OUT EXISTING AND
PLANNED OIL AND GAS EXTRACTION IS FEASIBLE AND JUSTIFIED 11
First Movers: Governments are Starting to Lead 12
CONCLUSION: THE TIME FOR TRUE CLIMATE LEADERSHIP IS NOW 13
A Role for Civil Society 13
Governments Need to Address the Threat of Oil and Gas Production 13
Investors Must Stop Financing Projects That Undermine Climate Goals 13
Oil, Gas and the Climate: An Analysis of Oil and Gas Industry Plans for Expansion and Compatibility with Global Emission Limits 1EXECUTIVE SUMMARY
This data briefing analyzes the expansion plans of the oil and gas industry and assesses the compatibility with Paris
climate goals. We primarily focus on the global expansion threat over the next five years (2020 to 2024). This short-term
focus illustrates the urgent need for government, investor, business, and civil society action to chart a different course –
to stop licensing and permitting new production and infrastructure and instead manage a swift and just phase-out of oil
and gas extraction.
In terms of the global threat, three different metrics are summarized:
1. The investment the oil and gas industry intends to sink into developing new oil and gas fields and shale wells
between 2020 and 2024, which creates a carbon lock-in effect out to 2050;
2. The new production that would result from these expansion projects; and
3. The total cumulative carbon dioxide emissions that new financial investment decisions made over the next
five years could unlock in coming decades.
Key findings
• Carbon emissions from oil and gas in operating fields and mines globally would push the world beyond 1.5°C
of warming and make it impossible to meet our global obligations under the Paris Agreement. This is true even
if global coal use were phased out overnight, and cement emissions were drastically reduced.
• Over the next five years, from 2020 to 2024, oil and gas companies are set to invest a further USD 1.4 trillion
in new oil and gas extraction projects.1,2 The majority of this investment will be in shale and offshore oil and gas.
• New financial investment decisions over this five-year period have the potential to unlock more than
148 GtCO2 from currently undeveloped reserves3 before 2050, equivalent to building over 1200 new average
U.S. coal-fired power plants.4
• In the near-term – looking just at production from expansion projects over the next five years – North America
accounts for 85% of new supply.5 U.S. oil and gas expansion by itself will make it impossible for the rest of the
world to manage the safe, equitable and necessary decline of oil and gas production by 2050.
• Every major International Oil Company (IOC) has sanctioned new oil and/or gas projects that are not Paris
Agreement compliant. Twenty-five companies are responsible for nearly 50 percent of the production to 2050
resulting from new expansion of oil and gas in the next five years.
• A well-planned phase-out of oil and gas production that considers the needs of workers and communities
impacted by fossil fuel developments must start now to avoid climate breakdown and a deferred economic
collapse. This does not mean turning off the taps overnight. Rather, it means taking climate limits seriously and
intentionally planning to wind-down fossil fuel extraction at the pace required to meet them. An intentional and
thoughtful phase-out approach makes it possible to create transition plans that are socially just and economically
sound.
2 Oil, Gas and the Climate: An Analysis of Oil and Gas Industry Plans for Expansion and Compatibility with Global Emission Limits• First Mover governments and institutions must continue to establish a new standard for climate leadership
and ambition by:
• Implementing bans on licenses, contracts, and permits for new oil and gas exploration and development, as is the
case in Costa Rica, France, New Zealand and Belize.
• Rapidly phasing out finance and subsidies for fossil fuel production. For instance, Swedfund excluded all oil, gas,
and coal finance in 2017, Agence Francaise de Development excluded nearly all upstream and midstream oil and
gas in 2019, the World Bank will exclude upstream oil and gas after 2019, and the European Investment Bank will
exclude oil, gas, and coal projects after 2021.
• Creating plans to phase out existing fossil fuel production at a pace aligned with the Paris goals, with high-income
countries leading the way.
• Developing and implementing just transition strategies for fossil-fuel-dependent regions, communities and workers
in consultation with trade unions and local leaders as investment shifts to new economic sectors.
Oil and Gas, and the Carbon Budget
The latest science from the Intergovernmental Panel on Climate Change (IPCC) indicates that we have to fundamentally
shift our energy systems away from fossil fuels to stay within the limits set by the 2015 Paris Agreement. By 2030,
global carbon emissions must be cut in half, compared to current levels, to be in range of limiting global warming to
1.5 degrees Celsius (°C).6
Even if global coal use were phased out overnight, and cement emissions were drastically reduced, carbon emissions
from the oil and gas in operating fields globally would push the world beyond 1.5°C of warming and make it impossible
to meet our global obligations under the Paris Agreement (Figure 1). Developed oil and gas fields contain approximately
510 GtCO2 out of a remaining carbon budget (as of 2019) of 540 GtCO2.7 Developed coal reserves, by comparison, are
on track to emit 425 GtCO2, as shown in Figure 1. In short, the use of all hydrocarbons—oil, gas, and coal—must be
phased out well before 2050, and we need to start on that pathway now.
Figure 1: CO2 Emissions from Developed Global Fossil Fuel Reserves, Compared to Paris Goals Carbon Budgets
1200
2°C
PARIS GOALS
1000
WELL BELOW
Coal
800
DEVELOPED PURSUING
Gt CO2
RESERVES Gas EFFORTS
600 CARBON BUDGET
1.5°C
400
Oil
CARBON BUDGET
200
Land use
change Cement
0
Emissions 1.5°C (50% chance) 2°C (66% chance)
Sources: Rystad UCube, International Energy Agency (IEA), World Energy Council, IPCC, OCI analysis 8
Oil, Gas and the Climate: An Analysis of Oil and Gas Industry Plans for Expansion and Compatibility with Global Emission Limits 3THE OIL AND GAS INDUSTRY PLANS
TO INCREASE CARBON EMISSIONS
Despite global recognition that we need to transition to a zero-carbon economy, oil companies continue to plan for
and invest in new oil and gas projects. Data from Rystad Energy, an industry consultancy, indicates that the oil and gas
industry is ignoring the significant risks of climate change, acting contrary to what is required, and instead planning to
dramatically expand oil and gas production over the next decade and beyond.
While capital expenditure (CapEx) on new oil and gas projects shrank after the low-price years of 2015 and 2016, it is
now on a steady trend upward.9 We are already seeing the effects of overinvestment in the existing fossil energy system.
In 2018, oil and gas production grew by more than 3 percent. Not surprisingly, global carbon dioxide emissions grew
by a similar amount, the sharpest rise since 2011.
Figure 2 shows the rise in capital expenditure into developing new oil and gas production since 2018. CapEx is
projected to reach USD 365 billion (real) in 2024. Between 2020 and 2024, projected CapEx spent on new oil and gas
extraction projects totals USD 1.4 trillion (real). This figure is for upstream only and does not include many billions more
expected to be spent on pipelines, export terminals and other oil and gas related infrastructure.
As a result of this investment, global annual oil and gas production is on a trajectory to rise 7% between 2019 and
2024.10 By projecting production to 2050 from assets sanctioned for development over the next five years, total oil and
gas unlocked reaches 197 billion barrels of oil and more than 1.1 quadrillion cubic feet of gas.11 This production locks in
more than 148 GtCO2 from currently undeveloped reserves,12 equivalent to building 1200 new average U.S. coal-fired
power plants.13
Figure 2: Global Upstream CaPex into New Oil and Gas Development
400
350
300
Billion USD (Real 2019)
250
200
150
100
50
-
2016 2017 2018 2019 2020 2021 2022 2023 2024
Source: Rystad Energy UCube
4 Oil, Gas and the Climate: An Analysis of Oil and Gas Industry Plans for Expansion and Compatibility with Global Emission LimitsPublicly Listed Companies Are Largely Responsible
Companies with the largest expansion plans
According to Carbon Tracker Initiative, every major International Oil Company (IOC) has sanctioned new oil and/or gas
projects that are not Paris Agreement compliant, including large European companies that are doing the most to try to
persuade investors and the public that they are responsive to climate concerns (BP, Shell, Total, Equinor).14
In our analysis, 25 companies are responsible for nearly 50 percent of the production to 2050 from investment sanctioned
in the next five years. Only four of these companies are fully state-owned, with the rest a mix of fully and partially public
companies. One of the state-owned companies, Saudi Aramco, is preparing to list in what might be the largest IPO in
history.
All of the major IOCs are on the list. All but two of them, Total and Eni, have over 50 percent of their new development
in shale plays. Shell is second only to Gazprom in the size of projected production from new development. Seven of the
top 25 are 100 percent invested in shale production.
Figure 3 shows the companies ranked by the amount of production that they would unlock through to 2050 by their new
development between 2020 and 2024. Fully state owned means companies are not listed on any stock exchange.
Figure 3: Top 25 Companies by Production Unlocked from New Development between 2020-2024
Company Production (Billion BOE) Fully State Owned Shale Percentage
GazProm 21.7 N 0%
Shell 17.7 N 60%
ExxonMobil 14.3 N 57%
Chevron 11.9 N 77%
Qatar Petroleum 11.1 Y 0%
Occidental 10.2 N 97%
PetroChina 10.0 N 54%
BP 7.4 N 53%
EOG Resources 5.7 N 100%
Saudi Aramco 5.2 Y 0%
Rosneft 5.1 N 0%
Total 4.8 N 6%
Equinor 4.3 N 27%
Abu Dhabi NOC 4.3 Y 0%
Government of Brazil 4.2 Y 0%
Encana 4.2 N 100%
Concho Resources 4.1 N 100%
Chesapeake 4.0 N 100%
Eni 4.0 N 0%
Petronas 4.0 N 20%
ConocoPhillips 3.8 N 66%
Cimarex Energy 3.6 N 100%
Antero Resources 3.6 N 100%
Pioneer Natural Resources 3.6 N 100%
CNOOC 3.5 N 11%
Total (Billion BOE) 176.4
Billion Barrel Oil Equivalent includes oil and gas.
Oil, Gas and the Climate: An Analysis of Oil and Gas Industry Plans for Expansion and Compatibility with Global Emission Limits 5Carbon Capture and Storage (CCS)
Representatives of the oil and gas industry might BECCS is similarly unappealing. Offsetting a third
challenge this analysis, arguing that increasing gas of today’s fossil fuel emissions would require land
production is consistent with climate goals15 on the equivalent almost to half of the world’s total crop-
grounds that emissions can be captured by carbon growing area,19 risking large-scale food shortages,
capture and storage (CCS) or bioenergy with CCS unsustainable freshwater use and massive habitat
(BECCS). This view is disputed by a growing
16
conversion.
number of scientists, economists and risk analysts.
As the recent IPCC report warns, “carbon dioxide Rob Bailey, formerly of Chatham House and now
removal deployed at scale is unproven, and reliance director of climate resilience at Marsh and McLennan,
on such technology is a major risk in the ability to a global professional services firm, sums up the
limit warming to 1.5°C.”17 The economics of CCS are risk of relying on unproven technological fixes.
also unfavourable, and pilot projects to date have “Speculative negative emissions technologies may
proven more costly and less effective than hoped.18 be worse than chimeras if they result in the false
comfort that continued fossil fuel emissions can
Given renewable technologies have become cheaper simply be offset, thereby diverting financial and policy
than oil and gas, the additional cost of CCS would resources from conventional mitigation.
put fossil fuels at a further competitive disadvantage. This would be reckless.20
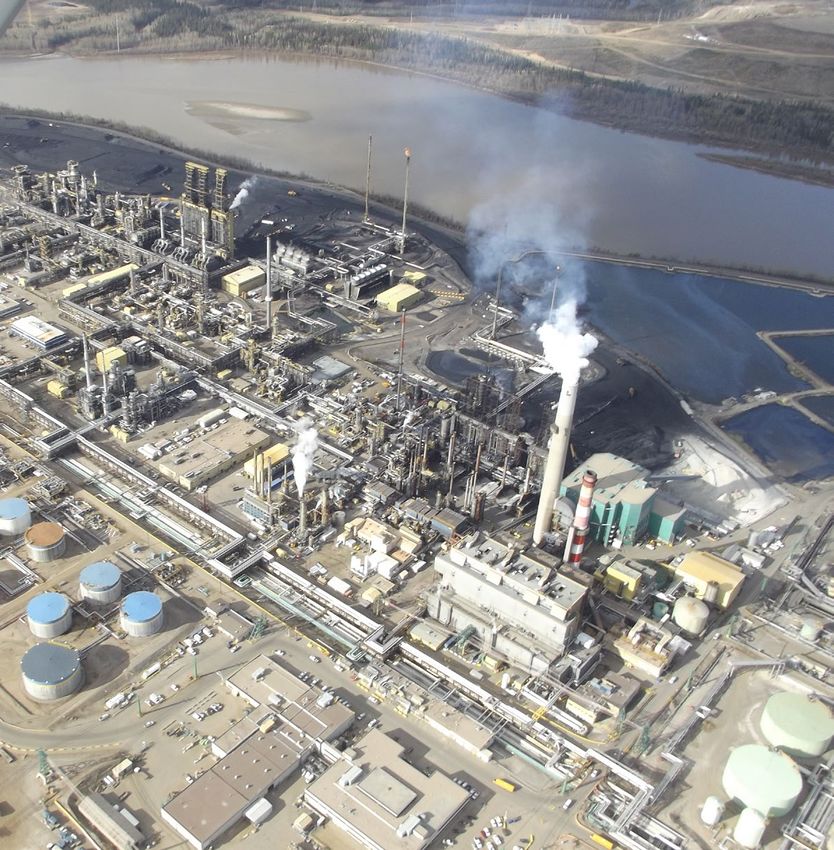
The Five-Year Threat: Oil and Gas Expansion Around the World
Map 1: Top 100 New Oil and Gas Projects (Shale and Conventional), by Projected Production, 2019-2025
Economics (MUSD real)
335 190986
Production (Million boe)
8689
210
35
Source: Rystad Energy UCube (April 2019)
6 Oil, Gas and the Climate: An Analysis of Oil and Gas Industry Plans for Expansion and Compatibility with Global Emission LimitsFigure 4: Top Countries by Projected Production from New Oil and Gas Development, 2020-2024
Focusing on just the next five years, we see a number of key countries emerge with substantial expansion plans. The
graphs demonstrate the importance of the U.S., with Canada and Argentina posing the next most risk.
a) U.S. expansion
25000
Oil Gas
20000
15000
Million boe
10000
5000
0
United Canada Argentina China Norway Australia Mexico United Brazil Nigeria
States Kingdom
b) Next top expanders
3000
Oil Gas
2500
2000
Million boe
1500
1000
500
0
Canada Argentina China Norway Australia Mexico United Brazil Nigeria
Kingdom
Source: Rystad Energy UCube
Oil, Gas and the Climate: An Analysis of Oil and Gas Industry Plans for Expansion and Compatibility with Global Emission Limits 7Country Profiles
Below are snapshots of countries with significant planned new expansion. This snapshot is not a comprehensive list
of carbon risks, as there is critical fossil fuel infrastructure and expansion on every continent that is incompatible with
the Paris climate goals. It serves to illustrate some of the key challenges globally.21 In the country profiles, we provide
a longer view of the potential climate impact of oil and gas expansion in each location, quantifying the total carbon
pollution at risk of being unlocked between 2020 and 2050.
United States of America
• North America is set to see the largest projected volumes of new oil and gas development, accounting for 85% of
global production from new development through 2024.22 U.S. oil and gas expansion by itself will make it virtually
impossible for the rest of the world to manage the safe, equitable and necessary phase-out of oil and gas production
by 2050.
• Through 2050, new drilling could unleash 120 billion tons of cumulative carbon pollution on top of 70 GtCO2 locked in
from already developed projects.23 The 120 GtCO2 from new projects is the equivalent of the lifetime carbon pollution
of approximately 1000 U.S. coal fired power plants.24
• Through 2024, over 90% of U.S. oil and gas expansion would be shale production dependent on fracking.
• The Permian Basin, centered in west Texas and southeastern New Mexico, would account for 39% of new U.S. oil and
gas production by 2050. It holds the greatest risk for new oil and gas development in the United States and in the world.25
• The Appalachian Basin, with extraction centered in Pennsylvania, Ohio, and West Virginia, would account for 19% of
new US production, while the Western Gulf Basin, including the Eagle Ford Shale play in Texas, would add 9%.26
Canada
• New oil and gas development in Canada between now and 2050 could unlock an additional 25 GtCO2, more
than doubling cumulative emissions from the sector, and equal to the lifetime emissions of more than 200 average
Canadian coal plants.27
• Although opposition and poor economics have stymied significant expansion plans, two new projects in the Alberta tar
sands have been approved in the last two years. Exxon’s Aspen Oil Sands project was endorsed in November 2018,
the first sanctioned greenfield oil sands project in five years. And in July 2019, Teck’s new Frontier Mine was
recommended by the National Energy Board but awaits Trudeau Cabinet approval. It could emit up to 4 MtCO2 each
year.28
• Shale gas extraction, particularly the Montney Shale Basin29 in British Columbia, is a major focus of the industry. They
are projected to invest CapEx totaling USD 26 billion (real 2019) over the next five years for new development in the
Montney Basin. From 2020 to 2050, new gas projects could be responsible for as much CO2 as new oil projects.
• A report from the Canadian gas industry predicts the country’s gas production could be as high as 21 bcf/d in 2040.30
The Canadian Association of Petroleum Producers projects that Canadian crude oil production will increase by 1.27
million barrels per day to 5.86 million b/d by 2035.31
8 Oil, Gas and the Climate: An Analysis of Oil and Gas Industry Plans for Expansion and Compatibility with Global Emission LimitsArgentina
• The United States Energy Information Agency ranks Argentina’s shale gas and oil resources in second and fourth
place, respectively, in the world.32
• Almost all of Argentina’s expansion plans involve shale oil and gas development in the Neuquén Basin in Northern
Patagonia, where the Vaca Muerta formation is located.
• If the Vaca Muerta fracking project receives the infrastructure investment and government support for continued
expansion, the associated cumulative emissions will quadruple by 2050, exceeding eight GtCO2 in total.33
• The drilling of new wells would unleash four times more carbon compared to existing development over the next
three decades.34
• Exploited to their maximum potential, Argentina’s shale gas reserves could eat up 11.4% of the world’s remaining
carbon budget required to keep global temperature rise to below 1.5º.35
Brazil
• Oil and gas production has grown 13% since 2015, and Brazil is planning to expand production by more than 60% by
2030, drastically increasing greenhouse gas emissions.
• New licensing and development decisions could triple the cumulative carbon impact of Brazilian production to 2050.36
• Of a potential 26 Gt of cumulative carbon pollution from Brazilian oil and gas from 2020 to 2050, more than two-thirds
is not yet committed.37
Ecuador
• Ecuador has the third-largest oil reserves in South America, largely in the Oriente Basin in the eastern part of the country.38
• Despite long-term production declines, Ecuador is pulling out of OPEC to free itself from restrictions and increase
output.39
• New development could increase cumulative carbon emissions from Ecuadorian oil and gas by just over 40% by 2050.
Guyana
• Offshore Guyana represents ExxonMobil’s largest global oil play outside the Permian Basin.
• Guyana is estimated to have reserves totaling 13.6 billion barrels of oil and 32 trillion cubic feet of gas.40
• Production is projected to reach 450,000 barrels per day by 2025, creating nearly 69 million MtCO2 per year.
• One project, the offshore Stabroek block led by Exxon, Hess, and the China National Offshore Oil Corporation,
is expected to deliver six billion barrels of oil equivalent. The first three projects under development by this partnership
alone will produce 197 million barrels of oil per year and 85 million MtCO2 in associated emissions between 2024
and 2030.41
Oil, Gas and the Climate: An Analysis of Oil and Gas Industry Plans for Expansion and Compatibility with Global Emission Limits 9Denmark
• Denmark is poised to significantly expand its North Sea oil and gas extraction from now through the early 2030s,
but 60 percent of the related emissions are not yet committed.42
• If new licenses and permitting move forward, carbon emissions from Danish-produced oil and gas would overtake
Denmark’s total expected domestic CO2 emissions from energy by mid-2025.
• Of the projected emissions, 193 MtCO2 is associated with ‘undeveloped’ fields that have been awarded licenses
already, and another 208 MtCO2 with ‘undiscovered’ fields that will require new licenses. These new projects would
increase the cumulative emissions associated with Danish oil and gas from 2020 to 2050 by 150%.43
Norway
• Norway has the fifth most aggressive near-term expansion plans in the world.
• Current projections suggest Norwegian oil production would still exceed 1.2 million barrels of oil equivalent by 2050,
and gas would be about 6,000 million cubic feet per day by 2050.44
• Despite its reputation internationally as a climate leader, the Norwegian government is pushing ahead with oil and gas
extraction inconsistent with the Paris Agreement, offering a record number of 93 blocks for oil and gas exploration in
the Barents Sea alone in 2019.
• Norway’s proposed and prospective new oil and gas fields would lead to 77% more cumulative emissions to 2050,
compared to what is in currently operating fields.
• Norway is the world’s seventh largest exporter of carbon emissions. Through its oil and gas exports, Norway is
exporting 10 times more emissions than the country produces at home.45
United Kingdom
• The UK is the second largest producer of oil and gas in Europe.
• Already operating oil and gas reserves amount to 5.7 billion barrels, while undeveloped and undiscovered fields
contain a further 14.3 billion million cubic feet per day—2.5 times the amount of oil being currently produced.46
• The government’s stated policy objective which is a legal obligation enshrined in legislation, is to maximise the
economic recovery of all UK reserves or in other words to try to extract every last drop. The government has begun to
expand production.
• Opening new fields would nearly quadruple the emissions from UK oil and gas.
• Additional emissions from expanding North Sea extraction far exceed carbon savings from the UK’s coal phase-out.
Recent subsidies for oil and gas extraction will add twice as much carbon to the atmosphere as the phase-out of coal
power saves.47
Australia
• Australia is already the second-largest liquefied natural gas (LNG) exporter in the world (behind Qatar).
• New oil and gas development in Australia threatens to double the carbon pollution enabled by the country’s oil and
gas production through 2050.
• The carbon pollution unlocked by new oil and gas extraction projects could total nearly 13 GtCO2. For context, that
would be the carbon equivalent of opening nearly three new coal mines on the scale of the controversial Adani
Carmichael project as it was originally proposed (its proposed size was reduced at the end of 2018).48
10 Oil, Gas and the Climate: An Analysis of Oil and Gas Industry Plans for Expansion and Compatibility with Global Emission LimitsA BETTER FUTURE IS POSSIBLE:
PHASING OUT EXISTING AND
PLANNED OIL AND GAS
EXTRACTION IS FEASIBLE
AND JUSTIFIED
Despite the scale of the challenge, it is possible to stop the expansion of oil and gas production and avoid the
associated carbon impacts. Expansion plans will depend on new licenses and permits from governments and a
significant buildout of new infrastructure, as well as trillions of dollars of public and private investment, much of which
civil society is or will be contesting.
Ceasing the approval of new projects would put production on a necessary, albeit insufficient, trajectory downward to
2030 (Figure 5 - blue line). Stopping industry expansion would allow production of oil and gas to fall by 13% in five years
and by just over 30% by 2030. If no new fields are developed, global extraction will flatten out for a few years, followed
by a decline of between 4% and 7% per year.49 These steps, combined with the early closure of some existing extraction
projects would put us on a path to keep warming to 1.5ºC (green line) without relying on unproven carbon-dioxide
removal technologies.
Figure 5: Global Oil and Gas Extraction with and without New Development, Compared to
Demand Aligned with 1.5°C
400
Business as usual
350
300
Primary Energy: oil and gas (EJ)
250
200
Existing fields only
1.5ºC pathway (no new development)
150
100
SR15 P1 pathway
50 Production, all fields
Production, producing & under-development fields
0
2010 2020 2030 2040 2050
Source: IPCC/IAMC 1.5°C Scenario Explorer and Data hosted by IIASA,50 Rystad Energy UCube
Oil, Gas and the Climate: An Analysis of Oil and Gas Industry Plans for Expansion and Compatibility with Global Emission Limits 11Importantly, an alternative supply of energy and materials is feasible. The declining cost of renewable energy is quickly
eliminating the financial and economic case for fossil fuels. Already, over three-quarters of the onshore wind and
four-fifths of the utility-scale solar PV project capacity due to be commissioned in 2020 should provide lower-priced
electricity than the cheapest new coal-fired, oil or gas options.51 This means renewables are now on track to replace
fossil fuel supply with a more cost-effective alternative. As the International Energy Agency (IEA) acknowledged, offshore
wind is set to be competitive with fossil fuels in the next decade, with the potential to meet Europe’s entire electricity
demand more than 10 times over. Perhaps even more importantly, the IEA sees offshore wind as matching the capacity
factors of efficient gas-fired power plants and coal-fired power plants, thereby addressing concerns over intermittency.52
The demand for fossil fuels appears set to drop faster than predicted, too. A 2019 report by BNP Paribas concluded
that “the economics of oil for gasoline and diesel vehicles versus wind- and solar-powered EVs are now in relentless
and irreversible decline, with far-reaching implications for both policymakers and the oil majors.”53 As a result of citizen
pressure, significant users of hydrocarbons such as consumer goods retailers are escalating their efforts to, for
example, use recycled materials in their products and shift to 100% renewable energy.54
First Movers: Governments are starting to lead
Many governments, especially at the local level, are stepping in to drive the transition and lead the required phase
out. The list of countries and financial actors putting precedent-setting limits on oil and gas extraction – as part of
comprehensive climate action – is growing:
• Full licensing bans or moratoria: Costa Rica (2011), France (2017)
• Partial licensing bans: New Zealand – offshore (2018), Belize – offshore (2018), Denmark - onshore and inland
waters (2018)
• Pending licensing bans: Sweden (2019)
• Removing Financing for Upstream Oil and Gas Projects: World Bank (2017; begins in 2020), Swedfund (2017),
Agence Française de Développement (2019), European Investment Bank (2019, starts 2021)
“Ensuring a liveable planet for future generations means getting serious
about phasing out coal, oil and gas. Countries such as Costa Rica, Spain
and New Zealand are already showing the way forward, with policies to
constrain exploration and extraction and ensure a just transition away from
fossil fuels. Others must now follow their lead. There is no time to waste.”
Christiana Figueres
Convenor, Mission 2020, and former Executive Secretary of the
UN Framework Convention on Climate Change
12 Oil, Gas and the Climate: An Analysis of Oil and Gas Industry Plans for Expansion and Compatibility with Global Emission LimitsOther momentum: The UK’s Conservative party announced it would introduce a moratorium on fracking in England and
Wales, if it remains in Government after December’s general election, to follow the Scottish government’s existing ban.
Other parties have announced they would ban fracking in England and Wales. The Spanish government and Irish and
Icelandic parliaments are considering bans on new oil and gas licenses. Active debates are happening in sub-national
jurisdictions: the U.S. state of California is weighing steps towards a managed decline of oil, and a growing number
of jurisdictions have banned specific types of fossil fuel development and/or infrastructure. Major insurers, banks, and
pension funds, including AXA, BNP Paribas, ING, HSBC, Sweden’s AP7, and Norway’s Government Pension Fund
Global, have begun withdrawing finance from certain types of oil extraction and pipeline projects.
It is only a matter of time that others intervene more to remove the enabling conditions, such as subsidies and permits,
that allow the oil and gas industry to expand, and instead support the development of zero-carbon economic systems.
It is vital that governments step in and do not leave it to the market economics for a number of reasons,
in particular because fossil fuel incumbents are fighting back, flooding the market with cheap hydrocarbons that
undercut clean alternatives to carbon-intensive energy, plastics and petrochemicals, thereby manufacturing demand for
their products.
Progress to date and opportunities ahead are thanks largely to one of the greatest causes for optimism: the continued
success of civil society campaigns worldwide. Given the feasibility of renewable energy and the need to dramatically
reduce the use of plastic, coordinated efforts to stop new oil and gas projects are a necessary and justified response to
the climate crisis.
Oil, Gas and the Climate: An Analysis of Oil and Gas Industry Plans for Expansion and Compatibility with Global Emission Limits 13CONCLUSION: THE TIME FOR TRUE
CLIMATE LEADERSHIP IS NOW
A Role for Civil Society
2019 has been a landmark year for civil society demanding climate action. Global scale initiatives like FridaysForFuture
and Extinction Rebellion join diverse and widespread grassroots movements around the world that are standing up to
new fossil fuel projects and infrastructure. Increasingly, these tactics are matched by initiatives engaging board rooms
and court rooms. The message is clear: there is no more time to waste, and little time for incremental or half measures.
The end of the fossil fuel era is inevitable and necessary, but how it unfolds will be determined in the coming years.
Governments and institutions must listen to the science, echoed by people-powered movements, and begin a managed
and just transition away from the fossil-fuel economy and towards the safe, clean and renewable energy that must
power this century.
Governments Need to Address the Threat of Oil and Gas Production
Governments, starting with wealthy, developed fossil fuel producing countries, must recognize that leadership on
climate change needs to include plans for a just and equitable phase out of fossil fuel production. As this report has
shown, the oil and gas industry’s plans are incompatible with what governments agreed in Paris in 2015.
Given these inconvenient realities, governments must stop the various ways in which they currently encourage
expansion: stop further exploration and licencing of new oil and gas projects; stop using export finance to enable
projects overseas; and eliminate tax breaks and other subsidies for oil and gas exploration and production.
Furthermore, governments need to invest in a just transition for workers and communities affected by a gradual phase-
out of production, with economic development strategies and support for training/retraining ensuring that Trade Unions
are involved in the process. They must also accelerate the implementation of policies that shift demand away from fossil
fuels, especially in the transportation, energy, plastics and petrochemicals sectors.
Investors Must Stop Financing Projects That Undermine Climate Goals
The role of private finance cannot be ignored. Investors must acknowledge their responsibility to align their work with
the Paris Agreement, in accordance with article 2.1.C, which states the need to make “finance flows consistent with a
pathway towards low greenhouse gas emissions and climate-resilient development.”
Oil and gas companies are set to invest USD 1.4 trillion into new oil and gas extraction over the next five years.
Banks, debt and equity investors will be key enablers of expansion. Banks alone provided USD 1.9 trillion in finance to
companies across the fossil fuel lifecycle from 2016 through 2018, with the annual total increasing each year since the
Paris Agreement was signed.55
Through divestment, shareholder engagement, and legal pressure, investors are ramping up pressure on oil and gas
companies, and the banks financing them, to align investments with the Paris goals. The debate is starting to shift. For
example, leaders at Legal & General Investment Management, the UK’s largest asset manager, issued a call last year for
oil companies “to be clear that its future is one of long-term decline.”56
It is imperative that investors build on such progress. They must not wait until 2050 to align their portfolios with the
climate goals. Rather, they must act now to ensure their current and near term investments do not enable the oil and
gas industry to build the new projects detailed in this report.
14 Oil, Gas and the Climate: An Analysis of Oil and Gas Industry Plans for Expansion and Compatibility with Global Emission LimitsAcknowledgments
Lead author: Jeff Gailus
With research and analysis from Oil Change International
The report is a project of the Global Gas and Oil Network, supported
by Oil Change International; 350.org; Center for Biological Diversity;
Center for International Environmental Law; CAN-Rac Canada;
Earthworks; Environmental Defence Canada; Fundacin Ambiente
y Recursos Naturales:FARN; Global Witness; Greenpeace;
Naturvernforbundet; Overseas Development Institute; Platform;
Sierra Club; Stand.Earth.
A project of the Global Gas and Oil Network www.ggon.org.
Oil, Gas and the Climate: An Analysis of Oil and Gas Industry Plans for Expansion and Compatibility with Global Emission Limits 15Endnotes
1 All oil and gas production data in this report is from Rystad Energy AS 16 A theoretical greenhouse gas mitigation technology which produces
UCube database, unless otherwise stated. All emissions numbers are negative carbon dioxide emissions by combining sequestration of
calculated from the Rystad production data, unless otherwise stated. CO2 by plants, bioenergy use, and storing the CO2 emitted during the
Rystad’s commercial database, called the UCube, includes past, process through geologic carbon capture and storage (CCS).
present, and future production and economics data for all of the world’s
oil and gas fields and projects (more than 65,000 in total). Historical 17 Rogelj et al., “Mitigation Pathways,” in Global Warming of 1.5°C, p. 96.
data and projections are derived from independently verified data from 18 For example, the world’s first industrial-scale CCS project, the Sleipner
company and government reports and Rystad’s own modelling, and project in Norway, started in 1996 and was assumed to be safe until it
updated monthly. Rystad provides sophisticated query tools that allow was discovered to have fractures in its caprock in 2013. The Boundary
for categorizing future production volumes according to the current Dam project in Canada, the first to install CCS at a power station,
stage of development of the resource. This allows us to analyse future was exceptionally expensive to build and has struggled to operate as
production trajectories from existing projects only, i.e., fields that are planned, suffered considerable cost overruns, and been forced to pay
already producing or under construction (or already-drilled wells, in the out for missing contractual obligations.
case of shale), compared to planned and projected expansion projects,
i.e., reserves that are not yet developed and resources projected for 19 Twelve billion metric tons of carbon dioxide extracted per year is
exploration. estimated to require a land area devoted to bioenergy of 380 to 700
million hectares, equivalent to 25 to 46 percent of total world crop-
2 These numbers are upstream (extraction) only and do not include growing area. Pete Smith et al., “Biophysical and economic limits to
billions more in transport (pipelines), processing and export facilities. negative CO2 emissions,” Nature Climate Change 6, 2015, p. 5, https://
3 82 Gt oil and 66 Gt of gas. doi.org/10.1038/NCLIMATE2870.
4 Coal plant equivalency based on U.S. Environmental Protection Agency 20 Carbon Brief, “In-depth: Experts assess the feasibility of negative
estimate (as of Sept. 2017) that the average U.S. coal plant emits just emissions,” December, 2016, https://www.carbonbrief.org/in-depth-
over 4 million metric tonnes annually, and assuming a 30-year plant experts-assess-the-feasibility-of-negative-emissions#bailey
lifetime. 21 The country profiles here are drawn from various previously published
5 This is in part because we’re looking at a short timespan and shale reports using different time frames for their analysis. Therefore some of
reserves are developed on a faster timeline than conventional projects. the numbers do not precisely tally with the earlier sections of this report.
6 IPCC, “Summary for Policymakers,” In: Global warming of 1.5°C. 22 This is in part because we’re looking at a short timespan and shale
An IPCC Special Report, [V. Masson-Delmotte et al. (eds.)], World reserves are developed on a faster timeline than conventional projects:
Meteorological Organization, 2018, p. 12, https://www.ipcc.ch/site/ 23 Rystad Energy UCube (October 2018)
assets/uploads/sites/2/2019/05/SR15_SPM_version_report_LR.pdf.
24 See footnote 12 for methodology.
7 The term “carbon budget” refers to the cumulative amount of CO2
emissions permitted over a period of time to keep within a certain 25 Kelly Trout and Lorne Stockman, Drilling Towards Disaster: Why U.S.
temperature threshold. According to the latest estimates as of the start Oil and Gas Expansion Is Incompatible with Climate Limits, Oil Change
of 2019, the total amount of CO2 in the atmosphere needs to be less International, January 2019, Section III, http://priceofoil.org/2019/01/16/
than 540 gigatonnes (Gt) for just a 50 percent chance of keeping the report-drilling-towards-disaster/.
planetary warming below 1.5°C
26 ibid.
8 Greg Muttitt, The Sky’s Limit: Why the Paris Climate Goals Require a
27 Based on CoalSwarm data on annual Canadian coal plant emissions
Managed Decline of Fossil Fuel Production, Oil Change International,
and operating units (updated in January 2019), and assuming a 30-year
September 2016, http://priceofoil.org/2016/09/22/the-skys-limit-report/
plant lifetime: https://endcoal.org/global-coal-plant-tracker/summary-
(see Chapter 2 for detailed methodology); Carbon budgets updated:
statistics/.
IPCC, Special Report on Global Warming of 1.5 Degrees (SR15), 2018,
Table 2.2, p. 108, http://www.ipcc.ch/pdf/special-reports/sr15/; Oil and 28 Sharon J. Riley, “10 things you need to know about the massive new
gas developed reserves updated: Rystad UCube, accessed 7 April 2019. oilsands mine that just got a green light,” The Narwhal, July 2918,
https://thenarwhal.ca/10-things-you-need-to-know-about-the-massive-
9 Global Witness, Overexposed: How the IPCC’s 1.5º Demonstrates
new-oilsands-mine-that-just-got-a-green-light/
the Risks of Overinvestment in Oil and Gas, April 2019, https://www.
globalwitness.org/en/campaigns/oil-gas-and-mining/overexposed/ 29 Projected to produce 2816 MBOE by 2025, and 7916 by 2030
10 Rystad Energy UCube, October 2019. 30 Canadian Society for Unconventional Resources. LNG: CANADA’S
GLOBAL. MARKET OPPORTUNITY. Canada and the Natural Gas
11 Rystad Energy UCube, October 2019.
Economy. Special Report 1 | August 2019 https://s3.amazonaws.
12 82 Gt oil and 66 Gt of gas. com/media.dailyoilbulletin.com/pdf/LNG+-+Special+Report+1+-
+August+2019.pdf
13 Coal plant equivalency based on U.S. Environmental Protection Agency
estimate (as of Sept. 2017) that the average U.S. coal plant emits just 31 Canadian Association of Petroleum Producers, 2019 Crude Oil
over 4 million metric tonnes annually, and assuming a 30-year plant Forecast, https://www.capp.ca/publications-and-statistics/crude-oil-
lifetime. forecast
14 Mike Coffin and Andrew Grant, Carbon Tracker Initiative, Breaking the 32 Diego DiRisio, Vaca Muerta Mega Project. A Fracking Carbon Bomb
Habit - Why None of the Large Oil Companies are “Paris-Aligned”, and in Patagonia, December 2017, https://www.boell.de/sites/default/files/
What They Need to do to Get There, September 2019, https://www. megaproject.pdf
carbontracker.org/reports/breaking-the-habit/
33 Rystad Energy UCube (March 2019)
15 For example see: Royal Dutch Shell, “Natural Gas: Providing More and
34 Rystad Energy UCube (March 2019)
Cleaner Energy,” https://www.shell.com/energy-and-innovation/natural-
gas/providing-more-and-cleaner-energy.html, accessed April 23, 2019
16 Oil, Gas and the Climate: An Analysis of Oil and Gas Industry Plans for Expansion and Compatibility with Global Emission Limits35 “No más contaminación en Patagonia”, Greenpeace, https://www. 47 ibid.
greenpeace.org/argentina/involucrate/no-mas-contaminacion-en-
patagonia/ 48 An expert report presented in 2014 to the Land Court of Queensland
by climate scientists Dr. Chris Taylor and Malte Meinshausen estimated
36 Rystad Energy UCube (October 2019) that “Scope 3” CO2e emissions from the Adani mine project (including
transport and combustion) would total 4.6 gigatonnes. See: http://
37 Rystad Energy UCube (October 2019) envlaw.com.au/wp-content/uploads/carmichael14.pdf.
38 U.S. Energy Information Administration, Country Analysis Brief: 49 Sea Change, p. 19:
Ecuador, October 2017, https://www.eia.gov/beta/international/
analysis_includes/countries_long/Ecuador/Ecuador.pdf 50 The data for the P1 pathway comes from the MESSAGEix-GLOBIOM
1.0 model, LowEnergyDemand scenario (Grubler et al.); These
39 Alexandra Valencia, “INTERVIEW-Ecuador sees oil output of 590,000 pathways are assessed in: Rogelj, Shindell, Jiang, et al., “Mitigation
bpd in 2020 after OPEC exit,” CNBC, October 2019, https://www.cnbc. pathways compatible with 1.5°C,” In: Global warming of 1.5°C, IPCC.
com/2019/10/03/reuters-america-interview-ecuador-sees-oil-output-of-
590000-bpd-in-2020-after-opec-exit.html 51 IRENA, Renewable Power Generation Costs in 2018, International
Renewable Energy Agency, 2019 https://www.irena.org/
40 Irina Slav, “Guyana, The New Star on the Global Oil Map”, Drillers.com, publications/2019/May/Renewable-power-generation-costs-in-2018
September 2019, https://drillers.com/guyana-the-new-star-on-the-
global-oil-map/ 52 IEA, Offshore Wind Outlook 2019, International Energy Agency, October
2019, https://www.iea.org/offshorewind2019/
41 Mark Chernaik, Carbon Footprint Assessment of Proposed Esso
Exploration and Production Guyana Limited (EEPGL) Activities in 53 Mark Lewis, Wells, Wires and Wheels, EROCI and The Tough Road
Guyana (Environmental Law Alliance Worldwide, November 2019). Ahead for Oil, BNP Paribas AM, August, 2019, https://docfinder.
bnpparibas-am.com/api/files/1094E5B9-2FAA-47A3-805D-
42 Bronwen Tucker, The Sky’s Limit Denmark: Why Denmark Must EF65EAD09A7F
Phase Out North Sea Oil and Gas Extraction, Oil Change International,
September 2019, http://priceofoil.org/2019/09/19/the-skys-limit- 54 See for example RE100 http://there100.org/
denmark-why-denmark-must-phase-out-north-sea-oil-and-gas-
extraction/ 55 Alison Kirsch et al, Banking on Climate Change: Fossil Fuel
Finance Report Card 2019, Rainforest Action Network, BankTrack,
43 Ibid. Sierra Club, Oil Change International, Indigenous Environmental
Network, and Honor the Earth, March 2019, https://www.ran.org/
44 Hannah McKinnon, Greg Muttitt, and Kelly Trout, The Sky’s Limit bankingonclimatechange2019/.
Norway: Why Norway should lead the way in a managed decline of
oil and gas extraction, Oil Change International, August 2017, http:// 56 Anton Eser and Nick Stansbury, “Oil must face its future as a declining
priceofoil.org/2017/08/09/the-skys-limit-norway-why-norway-should- industry,” Financial Times, 12 June 2018, https://www.ft.com/content/
lead-the-way-in-a-managed-decline-of-oil-and-gas-extraction/ bc84470a-6e65-11e8-852d-d8b934ff5ffa.
45 Ibid.
46 Greg Muttitt, Anna Markova, and Matthew Crighton, Sea Change:
Climate Emergency, Jobs and Managing the Phase-Out of UK Oil
and Gas Extraction, Oil Change International, Platform, and Friends of
the Earth Scotland, May 2019, http://priceofoil.org/2019/05/15/sea-
change-report/
Oil, Gas and the Climate: An Analysis of Oil and Gas Industry Plans for Expansion and Compatibility with Global Emission Limits 17You can also read