OKANAGAN COLLEGE ACCOUNTABILITY PLAN AND REPORT - 2017-18 to 2020-21 Okanagan College Transforms Lives and Communities
←
→
Page content transcription
If your browser does not render page correctly, please read the page content below

OKANAGAN COLLEGE
      ACCOUNTABILITY PLAN AND REPORT
                       2017-18 to 2020-21

Okanagan College Transforms Lives and Communities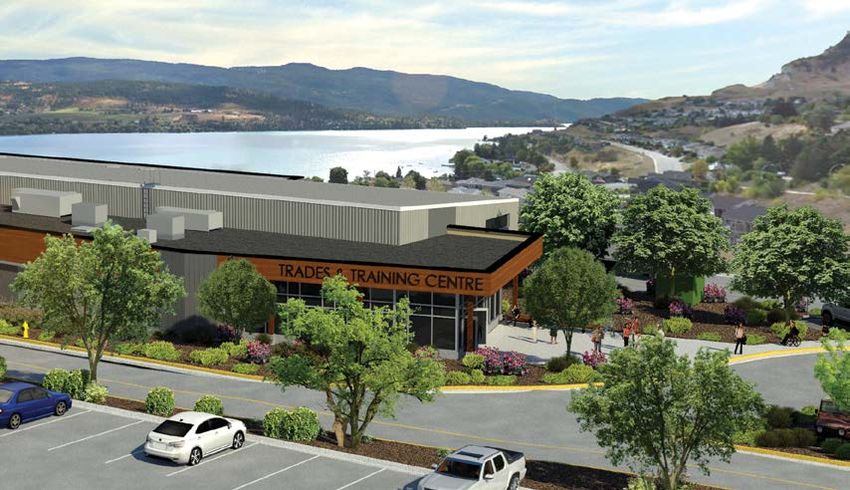
Okanagan College
                                                                                                                              2017-18 – 2020-21
         Regional Map                                                                                              Accountability Plan and Report

                                                                                                  Indicates Okanagan College campus

                                                                                                  Indicates Okanagan College Learning Centre

                                                                   REVELSTOKE             TO
                                                                                        CALGARY

                                      TO
                                   VANCOUVER
                                                                    SALMON ARM

                                                                                     TO
                                                                                  KOOTENAYS
                                    VERNON

                                  TO                         KELOWNA
                               VANCOUVER

                              SUMMERLAND

                  PRINCETON
                                                       PENTICTON
                 TO
              VANCOUVER

                                                      OLIVER
                               KEREMEOS                                  TO
                                                       OSOYOOS        KOOTENAYS

                                                   TO
                                           WASHINGTON STATE, USA

Page 2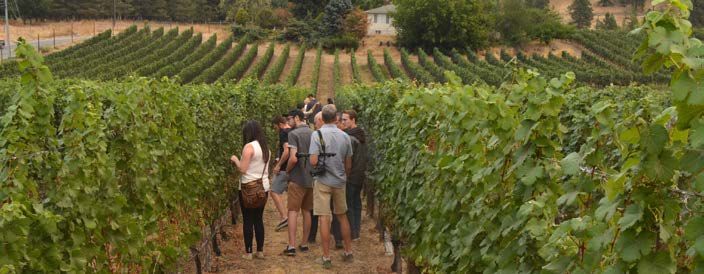
Okanagan College
                                                                                                                   2017-18 – 2020-21
         Letter from the Board Chair and the President                                                  Accountability Plan and Report

         Dear Minister Mark,

         As we submit our annual Accountability Plan and Report, it is reassuring to note that Okanagan College continues to
         grow and develop additional ways to serve our region and province. The College’s full-time equivalent (FTE) student
         count for 2017-2018 shows we are larger than ever, with 8,745 full-time equivalent students – an increase of seven per
         cent over the previous year.

         Construction is nearing completion on a new $6.2-million Trades Training Centre at our Vernon campus, supported
         with funds from the Provincial and Federal governments, as well as generous donations from our community. Workers
         are finishing construction on a new welding building on our Penticton campus, and 48 children are enjoying the Little
         Learners Academy childcare centre, opened on our campus last year. Planning is complete and work is about to
         commence on a new $18.9-million Health Sciences Centre on our Kelowna campus (expected to open in late spring,
         2020).

         Okanagan College began offering several new programs in 2017-18, including diplomas in animation and viticulture
         technology. We have grown our profile in other areas - including our aircraft maintenance engineering program - in
         response to pressing labour market needs and opportunities. We are at work on a host of other new programs that
         speak to regional economic development opportunities. Our applied research profile continues to build, supported by
         federal and industry investments.

         A significant component of our student growth is as a consequence of an increase in our international student cohort.
         In two years, Okanagan College’s FTE international numbers have increased from 539 to 960.

         Within the pages of this report, there is much evidence of the success Okanagan College has had at meeting the
         accountability expectations of the Province, our students, employees and the communities we serve. This report
         has been prepared in accordance with the Budget Transparency and Accountability Act and we are accountable for
         meeting the objectives outlined in this plan.

         Sincerely,

         Christopher Derickson                                       Jim Hamilton,
         Chair, Okanagan College Board of Governors                  President, Okanagan College

Page 3
Okanagan College
                                                                                                                              2017-18 – 2020-21
         Table of Contents                                                                                         Accountability Plan and Report

         Map of Region  .  .  .  .  .  .  .  .  .  .  .  .  .  .  .  .  .  .  .  .  .  .  .  .  .  .  .  .  .  .  .  .  .  . 2
         Letter from the Board Chair and the President  .  .  .  .  .  .  .  .  .  .  .  .  .  .  .  .  .  .  . 3
         Institutional Overview and Strategic Direction  .  .  .  .  .  .  .  .  .  .  .  .  .  .  .  .  .  .  .  . 5
         Accountability Institutional Context  .  .  .  .  .  .  .  .  .  .  .  .  .  .  .  .  .  .  .  .  .  .  .  .  .  .  . 10
         Strategic Plan - Mission, Core Values   .  .  .  .  .  .  .  .  .  .  .  .  .  .  .  .  .  .  .  .  .  .  .  .  .  .  17
         Key Directions  .  .  .  .  .  .  .  .  .  .  .  .  .  .  .  .  .  .  .  .  .  .  .  .  .  .  .  .  .  .  .  .  .  .  .  .  .  . 18
                 Supporting Learner Readiness and Success  .  .  .  .  .  .  .  .  .  .  .  .  .  .  .  .  .  .  . 19
                 Excelling in Teaching, Programming, and Applied Research  .  .  .  .  .  .  .  .  .  .  . 25
                 Working With, and Learning From, the Indigenous Community  .  .  .  .  .  .  .  .  . 29
                 Serving and Engaging the Community  .  .  .  .  .  .  .  .  .  .  .  .  .  .  .  .  .  .  .  .  .  .  31
                 Focusing on Organizational Sustainability  .  .  .  .  .  .  .  .  .  .  .  .  .  .  .  .  .  .  .  . 35
         Appendix: Performance Measures  .  .  .  .  .  .  .  .  .  .  .  .  .  .  .  .  .  .  .  .  .  .  .  .  . 37-39
         Appendix: Financial Information  .  .  .  .  .  .  .  .  .  .  .  .  .  .  .  .  .  .  .  .  .  .  .  .  .  .  .  . 40

Page 4
Okanagan College
2017-18 – 2020-21
Institutional Overview & Strategic Direction Accountability Plan and Report
Okanagan College serves a region that is more than six times the size of Canada’s smallest province, with a population
(419,077) that is nearly three times that of PEI. More than 20,000 people attended the College’s four major campuses
and nine other learning centres in academic year 2016-17 – about five per cent of the regional population.
Page 5 of 2017 Report
Okanagan College Total Headcount by Academic Year
(source: CDW Standard Reports)
25,000 10.0%
9.2% 9.1%
8.6% 8.7% 8.6% 9.0%
20,000 1535 8.0%
715 855 985 1,130
7.0%
15,000 6.0%
5.0%
10,000 17,085 16,820 17,335 4.0%
16,765 16,650
3.0%
5,000 2.0%
1.0%
1,605 1,590 1,575 1,705 1,725
0 0.0%
2012-13 2013-14 2014-15 2015-16 2016-17
Aboriginal Students Non-Aboriginal Students International % of Domestic who are Aboriginal
The College now
Page 6 of offers
2017 more than 130 programs that provide credentials, ranging from Adult Upgrading to post-
Report
baccalaureate diplomas in marketing and accounting. A significant investment in facilities and programs over the
past 13 years has resulted inOkanagan Collegebecoming
Okanagan College FTE Utilization of Targets trades training provider.
B.C.’s second-largest
Source: Supertables from AVED Finance
(*2017-18 total target is estimated)
Several programs were introduced or expanded in 2017-18 to meet student and employer needs and interests.
Those included:
115% Total FTE Utilization (excluding International) 113%
• Viticulture Technician Diploma: began in Fall 2017 111%
109% 109%
110% Diploma Program: began in Fall 2017
• Animation 108%
107% 107%
• Expansion of the Aircraft Maintenance Engineering Structures course to meet
105%industry skills needs
104%
105% 103% 103%
Work is afoot on a new applied arts degree. New programs developed and approved in 2017 include a post-
101%
100%
baccalaureate diploma in Human Resources Management, and a partnership with Brock University and UBC
100%
Okanagan to offer the Trades Technology Teacher Education Diploma program.
95% year, Okanagan College has successfully met government established FTE domestic enrolment
For the 14th
targets, and has experience significant increases in international student enrolment.
90%
6
7
8
9
0
1
2
3
4
5
6
7
8
-0
-0
-0
-0
-1
-1
-1
-1
-1
-1
-1
-1
-1
05
06
07
08
09
10
11
12
13
14
15
16
17
20
20
20
20
20
20
20
20
20
20
20
20
20
Page 5
16,650
                                                                                                                           3.0%

                        5,000                                                                                              2.0%

                                                                                                                           1.0%
                                                                                                                                  Okanagan College
                                     1,605             1,590             1,575              1,705             1,725
                           0                                                                                               0.0% 2017-18 – 2020-21
         Institutional Aboriginal
                        Overview
                            2012-13
                                  Students
                                           &Non-Aboriginal
                                               Strategic
                                             2013-14                Direction
                                                                 2014-15
                                                           Students      International
                                                                                       2015-16            2016-17 Accountability Plan and Report
                                                                                            % of Domestic who are Aboriginal

                      Page 6 of 2017 Report

                                               Okanagan College FTE Utilization of Targets
                                                       Source: Supertables from AVED Finance
                                                         (*2017-18 total target is estimated)

                        115%                           Total FTE Utilization (excluding International)                    113%
                                                                                                                   111%
                                                               109%                                         109%
                        110%                                                    108%
                                                                      107% 107%
                                                      104%                                           105%
                        105%                   103%                                          103%
                                        101%
                                100%
                        100%

                         95%

                         90%
                                   6

                                   7

                                   8

                                   9

                                   0

                                   1

                                   2

                                   3

                                   4

                                   5

                                   6

                                   7

                                   8
                                 -0

                                 -0

                                 -0

                                 -0

                                 -1

                                 -1

                                 -1

                                 -1

                                 -1

                                 -1

                                 -1

                                 -1

                                 -1
                              05

                              06

                              07

                              08

                              09

                              10

                              11

                              12

                              13

                              14

                              15

                              16

                              17
                            20

                            20

                            20

                            20

                            20

                            20

                            20

                            20

                            20

                            20

                            20

                            20

                            20
         In 2017-18, Okanagan College has met or exceeded Ministry performance measures (see pages 36-38), including the
         Ministry’s mandate letter priorities of:

           • Implementing the Skills Gap Plan,
           • Deepening BC’s talent pool in support of the technology strategy,
           • Working with government and Aboriginal communities to implement the Aboriginal Post-Secondary Education and
              Training Policy Framework and Action Plan,
           • Working with government to encourage and promote the development and use of online resource and open textbooks
              to support post-secondary affordability for students,
           • Working with government and other institutions to develop and implement a common application system,
           • Promote safe campuses,
           • Exceeding the financial targets identified in the Ministry’s three-year service plan, and
           • Maximizing the efficient use of public post-secondary administrative resource through participation in the Administrative
              Service Delivery Transformation initiative

                                                                                   AVED FTE Summary
                                                                          Target           Actual        Utilization
                                     Baseline                                  286             286           100.0%
                                     Skills Gap Plan                           592             592           100.0%
                                     Target Funded Subtotal                   878             878            100.0%
                                     Base Funded                             3,860           4,487           116.0%
                                    TOTAL                                    4,738           5,365           113.0%

         The College continues to work within the BC Taxpayer Accountability Principles.

         In its 2016-17 annual report, BC Campus reported that Okanagan College ranked third in open textbook adoption. A
         Working Group has been established at the college that focuses on Open Educational Resources and Practices, with

Page 6
Okanagan College
                                                                                                                     2017-18 – 2020-21
         Institutional Overview & Strategic Direction                                                     Accountability Plan and Report

         goals of promoting awareness and exploring ways to facilitate open educational practices in support of the College’s
         programming and teaching priorities of Okanagan College.

         College staff work on many provincial committees, including BCCAT, (co-chaired by Okanagan College President Jim
         Hamilton), and the EducationPlannerBC Governance Working Group (chaired by Dr. Andrew Hay, Okanagan College’s
         Vice President Education).

         After a provincial policy decision in mid-2017, Okanagan College employees worked diligently to adjust the Adult
         Basic Education program to a tuition-free model and to communicate that swiftly to prospective students and
         registrants in time for the fall 2017 intake.

         The College’s Strategic Plan (2016-2020) is available on the College website and is including beginning on Page 17.

         Two important strategic initiatives have been underway at the College over the past year, notably the development of
         an Internationalization Plan and an Indigenization Plan. The latter will incorporate input from the two nations (Shuswap
         and Okanagan), 10 First Nations Bands, several Friendship Centres and Metis organizations that are a part of the
         Okanagan College region. There are already outcomes from the development of the plan, including the addition of an
         Indigenous Garden on the College’s Kelowna campus and continued support for an annual PowWow and Aboriginal
         Student celebration. A tentative schedule calls for the Indigenization Plan to be complete within the next year.

         The College has been working with the Provincial Government, employers and several Bands over the past year to
         develop programming that meets Aboriginal student needs and is culturally-responsive and appropriate. Programs
         include an Aboriginal Support Worker program, a Construction Craft Worker program for Aboriginal Students,
         Introduction to Office Administration, and an Aboriginal Early Childhood Education program.

         The College’s Key Performance Indicators are           OC culinary arts
         available for public review at okanagan.bc.ca/kpis.
         Those KPIs are presented as a dashboard, but with
                                                                students were able
         links to the various sources and measures that they    to work alongside
         are derived from. In addition to Ministry-developed    11 of Canada’s best
         performance measures, the College uses a significant   chefs as part of Gold
         number of other measures, including information        Medal Plates
         drawn from participation in the Community College
         Survey of Student Engagement (CCSSE), which is
         conducted independently, as well as the College’s
         own surveys of student satisfaction and employee
         engagement.

         While full results are not yet available, the College’s
         most recent survey of students (February to April
         2018) shows that 91 per cent of students said that
         attending Okanagan College has been a good
         experience for them and 91 per cent said they would recommend their program or course to other people..

         The most recent (2017) surveys conducted through the Student Outcomes project show Okanagan College
         apprentices register 94 per cent satisfaction with their education, Bachelor Degree graduates with a 99 per cent
         satisfaction rate, and Diploma, Associate Degree and Certificate graduates with a 91 per cent satisfaction rate.

Page 7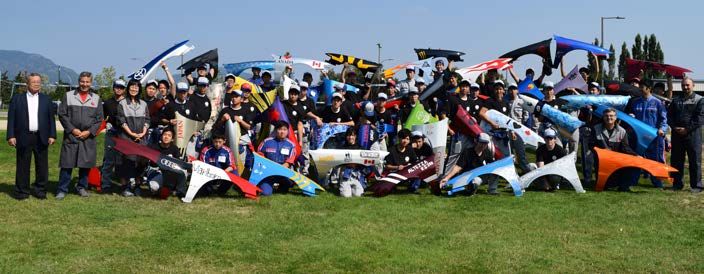
Okanagan College
2017-18 – 2020-21
Accountability Plan and Report Accountability Plan and Report
Page 6 of 2017 Report
AVED FTE Summary
Target Actual Utilization
Employment and Labour Market
Baseline 286 286 100%
Skills
Variables that can inform enrolment 592College
Gap Plan at Okanagan
forecasting 592 are the100%
overall regional unemployment rate,
Target Funded Subtotal 878 878 100%
(one year out), and the regional Grade 12 headcounts (combined with the immediate K-12 to post-secondary transition
Base Funded 3,860 4,487 116%
rates within the College catchment area).
TOTAL 4,738 5,365 113%
Generally, as employment rates increase and Grade 12 headcounts decrease, College enrolments can be expected to
decrease – or at least
Page see Report
8 of 2017 slower growth.
KELOWNA
105.0 10.0
8.6 101.7 9.0
8.0 8.0 100.2 99.9 99.9 100.2
7.7
100.0 8.0
6.5 6.6 6.9
7.0
6.0
95.0 5.6 5.4 5.6 6.0
5.0
4.6
4.6 5.0
93.2 92.9 91.9 92.0
90.0 4.0
90.9
90.3 90.3
3.0
85.0 87.2 2.0
86.1
1.0
80.0 0.0
ar
eb
17
13
14
15
16
n
08
09
10
11
12
pr
-Ja
-M
-A
-F
20
20
20
20
20
20
20
20
20
20
18
18
18
18
EMP. ('000) UNEMP. %
Okanagan Employment
BC’s unemployment rate declined by 0.9 per cent in 2017, dropping to 5.1 per cent. This was the ninth consecutive
year of decline.
Page 8
much-stronger pace compared with 2016 when growth was 1.4 per cent. This Okanagan College
2017-18 – 2020-21
overall GDP improvement was reflected in the national as well provincial
Accountability Plan and Report
employment picture.
Accountability Plan and Report
Both Canadian and BC average unemployment rates continued to improve in the last
year. British Columbia currently has the lowest unemployment rate of any province
in Canada.
Unemployment Rates* (%), April 2018 Line represents Canada at 5.8%
*Seasonally adjusted; Source: Statistics Canada; Prepared by BC Stats
After a high performance in 2017, in which Central 1 estimates real gross domestic
product growth of 4.3 per cent in BC, the provincial economy is forecast to expand
three per
Despite significant cent this year,
improvement overbefore averaging
the previous year2.3 per cent
Kelowna and 3.3toper
continued cent in 2019
experience and higher
a slightly
2020.rate
unemployment This willthe
than mark more average
provincial than teni.e.
years
5.4 of
percontinuous
cent. economic expansion for the
provincial economy.
Overall deceleration
The unemployment in hiring
rate for the entire is expected
Thompson following
Okanagan regionrobust gains
(7.1 per cent)over
alsothe
sawprevious
year-over-year improvement
two years.
yet it remained higher than the provincial average. The Kelowna unemployment rate has dropped further since
December However
to 4.6 perthe
centCentral 1 economic
at the end forecast predicts that in the next two years the BC
of April, 2018.
unemployment rate will continue to be below five per cent. The consumer price
index increases are expected to hold steady at approximately two per cent.
Population for the
Page 12 of 2017 province is expected to grow by just over one per cent.
Report
Grade 12 Headcounts for the Okanagan College Region
Grade
by School 12 Headcounts
District (CentralforOkanagan
the Okanagan- College
SD23 Region by axis)
- on right
School District (SD23 on right axis)
800 2,000
1,934 694 source: 1558b
1,950
700 1,912
609 1,900
Page 601
600 10 648
1,850
588 489 499
500
1,800
494
475
400 1,750
1,751
1,700
300
208 1,650
200 165 162
1,600
91 89 114
100
1,550
0 1,500
2012 2013 2014 2015 2016 2017 2018 2019 2020 2021 2022 2023 2024 2025 2026 2027
SD19 SD22 SD53 SD67 SD82 SD23
New for 2018 Report
Change in Grade 12 Headcounts
Page 9
for the Okanagan College Region
Okanagan College
                                                                                                                                           2017-18 – 2020-21
       Accountability Institutional Context                                                                                     Accountability Plan and Report

          As summarized by the International Monetary Fund (IMF), Canadian gross domestic product (GDP) showed that the
          national economy grew three per cent for all of 2017 — a much-stronger pace compared with 2016 when growth was
          1.4 per cent. This overall GDP improvement was reflected in the national as well provincial employment picture.

          Both Canadian and BC average unemployment rates continued to improve in the last year. British Columbia currently
          has the lowest unemployment rate of any province in Canada.

                                        BC Unemployment Rate by Region and Metropolitan Area
                      10.0
                                          8.6
                       9.0
                                                           8.0           7.7                                             8.0
                       8.0

                       7.0                                                                                                               7.1

                       6.0                                                          6.5      6.6                                         5.4
                       5.0                                                                                        5.6                     5.1
                             5.0
                                                                                                                                         4.6
                       4.0                                                                               4.6

                       3.0
                               2008          2009         2010          2011         2012      2013       2014   2015    2016        2017
                                             BRITISH                     KELOWNA                   MAINLAND/        THOMPSON/
                                             COLUMBIA                                              SOUTHWEST        OKANAGAN
                        Source Statistics Canada Labour Force Survey, Prepared by BC Stats

                    Low unemployment in the region may adversely affect enrolments. However, an
                     overall increase
          Central 1 estimates          in domestic
                               real gross regional population
                                                     product grewasby
                                                                    well
                                                                      4.3as
                                                                          pera transitioning
                                                                               cent in B.C. in economy   from
                                                                                               2017, the provincial  economy is
          forecast toprimary  and related
                      expand three          services
                                     per cent         tobefore
                                              this year, technology   will 2.3
                                                                averaging  continue   to and
                                                                                per cent create
                                                                                              3.3demand
                                                                                                  per cent for  new and 2020. This will
                                                                                                            in 2019
          mark moreskills. Improvements
                      than ten               in transition
                               years of continuous          rates
                                                     economic     from K-12
                                                                expansion  for to
                                                                               thepost-secondary    institutions
                                                                                    provincial economy.
                    may also improve the enrolment picture.
                    Accordingintohiring
          Overall deceleration    the Chartered   Professional
                                        is expected             Accountants
                                                    following robust         BCthe
                                                                     gains over  (CPABC)
                                                                                   previousRegional Check-
                                                                                            two years.
                    Up 2017, BC’s labour force educational attainment for workers between ages 25 and
                    541increased
          The Central    economic by   two per
                                    forecast    cent in
                                             predicts    2017,
                                                      that in thewhich   means
                                                                  next two      that
                                                                            years thethe
                                                                                      BC share of those workers
                                                                                         unemployment   rate will continue to be
          below fivein the
                     per    main
                          cent.   segment
                                The consumerof the
                                               priceworkforce   with post-secondary
                                                     index increases                   accreditation
                                                                       are expected to hold           rose to
                                                                                            steady at approximately  two per cent.
          Population71.4   perprovince
                      for the  cent. The
                                       is educational  attainment
                                          expected to grow    by just of Thompson-Okanagan
                                                                      over one per cent.       region’s labour
                 force also rebounded from a decline in 2016 to achieve an all-time high in 2017 of
                 67.9%. This gain resulted from the addition of 7,800 individuals with post-
                 secondary accreditation to the labour force and the loss of 6,500 workers with less
                 education.
             Graduation     ceremonies
                 Okanagan College            in Junealso continue to see growth and an increased
                                    and UBC Okanagan
             2017.  OCofisinternational
                 influx      livestreaming
                                        students its
                                                 and a consequent growth in the number of
             ceremonies to allow worldwide
             viewing for relatives who can’t
             make the ceremony.

Page 10
Okanagan College
2017-18 – 2020-21
Accountability Institutional Context Accountability Plan and Report
Low unemployment in the region may adversely affect enrolments. However, an overall increase in regional population
as well as a transitioning economy from primary and related services to technology will continue to create demand for
new skills and training. Improvements in transition rates from K-12 to post-secondary institutions may also improve the
enrolment picture.
According to the Chartered Professional Accountants BC (CPABC) Regional Check-Up 2017, BC’s labour force
educational attainment for workers between ages 25 and 54 increased by two per cent in 2017, which means that the
share of those workers in the main segment of the workforce with post-secondary accreditation rose to 71.4 per cent.
The educational attainment of Thompson-Okanagan region’s labour force also rebounded from a decline in 2016 to
achieve an all-time high in 2017 of 67.9%. This gain resulted from the addition of 7,800 individuals with post-secondary
accreditation to the labour force and the loss of 6,500 workers with less education.
Okanagan College and UBC Okanagan also continue to see growth and an increased influx of international students
and a consequent growth in the number of graduates.
graduates.
Okanagan College International FTEs
1000 960
900
802
800
700
600 539
466 492
500 420 434
359 373 388 366 365
400 336
300
200
2005-06 2006-07 2007-08 2008-09 2009-10 2010-11 2011-12 2012-13 2013-14 2014-15 2015-16 2016-17 2017-18
Page 11
Population Projections and Grade 12 Headcounts
Below are the population projections for the 15 to 39 age cohorts for the Okanagan
Region; these age groups account for more than 90 per cent of the fall term
headcount at the College. Overall, the regional population for the 15 to 19 age cohort
will continue to decline until 2021. The 20 to 24 age cohort, after rising over the last
few years, will start declining this year and continue shrinking until 2026. The
population of 25- to 29-year olds is also forecasted to start declining in numbers
after 2023. The other age groups 30 to 34, and 35 to 39 are expected to increase
until 2026.
Okanagan Region School Districts Population Projection
32000
30981
30000 29755
28000
26000 25281 25732
25108
24521
Page 11
24001
24000 23415802
800
700
600 539
466 492
500 420 434
373 388 Okanagan College
400 359 336 366 365
2017-18 – 2020-21
Accountability
300 Institutional Context Accountability Plan and Report
200
2005-06 2006-07 2007-08 2008-09 2009-10 2010-11 2011-12 2012-13 2013-14 2014-15 2015-16 2016-17 2017-18
Page 11
Population Population Projections
Projections and andGrade
Grade 12 12Headcounts
Headcounts
Below are the population projections for the 15 to 39 age cohorts for the Okanagan
Below are the population
Region; projections
these age groupsfor the 15for
account to 39 agethan
more cohorts for the
90 per centOkanagan
of the fallRegion;
term these age groups account
for more than
headcount at the College. Overall, the regional population for the 15 to 19population
90 per cent of the fall term headcount at the College. Overall, the regional age cohortfor the 15 to 19
age cohortwill
will continue
continue to
to decline until 2021. The 20 to 24 age cohort, after rising overlast
decline until 2021. The 20 to 24 age cohort, after rising over the thefew
lastyears, will start
declining this
few years, will start declining this year and continue shrinking until 2026. The forecast to start
year and continue shrinking until 2026. The population of 25- to 29-year olds is also
declining after 2023. The
population othertoage
of 25- groups
29-year (30istoalso
olds 34 and 35 to 39)toare
forecasted expected
start to increase
declining until 2026.
in numbers
after 2023. The other age groups 30 to 34, and 35 to 39 are expected to increase
until 2026.
Okanagan RegionRegion
Okanagan Population Projection
School Districts (by School
Population District)
Projection
32000
30981
30000 29755
28000
26000 25281 25732
25108
24521
24001
24000 23415
22564 23732
22061
22000 21912
21063
21537
21037
20000
2012 2013 2014 2015 2016 2017 2018 2019 2020 2021 2022 2023 2024 2025 2026
15-19 20-24 25-29 30-34 35-39
According to BC Stat’s PEOPLE population projections,
by 2025 the Central Okanagan’s largest working age
population cohort will be the 30- to 34-year-olds, followed
by the 35- to 39-year-old group. In the Okanagan school
districts outside of the Central Okanagan (i.e. Vernon,
Okanagan Shuswap, Okanagan Skaha, and Okanagan
Similkameen), the largest working-age cohort is projected
to be 60 to 64 age group, far greater in numbers than the
20- to 24-year-old group. Demand for various types of
college programming will be uneven in the valley, based
on expected population numbers.
The Central Okanagan School District (23) Grade 12
headcount is the largest in the College region, slightly
smaller than all of the other school districts combined in
2018. Dental Assistant students have the chance to
practice on simulators before moving on to real
patients.
Page 12age group, far greater in numbers than the 20- to 24-year-old group. Demand for
various types of college programming will be uneven in the valley, based on
expected population numbers.
The Central Okanagan School District (23) Grade 12 headcount is the largest in the
College region, slightly smaller than all of the other school districts combined in Okanagan College
2018. 2017-18 – 2020-21
Accountability Institutional Context Accountability Plan and Report
Page 12
Grade 12
Grade 12 Headcounts
Headcounts for for the
theOkanagan
Okanagan College
College Region by
School
School District
District (Central
(Central Okanagan
Okanagan on-right
- SD23 axis)axis)
on right
800 2,000
1,934 694 source: 1558b 1,950
700 1,912
609 1,900
601 648
600
1,850
588 489 499
500
1,800
494
475
400 1,750
1,751
1,700
300
208 1,650
200 165 162
1,600
91 89 114
100
1,550
0 1,500
2012 2013 2014 2015 2016 2017 2018 2019 2020 2021 2022 2023 2024 2025 2026 2027
SD19 SD22 SD53 SD67 SD82 SD23
Change in Grade 12 Headcounts
for the Okanagan College Region
200 179
150
108
100 75
39 34
50
1
0
-1
-50 -14 -24 -35
-100 -73 -82 -86
-150
-200 -172
-250
-236
-300
2012 2013 2014 2015 2016 2017 2018 2019 2020 2021 2022 2023 2024 2025 2026
to to to to to to to to to to to to to to to
2013 2014 2015 2016 2017 2018 2019 2020 2021 2022 2023 2024 2025 2026 2027
Interprovincial Migration
In recent years, there has been an increase in the number of people migrating to BC
from other provinces, as well as an increase in immigration from other countries. In
Page 13 migration from these two sources is anticipated to continue, albeit at a slower rate.-35
-100 -73 -82 -86
-150
-200 -172 Okanagan College
-250 2017-18 – 2020-21
Accountability
-300
-236
Institutional Context Accountability Plan and Report
2012 2013 2014 2015 2016 2017 2018 2019 2020 2021 2022 2023 2024 2025 2026
to to to to to to to to to to to to to to to
2013 2014 2015 2016 2017 2018 2019 2020 2021 2022 2023 2024 2025 2026 2027
Interprovincial Migration
In recent Interprovincial Migration
years, there has been an increase in the number of people migrating to B.C. from other provinces, as well as
In in
an increase recent years,from
immigration there hascountries.
other been an Inincrease infrom
migration the number
these twoof people
sources migrating to
is anticipated tocontinue,
BC albeit
from
at a slower rate.other provinces, as well as an increase in immigration from other countries. In
migration from these two sources is anticipated to continue, albeit at a slower rate.
Sources of Migration to BC.
f=forcast
Sources: The Conference Board of Canada; Statistics Canada
AccordingAccording
to the CPABC Regional
to the CPABC Check-Up
Regional 2017, 72 per cent
Check-Up of the
2017, 72new
per residents in the
cent of the newThompson-Okanagan
residents
Region migrated from Alberta and other provinces. The population growth was concentrated in the Central Okanagan
in the Thompson-Okanagan Region migrated from Alberta and other provinces. The
Regional District, attracting 83 per cent of the new residents. Some of the interprovincial migration may be British
population growth was concentrated in the Central Okanagan Regional District,
Columbians returning to B.C. after working in other provinces, especially in the oil and gas sector in Alberta.
However, Alberta’s economic rebound surpassed expectations in 2017. Building off the surge in economic activity in
2017, the Albertan economy is forecast to expand at a solid rate of 2.7 per cent in 2018. It is anticipated that Alberta
will move from recovery to expansion, with continued
growth of around 2.5 per cent a year from 2019 to 2021. In
the Alberta Economic Outlook 2018-21, WTI oil prices are
assumed to range from US $59 - 63 per barrel from 2018-
19 to 2020-21, which is good for the recovering Alberta
economy as well as the overall Canadian economy. Alberta
Natural Gas Reference Price (Cdn$/GJ) are also expected
to remain in the range of $2 to $ 2.20. According to ATB
Financial’s 2018 Alberta Economic Outlook, after averaging
7.9 per cent in 2017, Alberta’s unemployment rate is
expected to average 6.8 per cent this year and fall to 6.4 per
cent in 2019.
With improving prospects in Alberta labour market the influx
of workers to BC as well Thomson-Okanagan region from Students in the Sustainable Construction
Alberta may decrease in 2018 and possibly reverse over the Management Technology program built a
coming years. portable bird-banding station for the Okangan
Similkameen Conservation Alliance and
Environment Canada.
Page 14Okanagan College
2017-18 – 2020-21
Accountability Institutional Context Accountability Plan and Report
Housing
In three of the municipalities that are home to Okanagan College’s major campuses – Kelowna, Salmon
Arm and Penticton – the rental vacancy rates of private apartments are well below the provincial
average.
October 2017 Rental Market report from Canada Mortgage and Housing Corporation (CMHC) showed
Salmon Arm maintaining the lowest vacancy rate, hovering close to 0.0 per cent (a decline from 0.5 per
cent in 2016). Kelowna’s vacancy rate has decreased from 0.6 percent in 2016 to 0.2 per cent in 2017.
Penticton had a 0.9 per cent vacancy rate (down from 1.1 per cent in 2016). Vernon had the highest
vacancy rate among the four municipalities in 2017 at 1.5 per cent (down from 1.9 per cent in 2016). The
provincial average in October 2017 was 1.3 per cent virtually unchanged from 2016.
Average monthly rents also continued their upward trajectory in 2017. A bachelor apartment in October
2017 cost $579 in Salmon Arm (up from $560 in 2016), $619 in Vernon (up from $587 in 2016), and $859
in Kelowna (up from $710 in 2016).
The effects of migration to the Okanagan can be seen more prominently in the exponential increase in
Kelowna home prices on a year-over-year basis.
The aggregate price of a home in Kelowna grew in the first quarter of 2018 by 9.6 per cent year-over-
year to $632,477, according to the Royal LePage House Price Survey released in April 2018. When
broken out by housing type, the median price of a condominium increased 13.1 per cent year-over-year
to $411,827, while the median price of a bungalow rose 12.1 per cent to $636,279 in the same period.
The median price of a two-storey home rose 7.4 per cent year-over-year to $714,357.
Okanagan College’s
existing residence
Page 15Okanagan College
2017-18 – 2020-21
Accountability Institutional Context Accountability Plan and Report
Global Economy & International Factors
There are several global economic factors that may influence the Canadian and British Columbian economies. These
factors can also influence the numbers of international students that come to BC.
According to the Central 1 Economic Analysis of British Columbia report (2018-2020), Global economic growth is
expected to maintain modest momentum and a cyclical uplift over the forecast period which underpins export gains,
stronger commodity prices, and higher investment. The International Monetary Fund (IMF) raised its global growth
forecast to 3.9 per cent in both 2018 and 2019, marking a 0.2 percentage point increase from its fall forecasts, driven
mostly by advanced economies. Central 1 forecasts Canadian economic growth of 2.2 per cent in 2018 and 2.0 per
cent thereafter following 2017’s strong 3.0 per cent expansion.
That said, trade uncertainty has intensified. NAFTA renegotiations are still ongoing, and a cloud of uncertainty exists
for export growth and business investment, and broadly global growth.
Nearly three-quarters of global chief financial officers (CFOs) believe the U.S. economy will remain strong over the
next three years. Of the 497 CFOs across 30 countries surveyed by Zurich Insurance Group, Ernst & Young (EY) and
the Atlantic Council, 71 per cent expected continued improvement in the US business environment over the next
three years, while 61 per cent felt confident or extremely confident about investing in the US. This is despite rising
calls for protectionism and the renegotiation of long-established trade arrangements by President Donald Trump’s
administration.
While the Canadian dollar appreciated throughout 2017, it is forecast to face much uncertainty this year. Although,
an increase in oil prices and short-term interest rates spreads have favoured the Canadian currency in the short run,
NAFTA-related uncertainty will continue to put pressure on the Canadian dollar. RBC Economics expects the dollar
to hover at 78 US cents early this year before strengthening to 82 cents by the end of 2018. As the Canadian dollar
strengthens the overall cost of Canadian education is expected to increase for the international students.
From the reputational point of view, Canada is known for being a safe space as well as an ethical country with an
effective government. Canada has regained the top spot in the 2017 Country RepTrak, by the Reputation Institute,
who measured the reputation of the 55 countries with the largest economies in the world. Canada is used to the top
spot - in the past six years placed first four times. In 2016 and 2014, we were in second place, beat out by Sweden and
Switzerland respectively. Lonely Planet also recommended Canada as the No. 1 country to visit in 2017.
International students that ultimately intend to immigrate to Canada also continue to benefit from one of the most
accommodating rules at the Provincial and Federal levels that facilitate their permanent residency in Canada.
A visitor to the
Penticton campus
Page 16Okanagan College
2017-18 – 2020-21
Strategic Plan Accountability Plan and Report
STRATEGIC PLAN 2016-2020
MISSION
Okanagan College transforms lives and communities.
We engage, lead and serve through:
• A high quality educational experience for our learners.
• An environment that supports employees and encourages personal and professional growth.
• Collaborative relationships that are responsive to our communities.
CORE VALUES
These serve to guide decision-making as an organization and our actions as individuals.
1. Learner Success. Learners are at the heart of everything we do.
2. Access. We advocate and promote access to education.
3. Continuous Improvement. We strive to do better tomorrow than we did today.
4. Collegiality. In all our interactions we act with respect and integrity.
5. Diversity. We support an inclusive environment.
6. Sustainability. We strive for social, environmental and economic sustainability.
7. Collaboration. We embrace the opportunity to work with and learn from each other.
8. Innovation. We introduce, evaluate and embrace new ideas.
Page 17Okanagan College
2017-18 – 2020-21
Strategic Plan Accountability Plan and Report
KEY DIRECTIONS
Supporting Learner Readiness and Success (See page 19)
Through their educational experience, learners are better prepared for work, life and further study.
• Improve pathways for students into, within, and beyond Okanagan College.
• Provide the best possible support services for learners.
• Enhance the learner experience by improving administrative systems and processes, and by creating
an engaging college environment.
• Implement an internationalization plan so that students better understand the world around them.
Excelling in Teaching, Programming, and Applied Research (See page 24)
Students, employers, and the community will benefit from the College’s commitment to
innovative and responsive education.
• Use the best combination of course delivery methods, such as face-to-face, E-learning, and blended approaches,
to address diverse learner and community needs.
• Provide an array of programming that effectively responds to the needs of our students, employers and
communities.
• Provide opportunities for teaching professionals to continuously enhance their skills, knowledge and practice.
• Significantly develop applied research, scholarly activity, and knowledge transfer activities to better serve
students, communities, and employers.
Working With, and Learning From, the Indigenous Community (See page 28)
The College values and respects Indigenous culture and ways of knowing and is working
towards indigenization. The goal is an authentic partnership that benefits all parties and enriches
the education of learners.
• Commit to an indigenization plan through engagement with Indigenous communities. The plan will address:
• Enhancing ties with Indigenous partners.
• Strengthening support services as well as physical, cultural, and spiritual spaces that are available to learners.
• Increasing opportunities for the college community to learn from Indigenous knowledge and culture.
• Identifying possible changes to College policies, structure, and processes that will benefit all.
Serving and Engaging the Community (See page 30)
Strengthening relationships with alumni, employers, and community groups contributes to
the health and prosperity of the region the College serves.
• Increase the number and strength of connections.
• Build and sustain relationships with alumni and donors.
• Increase opportunities for engagement with all communities through approaches such as applied research,
experiential learning, student employment programs, guest speakers, and events.
Focusing on Organizational Sustainability (See page 34)
The College needs to address the human and financial resources, infrastructure, and environmental
challenges that will accompany anticipated demographic, economic, and social changes.
• Seek additional sources of funding to sustain and further develop the College.
• Ensure there are sustainable operations in each of the four regions.
• Augment the College’s human resource plan through improved strategies in key areas such as succession
planning, employee development and the recruitment and retention of a diverse employee base.
• Complete and implement a sustainability plan that addresses environmental, financial and social sustainability.
Page 18Okanagan College
2017-18 – 2020-21
Key Directions - Supporting Learner Readiness and Success Accountability Plan and Report
Okanagan College Key Direction: Supporting Learner Readiness and Success
Okanagan College Objectives Ministry Objectives BC AEST Performance Measure
Aligned
• Improve pathways for students into, within, and Capacity • Student Spaces – total and
beyond Okanagan College. Access designated program areas
• Provide the best possible support services for Relevance • Credentials Awarded
learners. Efficiency • Transition rate of secondary school
• Enhance the learner experience by improving Quality students to public post secondary
administrative systems and processes, and by education
creating an engaging college environment. • International student spaces
• Implement an internationalization plan so that • Year-to-year retention rate
students better understand the world around • Time to completion
them.
Pathways and Transitions
The Penticton campus welcomed over 120 elementary school students for the Spring into Math event on April 4,
2017. The event served as a final project for students in the Mathematics for Elementary Teachers program. This is an
excellent opportunity for our college students to connect with the local teaching community. It also gives our local
elementary students a chance to experience some hands-on activities with the hope that they leave campus having
learned something new.
In September 2017, Okanagan College began offering a new program option that will allow students considering a
career in the mining sector to get a jump on their first year of science studies at Okanagan College, and then bridge
into one of a number of mining programs at British Columbia Institute of Technology (BCIT). The Collaborative Mining
Engineering and Technology Diploma/Degree pilot program offers students across British Columbia a convenient
conduit into BCIT’s Mineral Exploration and Mining Technology or Mining and Mineral Resource Engineering programs.
Teens in Grades 9 through 12 were able to tap into a unique two-week summer camp hosted at the College’s Vernon
campus in July, 2017. Tech Gateway, one of this year’s new Camp OC offerings, is designed to give older students a
glimpse into careers in the technology sector, focusing on everthing from computer science, to coding.
Okanagan College successfully promoted the resumption of tuition-free Adult Basic Education (ABE) and English as a
Second Language (ESL) for domestic students at Okanagan College and other B.C. postsecondary institutions College
officials developed communications materials and strategies for those students who were already enrolled when the
policy decision was formalized by the province, those who were in the application process, and for the general public.
High school students in School District 23 were able to get a jump on their Education Assistant (EA) training as a
consequence of a new collaboration between Okanagan College and the School district. The dual-credit program
allowed students to split their final academic year, spending the first half completing their Grade 12 studies and the
second half working towards completion of the EA certificate. The four and a half-month, full-time program was offered
at George Elliot Secondary School in Lake Country.
In the late fall, a class of Women in Trades Training (WITT) Gateway students in Kelowna completed custom shelving
for Arion Therapeutic Farm, a nonprofit wildlife habitat with playgrounds and nature trails for all ages and abilities.
Students put their blueprint reading and measurement skills to the test, and then used jig saws, tables saws and hand
drills to build an innovative array of shelves.
Page 19Okanagan College
2017-18 – 2020-21
Key Directions - Supporting Learner Readiness and Success Accountability Plan and Report
An opportunity at Okanagan College to test-drive a career in the trades put Frances Sadowick on the path to a career
she loves and helped her build the confidence to pursue it. Her story was a focal point for an open house in March
that invited women to follow in Sadowick’s footsteps and learn about opportunities to train for a future in the building
trades. Sadowick took a 12-week Gateway to the Building Trades program and as soon as her Gateway program
wrapped, she applied to, and was sponsored again by Okanagan College Women in Trades to enrol in the Plumbing
and Piping Trades Foundation program. Sponsorship included full tuition, textbooks, personal protection equipment
and tools required for the program. “
Programming Support
More than 70 students pulled a productive all-nighter at the Penticton campus in late March 2018. The fourth annual
Long Night Against Procrastination was a chance for students, with the help of faculty, to focus on putting end-of-term
assignments (which they may or may not have put off) behind them. Professor Frances Greenslade was one of those
faculty members assisting students into the wee hours of the night. “At 2 a.m. or 3 a.m. or 4 a.m., after the pizza’s
been eaten, after the third or fourth or sixth cup of coffee, when Jupiter and its four moons hang above the southern
horizon, a kind of clarity and calm sometimes descends, dropping like the wind drops when it’s blown all night,” writes
Greenslade in a blog about the event. “At those times, something seems to let loose deep in the heart of you, and you
can write because it’s now or never.”
A new wellness pilot project at Okanagan College’s Penticton campus – Flourish -
that ran from September 2017 to April 2018 promoted positive mental health and provided
students tools and resources they need to thrive in their studies and personal lives. Flourish
was comprised of a series of free drop-in workshops open to all students and touched on
tips and strategies for managing stress, anxiety and depression. Guest speakers throughout the year helped open up
the conversation about mental health and work to break down stigmas of mental illness and the challenges students
encounter in daily life.
More than 150 students took part in the Penticton campus’ Stress Buster event in February, 2018, making for a
rather relaxing day around campus. The event was full of fun activities to help students beat the stress including
aromatherapy, beading, board games, colouring, stress ball making, yoga and some therapy dogs were on site as
well. Several nursing students also came to the event to showcase strategies for combating stress through exercise,
sleep, test anxiety information and for time management. The newest campus wellness project, Flourish, encouraged
students to take a pledge to choose to
flourish in their own mental health. Special
guests from The Women’s Resource
Centre also attended the event and
hosted a quilting table where students
made squares to honour women.
The Stress Less Fair, sponsored by the
Salmon Arm Campus Life Committee,
took place on March 13 and encouraged
students to focus on de-stressing.
Students had a blast playing games,
spending time with the St. Johns
Ambulance therapy dogs, eating healthy
snacks and learning about success
Therapy dogs are just part of the efforts
strategies and stress release activities they
can do on their own time.
that go into reducing stress for students at
Okanagan College campuses.
Page 20Okanagan College
2017-18 – 2020-21
Key Directions - Supporting Learner Readiness and Success Accountability Plan and Report
Trades, Technology, Aviation
Five Okanagan College students found their way to Winnipeg, MB to compete
in the Skills Canada National Competition in May 2017, after gold medal-winning
performances at the provincial competition in Abbotsford on April 5. Joining the
gold medalists on the podium at the Skills BC Provincial Competition were eight
additional OC students who earned four silver and four bronze medals in an array
of trades and technology disciplines, from Aerospace Technology to Refrigeration.
OC was unbeatable in the province in the areas of Automotive Collision Repair,
Automotive Service, Carpentry, Culinary Arts and IT. Brendan Battersby, a second year
student in the College’s Network and Telecommunications Engineering Technology
(NTEN) program won gold in IT – Network Systems Administration. Kurt Breton, a
level 4 apprentice earned gold in Automotive Service, while Lukas Pfob, also a level 4
apprentice, took the top spot in Carpentry. Siobhan Detkavich, a dual-credit Culinary
Arts student at Okanagan College and Southern Okanagan Secondary School, came
Siobhan Detkavitch
away with gold in the Culinary Arts (Secondary) category. Andreas Roth, a level 3
apprentice, won gold in Automotive Collision Repair – a category swept by OC. Roth was joined on the podium by
Caleb Loewen who brought home the silver medal and Marcel Kaemmerzell, who earned bronze.
Three of the five Okanagan College competitors earned bronze medals at the Skills Canada National Competition
(SCNC) held in Winnipeg from May 31 – June 3. Battersby took home the bronze in the IT Network Admin
competition. Battersby graduated from the Network and Telecommunications Engineering Technology (NTEN)
program at the College’s Spring Convocation Ceremony in Kelowna in June. He is employed by iTel Networks Inc.
Detkavich of Oliver earned bronze in the Cooking competition. Detkavich has completed her Level 2 Professional Cook
apprenticeship at the Kelowna campus and works in the kitchen at Terrafina Restaurant at Hester Creek by RauDZ. Roth
won bronze in the Autobody competition. Roth is a Level 3 Motor Vehicle Body Repairer apprentice at the Kelowna
campus and is employed by Boyd Autobody and Glass.
Okanagan College Computer Science faculty and students joined forces with renowned 3D modeling expert Dr.
Kenichi Sugihara on an international research project aimed at simplifying the way buildings are assessed and repaired
after natural disasters. Sugihara is a professor of Information Science at Gifu Keizai University in Japan who specializes
in Computer Graphics (CG) and Geographic Information Systems (GIS). His current research explores how cutting-edge
algorithms can automatically generate 3D urban models. Enter Dr. Youry Khmelevsky, Chair of the Computer Science
program at Okanagan College, who with the help of Second-year Bachelor of Computer Information Systems (BCIS)
A partnership between OC, KF Aerospace
and The ITA resulted in more Aircraft
maintenance Engineering seats
Page 21Okanagan College
2017-18 – 2020-21
Key Directions - Supporting Learner Readiness and Success Accountability Plan and Report
students Matt Cocar and Marty Wallace, helped Sugihara refine his working model of a program specifically tailored to evaluate
roof damage in buildings using 3D simulations. In 2017, the six-month project was awarded a $25,000 Natural Sciences and
Engineering Research Council of Canada (NSERC) Engage grant and also received in-kind support from GIS software distributer Esri
Canada.
Dozens of Okanagan College culinary and pastry arts students and apprentices were able to join 11 of Canada’s top chefs as they
participated in the Canadian Culinary Championships (Gold Medal Plates) held in Kelowna in February, 2018. Chef Alex Chen of
Boulevard Kitchen & Oyster Bar in Vancouver was the eventual winner of the competition. The College once again hosted the
popular Black Box Competition, an Iron Chef-style contest, on the morning of Feb. 3. Chen was supported by OC students Siobhan
Detkavich, Jillian Leatherland, Caitlan Lapka and Shelly Nguy. OC Culinary Arts students and instructors also provided culinary
delights for competing chefs, judges, media and guests throughout the Championships.
Business
An impressive finish at the Enactus Canada Regional Exposition in late February, 2018 meant three Okanagan College Enactus
student teams participated in the national competition in May for the chance to once again distinguish themselves as Canada’s
best. Enactus OC sent five teams – totaling 34 students – to compete in regionals in Calgary last weekend. The results once again
surpassed expectations with two first-place finishes, one in the TD Entrepreneurship Challenge and the other in the Scotiabank
Youth Empowerment Challenge. An OC Enactus team also scored a third-place finish in the Scotiabank Eco-Living Green
Challenge.
Business students from across the country vied for the top spots at the Western Canadian Business Competition (WCBC) hosted at
Okanagan College in March and a team from OC was celebrated for taking strategic planning to new heights. Over the course of
two fast-paced days of competition, student teams were tasked with running a complex business simulation – predicting all aspects
of a hypothetical company’s trajectory over an eight-year timeframe. They then presented their best strategic solutions to a panel
of judges. First-, second- and third-year business students competed at the junior level, while fourth-year students competed as
seniors. At the junior level, the host team from the College finished second to College of the Rockies and Langara College took
the top spot at the senior level, besting teams from (second-place) McMaster University, Medicine Hat College and the home team
from the College. 2018 marks the 29th time the Western Canadian Business Competition has run. The College has hosted for the
past seven years.
Kristine Menard is a Cree
student from Saddle Lake,
Alberta studying Business
Administration at OC – one
of 1,725 Aboriginal students
who attended the college in
the 2016-17 academic year.
Page 22Okanagan College
2017-18 – 2020-21
Key Directions - Supporting Learner Readiness and Success Accountability Plan and Report
Okanagan College School of Business students Mitchell Folk, Andrea Poznikoff and Jessee Regnier comprised the
only B.C. team to make the finals of the prestigious HRC West Case Competition at SAIT in March 2018. HRC West is
the first business case competition in Western Canada dedicated entirely to Human Resources. The trio placed fourth
overall.
Internationalization
Marking 26 years of successful educational and cultural partnership, students and officials from the Toyota Technical
College celebrated the completion of yet another year with Okanagan College on August 16, 2017. The exchange
program sees students from the Japanese institution travel to the College’s Kelowna campus for training in the state-
of-the-art Trades facilities. Students learned Collision Repair and customer service at the College. They also had the
chance to explore Kelowna and experience Canadian culture during their stay. In 2017 a record group of 120 students
attended, bringing the total number of participants over the past 26 years to more than 1,100.
A new pilot project initiated at the Kelowna campus in fall 2017 provided additional support to help both international
and domestic students succeed in the classroom. Communications Professors Jillian Garrett, Michael Saad and Ed
Henczel launched Managing Culturally Diverse Classrooms, a project which seeks to help struggling students on a one-
on-one basis with common concerns spanning assignment completion, group work, policies, citing, online resources,
research, classroom expectations and more. The project worked on a professor referral basis only and was open to
all departments and levels of study. Each student received a tailored experience based on their needs The project
received support from the OC Innovation Fund and also included a research component which saw Garrett, Saad and
Henczel explore best practices for supporting international students with a focus on nurturing the relationship between
domestic and international students.
Nearly 300 people, including OC students, local high school students and community members converged on the
Kelowna campus for International Development Day on Oct. 25, 2017. Hosted by the International Development
diploma program, this popular annual event celebrates the role of Okanagan individuals and organizations in creating
a better world through international humanitarian actions, aid and development efforts across the globe. Sixteen non-
profit organizations showcased their work through displays in the Atrium of the Centre for Learning throughout the day
this year. Students from OC and Kelowna Secondary School also had a chance to join drop-in talks by OC faculty and
guest speakers.
A record number of students from Toyota Technical School participated
in the 26th annual cultural and educational tour to Okanagan College.
Page 23Okanagan College
2017-18 – 2020-21
Key Directions - Excelling in Teaching, Programming, and Applied Research Accountability Plan and Report
Okanagan College Key Direction: Excelling in Teaching, Programming, and Applied Research
Okanagan College Objectives Ministry Objectives Aligned BC AEST Performance Measure
• Use the best combination of course Quality • Student satisfaction with
delivery methods, such as face-to-face, Relevance education
E-learning, and blended approaches, to Access • Student assessment of quality of
address diverse learner and community instruction
Capacity
needs. • Student assessment of skill
• Provide an array of programming that development
effectively responds to the needs of our
students, employers and communities.
• Provide opportunities for teaching
professionals to continuously enhance
their skills, knowledge and practice.
• Significantly develop applied research,
scholarly activity, and knowledge transfer
activities to better serve students,
communities, and employers.
Flexible Programming
Amid a growing need for health care professionals across the province, the College offered an August, 2017 intake of its
Health Care Assistant (HCA) program at the Revelstoke campus with support from a local foundation that stepped up with
support for students in that community. The Revelstoke District Health Foundation provided bursaries valued at $1,000 each.
Three new part-time viticulture courses started in January 2018 at the Penticton campus offering budding grape growers
greater flexibility as they train for careers in the vineyard. The courses ran Jan. 3 – April 26, 2018 and spanned three key
cornerstones of viticulture – vineyard health and nutrition, irrigation and trellis systems and vineyard operations. The courses
were developed as part of the College’s new Viticulture Technician diploma program that launched in September, 2017. The
two-year pilot program was made possible with funding from both the federal and provincial governments through labour
market agreements, and developed in partnership with the B.C. Wine Grape Council.
2017-18 was
the inaugural
season for the
OC Coyotes
Men ‘s and
Women’s
Basketball
teams
Page 24You can also read