On-eye Evaluation of Optical Performance of Rigid and Soft Contact Lenses
←
→
Page content transcription
If your browser does not render page correctly, please read the page content below
On-eye Evaluation of Optical Performance of Rigid
             and Soft Contact Lenses

Xin Hong, Nikole Himebaugh, Larry Thibos, Arthur Bradley and Carolyn Begley
                      School of Optometry, Indiana University

                                        Abstract
   A Shack-Hartmann aberrometer was used to assess the optical performances of
   eyes corrected with rigid or soft contact lenses compared to spectacles. Metrics of
   optical quality derived from the measured wave aberrations were consistent with
   the subjective rating by subjects of visual clarity. Further aberration analysis
   illustrated the differences in aberration structures of eyes wearing different optical
   corrections. These observations can be explained by theoretical calculations of the
   aberrations of the eye + lens optical system. We conclude that aberrometry
   provides a better understanding of the optical effects of contact lenses in situ and
   could be useful for optimizing future designs of contact lens.

Introduction
        The purpose of contact lenses is to correct refractive errors of an eye in
order to improve the optical quality of the retinal image, thereby improving
vision [Bennett, 1999]. However, the degree of success in achieving this goal
varies with the method of correction. Several studies have demonstrated that
visual performance can vary substantially depending on whether the contact lens
is a rigid, gas-permeable (RGP) lens or a soft hydrogel (SH) lens [Johnson, 1991;
Timberlake, 1992; Fonn, 1995]. The general consensus of these studies is that
RGP contact lenses provide the patient with superior vision compared to SH
lenses, and even compared to spectacle lenses in many instances. However, the
reason for this variation of optical performance is unclear. Perhaps RGP lenses
minimize the amount of residual, uncorrected astigmatism and spherical
refractive errors. Alternatively, perhaps the higher-order aberrations (e.g. coma,
spherical aberration, etc.) are minimized when the eye is fitted with RGP lenses.
Below we review the results of previous attempts to answer this question by a
variety of empirical and theoretical methods. Unfortunately, these studies share
one important limitation: they all used indirect methods to assess the effect of
contact lenses on the optical performance of the eye. The purpose of our study
was to overcome this limitation by directly measuring the residual refractive
errors and higher-order aberrations of the eye while wearing the contact lens.
We did this with a Shack-Hartmann aberrometer, a relatively new diagnostic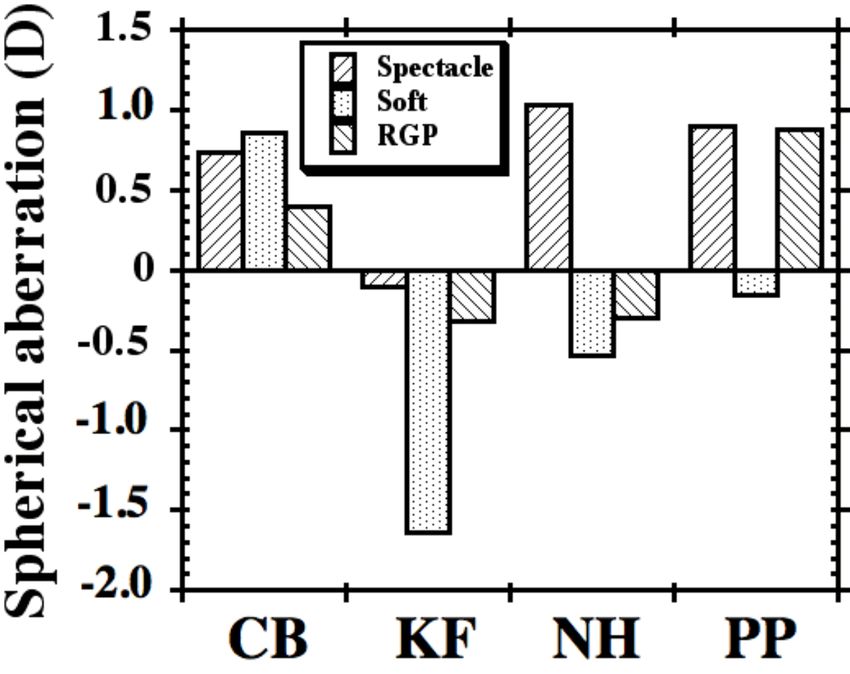
instrument which employs wavefront sensing technology to measure the
aberration structure of the eye with or without the contact lens in place [ref:
Thibos, Principles of SH aberrometer].

        Several early studies have suggested that contact lenses have inherently
large aberrations, especially spherical aberration [Westheimer, 1961; Bauer, 1980;
Cox, 1990]. Thus we might expect the optical aberrations of an eye to increase
when viewing through a contact lens. Paradoxically, visual performance was
found to be slightly worse when viewing through an aberrated contact lens
compared to an aberration-free lens Brabander, [Brabander, 1998]. One possible
resolution of this paradox is the realization that an analysis of the contact lens in
air is not sufficient to predict its performance when placed on the eye. Instead,
one needs to consider the lens in situ, taking account of the entire optical system
of contact lens, eye, and the tear film interface.

        Theoretical modeling of the optical effect of contact lenses have often
simplified the problem by considering the interaction of contact lens with the
cornea in isolation, thereby ignoring the aberrations of the crystalline lens. For
example, Cox [Cox, 1990] calculated the on-eye spherical aberration (SA) of
contact lens as the difference of SA between contact lens + cornea combination
and the cornea alone. These on-eye aberrations of the contact lenses were found
to be quite different from the in-air aberrations. Based on these calculations, Cox
and Holden [Cox & Holden, 1990] suggested that visual performance could be
optimized by an aspheric contact lenses which minimized spherical aberration of
the cornea + lens system. Later, Atchison rightly pointed out that the proper
comparison for an ametropic eye corrected by a contact lens is when the eye is
corrected by a spectacle lens [Atchison, 1995]. This is important because
spectacle lenses alter the angle of incidence of rays onto the cornea and therefore
have the potential to have a large impact on the spherical aberration of the
cornea even if the spectacle lens by itself has little aberration. Using Atchison's
approach, Collins et al. [Collins, 1992] demonstrated that by manipulating the
amount of spherical aberration of the corneal surface by a RBP contact lens,
significant changes in visual performance could be obtained. However, the lens
which minimized the spherical aberration of the cornea did not necessarily yield
the vest visual performance, presumably because of additional spherical
aberration contributed by the crystalline lens. Previous omission of the
crystalline lens in the computational model made the optical performance of the
contact lens/eye combination virtually unpredictable, indicating that the role of
crystalline lenses cannot usually be ignored [El Hage, 1972; Artal, 1998]. Thus,
the ideal solution is to use a contact lens which neutralizes the aberrations of the
whole eye, not just the cornea [Cox and Williams, 2000].

       Additional uncertainties about the interactions between contact lenses and
human eyes continues to hamper theoretical optical modeling of the differences
between soft and hard contact lenses. The two uncertainties most frequently
mentioned in the literature are movement and conformity of the contact lens to
the natural corneal shape. Estimated movement of contact lens on the human
cornea is about 1-2mm for rigid contact lens and 0.5-1mm for soft contact lens.
Such movement would be expected to decenter the eye and lens, thus affecting
the overall aberration structure. Nevertheless, computer simulations indicate that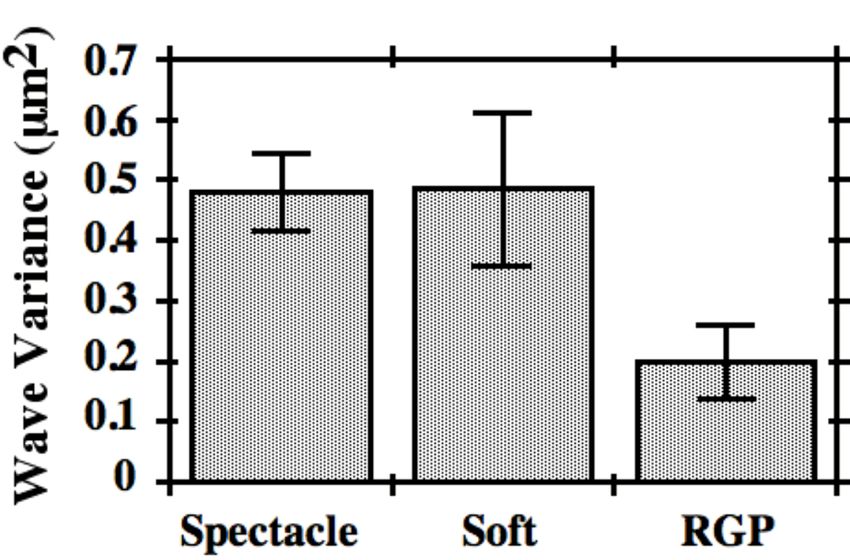
induced asymmetric aberrations caused by lens movement is probably small for
spherical RGP lenses [Atchison, 1995] and even less for soft lenses.

        The issue of conformity takes different forms for hard and soft lenses. The
rigid anterior surface of RGP lens replaces the irregular surface of the natural
cornea with a smooth anterior interface that should reduce the amount of higher-
order aberrations of the eye. To the contrary, soft contact lens would be expected
to preserve at least some of these higher-order aberrations depending on the
degree of conformity . In a recent study, the degree of conformity was quantified
for different types of soft contact lenses based on the power of the tear lens
which lies between the eye and lens [Plainis & Charman, 1998]. The resulting
predictions of performances of soft lens on the eye varied considerably,
depending on the nature of flexure and the degree of conformity assumed.

       Given the limitations faced by the studies reviewed above, we decided to
employ a Shack-Hartmann aberrometer to measure the aberration structure of
the whole eye with contact lens in place. By this strategy we aimed to take
account of the aberrations of the crystalline lens, the tear lens, the change in
aberrations of the cornea resulting from the contact lens, and to gain control over
the uncertainties associated with decentration and conformity. In order to assess
the visual impact of these optical aberrations, we also measured visual
performance by patients while wearing the lens and compared the results with
theoretical predictions based on optical modeling.

Methods
Subjects

       All 4 subjects enrolled in this experiment have healthy and normal eyes.
Only right eyes (OD) were used in this experiment. Subjects wore a variety of
hard (MiniconE, Boston Equalens, Polycon II) and soft (Biomedic, Softlens Toric,
Optima) lens designs. The prescriptions of spectacles, RGP, and SH contact
lenses for each subject is shown in Table 1. Fitting by experienced optometrists
following the standard clinical procedure based on keratometry (“on-K” for
RGP, flatter for SH with fitting factor about 1.2). All of the RGP lenses used in
this experiment had spherical surfaces. Visual acuity was measured in a dark
room with the natural pupil. Patients were also asked to describe the clarity of
vision for each optical correction in comparative way, i.e. rating the best vision as
3 and the worst vision as 1. These measures of visual performance are tabulated
in Table 1 for each prescription.
   Table 1. The prescriptions and visual performances of spectacles, RGP, and SH contact
   lenses for all subjects.
      Subject        Eye (OD)             Spectacle              Soft             RGP
                    Prescription       -1.25,-0.50x085          -1.50             -1.50
        CB         Visual acuity           20/15                20/15            20/15
                      Rating                 2                    1                3
                    Prescription       -5.75,-0.75x164          -5.50             -5.50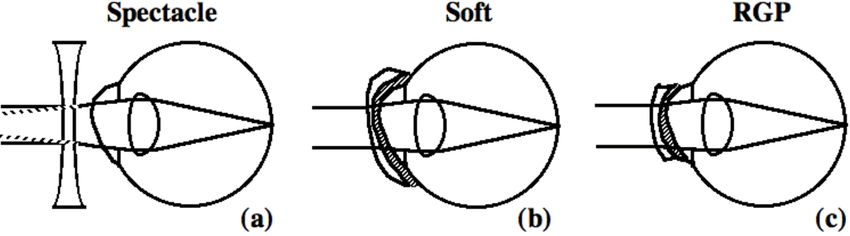
KF         Visual acuity        20/15             20/20          20/15
                     Rating              2                 1             3
                  Prescription     -6.75,-1.00x167   -6.00,-1.00x180    -6.25
       NH         Visual acuity     20/15-20/20          20/20          20/15
                     Rating              2                 1             3
                  Prescription     -2.50,-0.50x070        -2.75         -2.50
        PP        Visual acuity        20/20             20/15          20/15
                     Rating              1                 3             2

Apparatus

       A Shack-Hartmann (SH) aberrometer described elsewhere [Liang, et al,
1994; Thibos & Hong, 1999] was used to measure the optical aberrations of eye
when corrected by spectacle, SH, or RGP contact lens. The SH aberrometer
provides a brief (200ms) flash of collimated light from a He-Ne laser beam (633
nm) which the corrected eye focuses to a point image on the retina. This image
then becomes a source of reflected light that exits the eye and then is subdivided
by a two-dimensional array of lenslets placed optically conjugate to the eye’s
entrance pupil plane. The result is an array of images of the common retinal
source point captured by a CCD video camera. The local slope of the wavefront
over each lenslet is estimated from the lateral shift in the image spot relative to
the optical axis of the corresponding lenslet. These measures of slope are then
integrated to reconstruct the wave aberration.

       The sampling density of the lenslet array in the pupil plane was
0.4mm/lenslet. Light energy at the cornea was 0.01mW, which is about 1% of the
maximum exposure recommended by ANSI. The wave aberrations were
measured along the line-of-sight which is the axis connecting the fixation point,
the pupil center, and the fovea. Previous studies have shown that the Shack-
Hartmann aberrometer has good repeatability and high accuracy in measuring
the optical aberrations of normal human eyes [Liang, et al, 1994; Liang,
Williams, 1997; Salmon, Thibos, 1998] as well as clinically abnormal eyes of
patients with dry eyes [Hong & Thibos, 1997], keratoconus [Thibos & Hong,
1999], and refractive surgery [Thibos & Hong, 1999, Hong, Thibos, 2000].

Procedures

        Each patient’s eye was corrected for distant vision by each of three
methods, as illustrated in Fig. 1. Spectacle correction represents the control
condition in which the aberration structure of the naked eye is preserved. (A
spectacle lens contributes negligible aberration due to the large radii of its two
surfaces.) Retention of corneal aberrations would be expected also for soft lenses
if the contact lens conformed fully to the cornea, as shown by Figure 1(b) because
the cornea irregularity would be transferred to the front surface of the contact
lens. Partial conformity would presumably preserve corneal aberrations
partially. On the other hand, a hard contact lens retains its own surface shape
(Fig. 1c) which has the potential to neutralize aberrations of the cornea as the
tears fill the gap between the contact lens and the cornea. We assume that the
aberrations of the rest of the eye (crystalline lens and intraocular medium)
remain the same for all three optical correction methods since rays follow the
same path inside the eye.
Figure 1. Schematic diagram of the eye with (a) spectacle, (b) soft hydrogel (SH) contact
lens and (c) rigid gas-permeable (RGP) contact lens. The shaded regions indicate the
tear layer. Corneal distortions are exaggerated to illustrate the differences between
different optical corrections.
In order to avoid any possible influence on ocular aberrations, no drugs
were used to dilate the pupil or paralyze accommodation. Head movement was
stabilized with a bite-bar and fixation was maintained by a distant point source.
Shack-Hartmann measurements were always taken three seconds after blinking
to avoid variability of tear film thickness and movement of the contact lens.
Measurements of optical aberrations were conducted in a darkened room. The
pupil sizes of all our subjects were about 6.0mm under this lighting condition.
The measurements were repeated 5 times for each method of optical correction
of the eye.
Data analysis
Wavefront aberrations were fit with Zernike polynomials up to the tenth
order for a 6.0mm pupil using the method of Liang et al. [Liang, et al, 1994]. The
magnification effects of spectacle lenses on the eye’s entrance pupil size was
compensated in software. Mean Zernike coefficients were determined for 5
repeated measurements. Since accommodation was not paralyzed, the defocus
term in wave aberrations were omitted in subsequent analysis to eliminate
possible influence of accommodation fluctuations of focus. The 1st order
aberrations were also omitted from calculations of wavefront error since these
prismatic terms have no effect on monochromatic image quality. Thus the
included terms were astigmatism (2nd-order Zernike modes) and all terms of
order 3 to 10.
In order to quantify the differences in optical performance of the eye
provided by various corrective lenses, four different measures of optical quality
were calculated from the wave aberration function. We adopted this approach
because different optical measures emphasize different aspects of optical
performance, and because we have little prior knowledge to guide our choice of
the best optical measure. Thus an ancillary aim of our study was to correlate thedifferent measures of optical quality with visual performance so as to discover
the best measure for comparison of contact lenses.
The most direct measure of optical quality is wavefront variance, which
quantifies the average deviation between an aberrated wavefront and the ideal
reference wavefront from a non-aberrated system. Larger wavefront variance
indicates poorer optical quality. The other three measures of optical quality, as
illustrated in Fig. 2, are indirect in the sense that they are derived from the retinal
image rather than from the optical system which forms that image.
rMTF Enveloped
area SR=Iab/Idf
Idf
Iab
Neural
Threshold
Cutoff SF Position
(a) (b)
Figure 2. The optical measures used in this study, (a) the intersection of rMTF and
neural threshold indicates the cutoff spatial frequency of the visual system and the
enveloped area under these two curves shows the contrasts of retinal images. (b) the
Strehl ratio is defined as the ratio between peak intensities of point spread functions of
aberrated and ideal optical systems.
Performance of an optical system in the frequency domain is characterized
by a radial-averaged (average across the same radial spatial frequencies)
modulation transfer function (rMTF) which defines the maximum possible
contrast on the retinal contrast for different spatial frequencies. The minimum
amount of contrast needed for visual detection is set by the neural threshold.
From these two curves we derive two metrics of image quality, as shown in Fig.
2a. The first is “enveloped area”, which defines those combinations of spatial
frequency and contrast which can be achieved by the optical system (below
rMTF) and are visible (above neural threshold). The second is “cutoff spatial
frequency”, which is the highest visible spatial frequency (intersection of rMTF
and neural threshold). Qualitatively, larger cutoff frequency and enveloped area
indicates better optical quality.
Optical performance in the spatial domain is characterized by the point
spread function (PSF), which is simply the image of a distant point source as
shown by Fig. 2b. A variety of methods are available for comparing an aberrated
PSF with the ideal PSF of a non-aberrated system. We chose to use Strehl ratio
(SR), which is the ratio of peak intensity of the aberrated PSF to the peak of the
non-aberrated PSF.Results
Example of aberration analysis
Figure 3 shows examples of the wave aberration of subject KF when
wearing a spectacle lens, a soft contact lens, or a rigid contact lens. The sign
convention for these contour maps is that white means phase advance and black
means phase retardation for the reflected wavefront coming out of the eye. In
general, more contour lines in a wavefront map indicates a more aberrated
optical system. For this subject , the control condition (spectacles, Fig. 3a)
indicates the presence of large, irregular aberrations of the eye. Note especially
the bulging out of the inferior part of the wavefront which is indicative of coma.
This asymmetric feature is clearly present also when the eye was corrected with
the SH lens (Fig. 3b), as expected if the lens conforms closely to the cornea.
Overall, the SH correction leaves the eye with much larger aberrations due to the
uncorrected astigmatism (-0.75D, axis 164°) left by this non-toric lens. This
uncorrected astigmatism is responsible for the saddle shape which dominates the
wavefront map. Zernike analysis of this wavefront confirmed the presence of
uncorrected astigmatism (–0.79D, axis 173°), which is almost identical to the
astigmatism determined by subjective refraction.
Spectacle Soft RGP
2.0 3.0
1.0
2.0
-2.0 1.0
-1.0 -1.0
0.0 0.0
-1.0 0.0
1.0 0.5
1.0 -2.0
2.0
(a) (b) (c)
Figure 3. Wavefront aberrations of the right eye (OD) of subject KF displayed as iso-
aberration contour maps. Correction method was (a) spectacle, (b) soft hydrogel contact
lens and (c) rigid gas-permeable contact lens. The wavefront is displayed to match
clinicians’ view of the pupil: Left (Temporal), Right (Nasal), Top (Superior) and Bottom
(Inferior). Iinterval between contour lines is 0.5λ = 0.316µm). Contour labels have units
of µm. White is the peak of wave aberrations and black is the valley.
By comparison, the wavefront error for the RGP correction (Fig. 3c) was
greatly reduced, as expected if the lens replaced the irregular corneal surface
with a smooth spherical surface that reduced corneal astigmatism and high-order
irregularities. Zernike analysis indicates little residual astigmatism, which is
consistent with clinical experience for RGP lenses. The magnitude of aberrations
of the eye with RGP lens is reduced dramatically (4-fold reduction in terms of
peak-valley value) compared to the spectacle condition. A similar reductions of
corneal aberrations was observed for all subjects in our study.Spex
Soft
Subject: KF RGP
10 arcmin
Spatial Frequency (cpd)
(a) (b)
Figure 4. Monochromatic (a) radial-averaged modulation transfer functions (rMTF’s)
and (b) point spread functions (PSF’s) calculated from the wave aberrations of Figure 3.
The intersection of rMTF’s and neural threshold are the cutoff spatial frequency and the
areas between rMTF’s and neural threshold are enveloped areas of perceivable
contrasts. (b) The intensity of point spread functions are γ-corrected to show the low-
intensity tails. The sizes of images of PSF’s are 10 arcminutes.
Measures of retinal image quality derived from the aberration functions in
Fig. 3 are shown in Fig. 4. The RGP lens provided the best MTF and the most
compact PSF, while the SH lens has the worst MTF and the widest PSF. These
qualitative observations were reflected in quantitative measures of cutoff spatial
frequency, enveloped area, and Strehl ratio reported in Table 2. A similar
analysis for the other subjects is reported next.
Correlation of optical quality and visual performance
A summary of the objective measures of optical quality determined for
each lens on each eye results is shown in Table 2. The lens which provided best
image quality by each metric is shown in bold-face type. In nearly every case
these objective results agreed with the subjective rating of visual clarity reported
in Table 1. The only exception was for the Strehl-Ratio metric for subject CB.
Likewise, in most cases the lens given the worst rating for visual clarity also gave
the worst optical performance.
Table 2. The derived optical measures (wave variance, cutoff spatial frequency,
enveloped area and Strehl ratio) for different optical corrections of different subjects.
Bold-face type indicates the correcting lens which provided superior optical quality.
Subject Eye (OD) Spectacle Soft RGP
Wave variance (µm2) 0.358 0.230 0.105
CB Cutoff SF (cpd) 39.8 39.2 46.9
Enveloped area 8.83 8.69 14.2Strehl ratio 0.0223 0.0182 0.0413
2
Wave variance (µm ) 0.345 0.7158 0.0604
KF Cutoff SF (cpd) 36.1 34.0 40.7
Enveloped area 7.26 5.61 12.1
Strehl ratio 0.0142 0.0118 0.0365
Wave variance (µm2) 0.629 0.759 0.278
NH Cutoff SF (cpd) 36.6 31.3 39.7
Enveloped area 7.68 4.90 8.76
Strehl ratio 0.0169 0.0084* 0.0124
Wave variance (µm2) 0.587 0.235 0.359
PP Cutoff SF (cpd) 36.5 43.9 43.1
Enveloped area 7.16 11.6 9.09
Strehl ratio 0.0136 0.0300 0.0259
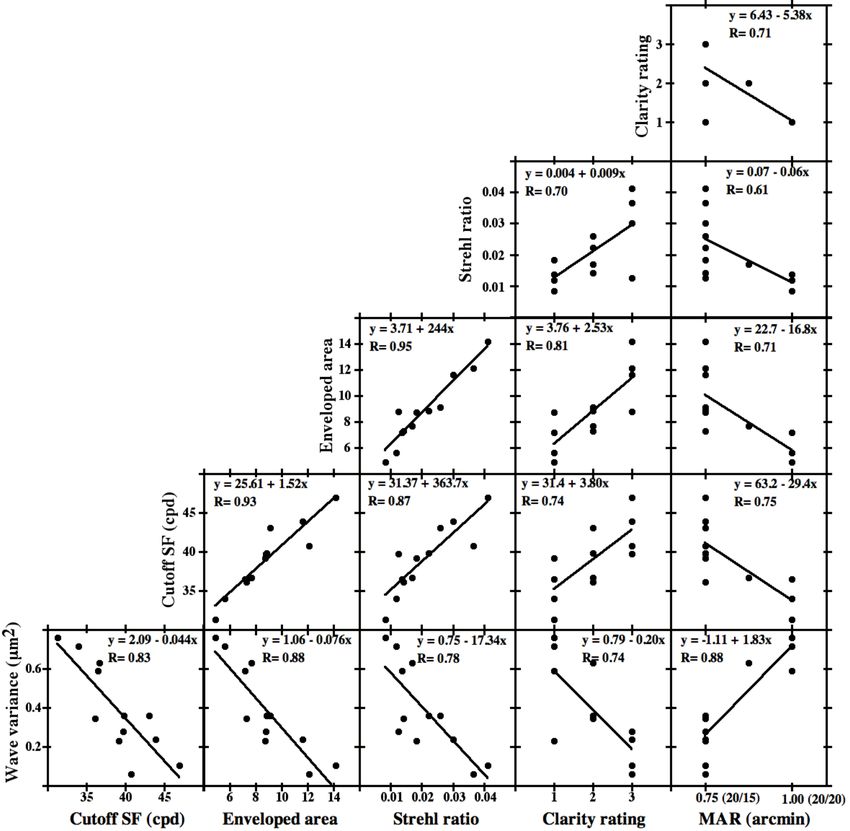
A quantitative analysis of the correlation between the 4 metrics of optical
quality and 2 metrics of visual performance is presented in Fig. 5. These results
indicate high correlation between different optical measures which can be
understood qualitatively. Smaller wave variance should give a better MTF and a
sharper PSF, therefore resulting in a higher cutoff spatial frequency, a larger
enveloped area, and a higher Strehl ratio. The metrics with highest correlation
are enveloped area with Strehl ratio (r2=0.9), and enveloped area with cutoff
spatial frequency (r2=0.86). Such high correlation values indicates a high level of
redundancy in the description of optical quality with multiple optical measures.
To find the metric of optical quality that correlates best with visual
performance, we created the matrix of scatter plots and linear regressions shown
in Fig. 5. Every optical measure used in this study correlates well with the
subjective rating for visual clarity and subjective measurements of visual acuity.
The minimum correlation coefficient (0.61) was for Strehl Ratio vs. MAR and the
maximum correlation (0.88) was for wavefront variance vs. MAR. These strong
correlations indicate that any of these four optical measures could be used to
quantify visual performance but wave variance is the best and Strehl ratio the
worst for our group of subjects. Some caution is required for interpreting these
results, however, since visual clarity is not necessarily a linear scale, and both
performance measures are quantized whereas the optical metrics are all
continuous variables.Figure 5. The correlation between optical measures and visual performances. The
correlation scatter plots are organized into triangular matrix. Each data point is for a
single subject wearing a particular optical correction (N=4 subjects X 3 lenses = 12
points per scatter plot).
Given the above results, we selected wavefront variance as the optical
measure of choice to compare the different types of correcting lens. The results,
averaged across subjects, is presented in Fig. 6. Clearly that the RGP lens had
significant better optical quality than the other two lenses. The SH lens gave
almost the same visual performance as spectacle. The variability of performances
was greatest in SH lenses, possibly because of variability in conformity to the
cornea.Figure 6. The average performances of three different optical corrections (spectacle and
soft, RGP contact lenses). The optical measure chosen for comparison here is the wave
variance. The error bars indicate ± 1 standard error of the mean.
Role of high-order aberrations
a Asymmetric aberrations
The asymmetric aberrations normally refer to those Zernike modes which
are rotationally anti-symmetric. Under this notation, the asymmetric aberrations
include odd-order (1st, 3rd, 5th, 7th and 9th) Zernike aberrations. We show, in Figure
7, the wave variances of asymmetric aberrations (including 3rd, 5th, 7th and 9th
order aberrations) of different type of optical corrections for all subjects. Our data
on asymmetric aberrations is consistent with the previous studies [Howland,
1978; Williams, 1994] that the 3rd order aberrations (comas and trefoils) were the
dominating asymmetric aberrations. the previous conclusions.Figure 7. The wave variances of asymmetric aberrations of spectacles and soft, RGP
contact lenses for 4 different subjects CB, KF, NH and PP. The standard errors of means
are too small to show up in this graph.
The human eye usually has considerable amounts of asymmetric
aberrations, which is confirmed by the measured asymmetric aberrations when
subjects were wearing spectacles. Since the irregular corneal anterior surface
contributes significantly to the asymmetric aberrations [Artal, 1998; Hong, 2001],
the eye with soft lens would be expected to have similar amounts of asymmetric
aberrations as the eye with spectacle if the soft lens conform and align perfectly
to the cornea. However, our data shows that the asymmetric aberrations of the
eye with soft lens are quite different from those of the eye with spectacle. For the
toric cornea, the soft lens didn’t conform to the cornea well and thus has quite
different asymmetrical aberrations, as shown by subject KF (see Figure 3 and
Figure 7) and subject NH (see Figure 8 and Figure 7). The bad-fitting of soft toric
contact lens (subject NH) can be problematic. For subject NH, the soft contact
lens was habitually sitting on the temporal superior part of the cornea, which
generate the asymmetric wavefront as shown by Figure 8. These large
asymmetric aberrations explained why subject NH prefers the RGP lens and the
spectacle much better than the soft contact lens.
Figure 8. The wave aberration
-2.0 map for subject NH when
wearing soft contact lens. The
-1.0
interval between contour lines is
0.0 0.5λ. Left (Temporal), Right
1.0 (Nasal), Upper (Superior) and
0.0 Lower (Inferior). The wavefront
-1.0 is centered at the superior
temporal part of pupil.
The asymmetric aberrations of eyes with RGP lenses are much smaller
than those with other two optical corrections. Our data confirms Atchison’s
theoretical prediction that the decentration of spherical RGP lens induced only
small amounts of asymmetric aberrations. More importantly, the RGP lens
provides the smooth spherical surface and neutralizes the asymmetric
aberrations of the cornea by filling in corneal irregularity with tears. The reduced
amounts of asymmetric aberrations contribute to the superior visual
performances of RGP lenses.
b Longitudinal spherical aberration (LSA)
Longitudinal spherical aberration is usually defined as the difference
between axial dioptric powers for paraxial and marginal rays. Positive spherical
aberration means that the power is greater for marginal rays than for paraxial
rays. Using these conventions we use the wavefront aberration function to
calculate the amount of spherical aberrations of eyes wearing different optical
corrections and the results are shown in Figure 9. Both types of contact lenseschanged the amount of spherical aberrations in the negative direction when
compared to the spectacle control condition. This resulted in less positive
spherical aberration for those subjects (CB, NH, PP) who had positive aberration
in the control condition and more negative aberration for the subject (KF) who
had negative aberration in the control condition. These results may help explain
why correcting myopia with a contact lens sometimes gives better vision than for
spectacles since the amount of positive spherical aberration can evidently be
reduced by the lens.
Figure 9. The spherical aberrations of spectacle and soft, RGP lenses for subject CB, KF,
NH and PP. The positive value of the spherical aberration means stronger power at the
pupil margin.
Discussion
Relative performance of hard and soft contact lenses
For our 4 subjects, the reduced corneal aberrations produced by RGP
lenses resulted in better optical performance of the eye. However, this is not
necessarily a general rule because in some individuals the aberrations of the
cornea compensate for the aberrations of the crystalline lens, resulting in an eye
with little net aberration. If the corneal aberrations of such an eye were to be
neutralized by an RGP lens, the balance between cornea and crystalline lens
would be upset and the net aberrations of the whole eye would increase. Thus
we understand an otherwise paradoxical situation in which the reduction of
corneal aberrations with an RGP lens could increase the aberrations of the whole
eye.
Asymmetric aberrationsOptical modeling suggests that asymmetric aberrations introduced by
decentration of RGP lens are small [Atchison, 1995]. Nevertheless, we attempted
to avoid any such aberrations by waiting for the contact lens to settle on the eye
for 3 seconds after a blink before taking aberration measurements. Thus, the
amount of asymmetric aberrations of the eye when corrected by the RGP lens
may have been greater immediately after a blink. Further experimentation
would be required to answer this question.
Present results support the hypothesis that the irregularity and asphericity
of the anterior cornea was more or less transferred to the flexible anterior surface
of the SH lens and was eliminated by the rigid surface of the RGP contact lens.
This suggests that the quantitative aberration analysis described in this report
may prove useful in the future to measure the conformity of soft lenses.
Longitudinal spherical aberration (LSA)
Our finding that spherical aberration changes in the negative direction
when myopia is corrected by contact lenses is consistent with previous
theoretical predictions [Cox, 1990; Atchison, 1995]. There are two apparent
reasons for the change. First, the anterior surface of a contact lenses with
negative power has larger radius of curvature than does the natural cornea,
which therefore reduces the amount of positive spherical aberration contributed
by the anterior corneal surface. Second, correcting myopia with spectacles
changes spherical aberration of the eye in a positive direction because a negative
spectacle diverges rays (see Figure 1), thereby increasing the angle of incidence
of rays compared to an emmetropic eye with the same corneal shape. Thus the
control condition of spectacle correction is biased in the direction of positive
spherical aberration. By switching to a contact lens, this bias is removed and, at
the same time, the shape of the anterior refracting surface is altered, again in a
direction which reduces the amount of positive spherical aberration of the eye.
Thus both factors work in concert to reduce the eye’s positive spherical
aberration.
The reduction of spherical aberration was found to be much less for RGP
lenses than for SH lenses. This difference can be explained by the different
asphericity values of the lenses on the eye. Soft contact lenses conform to the
cornea, at least to some extent, thus preserving the relatively small amounts of
spherical aberration of the natural cornea. To the contrary, a hard lens with
spherical surfaces will replace the natural cornea with a surface that has a large
amount of positive spherical aberration. Thus the net change in the negative
direction produced by the two mechanisms described above will be less for RGP
lenses compared to SH lenses.
Comparison with optical models
Cox’s optical model of a soft lens on the cornea can be used to account for the
measured differences of longitudinal spherical aberrations between SH lenses
and spectacles [Cox, 1990]. According to Table 4B in Cox’s paper, the combined
cornea + SH lens of subject KF (Rx=-5.50D, r=7.365mm and p=0.6329) should
have 0.33D of spherical aberration and subject NH (Rx=-6.50D, r=7.739 and
p=0.8956) should have 0.95D of aberration for a 6mm pupil. By comparison, thespherical aberration for the spectacle + cornea combination can be calculated by
ray tracing method if the corneal topography is known. We therefore gathered
toptography information for two subjects (KF, NH) using the EyeSys, Inc. corneal
topographer. The spherical aberrations for spectacle/cornea combination was
computed to be 1.769D for KF and 2.303D for NH. Therefore the difference
between soft lens and spectacle conditions should be -1.47D for KF and -1.35D
for NH, which is very close to the experimental results of -1.54D for KF and -
1.56D for NH reported in Fig. 9.
The small remaining discrepancy may be due to (a) the slightly different
fitting factor (about 1.16) for subject KF and NH compared to the fitting factor
(1.10) in theoretical calculation and (b) the mechanism and the degree of
conformity. A previous study [Plainis & Charman, 1998] indicated that the
power of the tear lens could vary in the range from –0.48D to 0.38D. The same
source can also contribute to the aberrations of the soft lens + eye system. The
test of the existing flexure hypotheses by the differences of back vertex powers
between on-eye and in vitro narrowed down the candidates of good flexure
hypotheses, but still can’t determine which one actually represented the reality of
conformity [Plainis & Charman, 1998]. Perhaps by using aberration analysis
associated with the conformity, we may come to understand how the soft lens
conforms to the cornea.
The differences of spherical aberrations between RGP lens and spectacle
reported in Fig. 9 were also in agreement with theoretical prediction. The
spherical aberrations are 1.39D for KF and 1.30D for NH for RGP lens + cornea
combination for a 6mm pupil (see Table 4A in Cox’s paper). Therefore the
predicted difference should be –0.38D for KF and –1.00D for NH, which is
consistent with the experimental difference –0.214D for KF and –1.33D for NH.
The remaining discrepancy might be attributed to parameter changes in RGP
lens caused by cleaning and handling which is well-documented in the literature
[O’Donnell, 1994].
Acknowledgement
This study was supported by NEI grant R01-EY05109 from the National
Institutes of Health. X. Hong is supported by the SOLA Graduate Fellowship in
Ophthalmic Optics.
References
1. P. Artal and A. Guirao, "Contributions of the cornea and the lens to the aberrations of
the human eye", Opt. Lett., Vol. 23, 1713-1715, 1998.
2. D. A. Atchison, "Aberrations associated with rigid contact lens", J. Opt. Soc. Am. A,
Vol. 12, No. 10, 2267-2273, 1995.
3. G. L. Bauer, "Longitudinal spherical aberration of modern opthalmic lenses and its effect
on visual acuity", Appl. Opt. 19, 2226-2234, 1980.
4. E. S. Bennett and V. A. Henry, "Clinical manual of contact lenses", 2nd Edition,
LippincottWilliams & Wilkins, 1999.
5. M. Born and E. Wolf, "Principle of optics", 6th edition, Cambridge Press, 1998.6. M.J. Collins, B. Brown, D. A. Atchison, and S. D. Newman, "Tolerance to spherical
aberration induced by rigid contact lenses", Ophth. Physiol. Opt. 12, 24-28, 1992.
7. I. Cox, "Theoretical calculation of the longitudinal spherical aberration of rigid and soft
contact lenses", Optom. Vis. Sci., Vol. 67, No. 4, 277-282, 1990.
8. I. Cox and B. A. Holden, "Soft contact lens-induced longitudinal spherical aberration
and its effect on contrast sensitivity", Optom. Vis. Sci., Vol. 67, No. 9, 679-683, 1990.
9. J. De Brabander, N. Chateau, F. Bouchard and S. Guidollet, "Contrast sensitivity with
soft contact lenses compensated for spherical aberration in high ametropia", Optom. Vis.
Sci., Vol. 75, No. 1, 37-43, 1998.
10. S. G. El Hage and F. Berny, "Contribution of the crystalline lens to the spherical
aberration of the eye", J. Opt. Soc. Am. Vol. 63, 205-211, 1973.
11. D. Fonn, C. A. Gauthier and N. Pritchard, "Patient preferences and comparative ocular
responses to rigid and soft contact lenses", Optom. Vis. Sci., Vol. 72, No. 12, 857-863,
1995.
12. J. W. Goodman, "Introduction to Fourier optics", McGraw-Hill, 1968.
13. A. Guirao, D. R. Williams and I. G. Cox, "Effect of rotation and translation on the
expected benefit of ideal contact lenses", OSA TOPS, Vol. 35, Vision Science and Its
Applications, 324-329, 2000.
14. R. M. Hammer and B. A. Holden, "Spherical aberration of aspheric contact lenses on
eye", Optom. Vis. Sci., Vol. 71, No. 8, 522-528, 1991.
15. X. Hong and L. N. Thibos, " Longitudinal evaluation of optical aberrations following
Laser in situ Keratomileusis surgery", J. Refr. Surg., Vol. 16, No. 5, 647-650, 2000.
16. H. C. Howland and B. Howland, "A subjective method for the measurement of
monochromatic aberrations of the eye", J. Opt. Soc. Am., Vol. 67, 1508-1518, 1977.
17. T. J. Johnson and C. M. Schnider, "Clinical performance and patient preferences for
hydrogel versus RGP lenses: a crossover study", Int. Contact Lens Clin., Vol., 18, 130-
135, 1991.
18. J. Liang, B. Grimm, S. Goelz and J. Bille, "Objective measurement of the wave
aberrations of the human eye with the use of a Hartmann-Shack wave-front sensor", J.
Opt. Soc. Am., A11, 1949-1957, 1994.
19. J. Liang and D. R. Williams, "Aberrations and retinal image quality of the normal
human eye", J. Opt. Soc. Am., Vol. 14, No. 11, 2873-2883, 1997.
20. S. Marcos, S. A. Burns, E. Moreno-Barriusop and R. Navarro, "A new approach to the
study of ocular chromatic aberrations", Vis. Res., Vol. 39, 4309-4323, 1999.
21. K. Munson, X. Hong and L. N. Thibos, "Use of a Shack-Hartmann Aberrometer to
Access the Optical Outcome of Corneal Transplantation in Keratoconic Eye", Optom.
Vis. Sci. (submitted)
22. J. J. O'Donnell, "Patient-induced power changes in rigid gas permeable contact lenses: a
case report and literature review", J. Am. Optom. Assoc., Vol. 65, No. 11, 772-773,
1994.
23. S. Plainis and W. N. Charman, "on-eye power characteristics of soft contact lenses",
Optom. Vis. Sci., Vol. 75, No. 1, 44-54, 1998.
24. T. O. Salmon, L. N. Thibos and A. Bradley, "Comparison of the eye's wave-front
aberration measured psychophysically and with the Shack-Hartmann wave-font sensor",
J. Opt. Soc. Am., A15, 2457-2465, 1998.25. D. Sliney and M. Wolbarsht, "Safety with lasers and other optical sources: a
comprehensive handbook", Plenum Press, 1980.
26. L. N. Thibos and X. Hong, "Clinical applications of the Shack-Hartmann Aberrometer",
Optom. Vis. Sci., Vol. 76, No. 12, 817-825, 1999.
27. G. T. Timberlake, M. G. Doane and J. H. Bertera, "Short-term, low-contrast visual
acuity reduction associated with in vivo contact lens drying", Optom. Vis. Sci., Vol. 69,
No. 10, 755-760, 1992.
28. G. Westheimer, "Aberrations of contact lenses", Am. J. Optom, Arch. Am. Acad.
Optom., Vol. 38, 445-448, 1961.You can also read