ONTOREALSUMM : ONTOLOGY BASED REAL-TIME TWEET SUMMARIZATION
←
→
Page content transcription
If your browser does not render page correctly, please read the page content below
OntoRealSumm : Ontology based Real-Time Tweet
 Summarization
 PIYUSH KUMAR GARG, Indian Institute of Technology Patna, India
arXiv:2201.06545v1 [cs.SI] 17 Jan 2022

 ROSHNI CHAKRABORTY, Aalborg University, Denmark
 SOURAV KUMAR DANDAPAT, Indian Institute of Technology Patna, India
 The huge popularity of social media platforms, like Twitter, attracts a large fraction of users to share real-time
 information and short situational messages during disasters which belong to different topics/categories. A
 summary of all the messages is required by the government organizations, agencies, and volunteers for effi-
 cient and quick disaster response. Therefore, we propose an ontology based real-time tweet summarization
 (OntoRealSumm) for disasters which generates a summary of the tweets related to disasters with minimum
 human intervention. Given tweets related to a disaster, OntoRealSumm ensures fulfilment of the objectives
 related to disaster tweet summarization, such as identification of a category of each tweet and summarization
 of each category considering the category importance with respect to the disaster and ensuring information
 coverage of each category and diversity in summary. Comparing the performance with state-of-the-art tech-
 niques on 10 disaster datasets validates the effectiveness of OntoRealSumm.
 CCS Concepts: • Information systems → Summarizations.
 Additional Key Words and Phrases: Disaster tweets, Summarization, Ontology, Category summarization, So-
 cial media

 1 INTRODUCTION
 Recently, social media platforms, like Twitter, have been extensively used by users across the world
 to share opinions, promote products, spread awareness and updates on events and disasters. It has
 been often observed that an event is reported on social media platforms before it is covered on
 any mainstream media [77]. Similarly, the active participation of users on Twitter has made it an
 important source for continuous updates on any disaster [56]. However, due to the high volume
 of Twitter messages and continuous generation of real-time updates, it is very difficult to get a
 holistic view of an ongoing event, like disasters, which continuously generates new information.
 Continuous monitoring and summarization of messages related to a disaster are required by gov-
 ernment and volunteer organizations for effective disaster response. Prior studies [28, 31, 58] show
 that messages during a disaster are of different categories 1 [28], like infrastructure damage [55, 57],
 victim needs [3, 16], volunteer operations [4, 32], emotional response [37], affected population [22]
 and many others. An effective summary of the disaster should include all the relevant information
 related to all the categories while ensuring information diversity.
 Therefore, there are two major steps for tweet summarization related to disasters, identification
 of the different groups/categories of tweets such that each group/category comprises of tweets that
 are related to the same topic/sub-event and further, selection of representative tweets from each
 group/category to form a summary [50, 58, 62, 65]. Existing disaster summarization approaches
 have proposed unsupervised and supervised learning based approaches for identifying the cate-
 gories/groups. Existing unsupervised approaches, such as graph-based approaches [17, 19, 20] and
 topic-based approaches [46] utilize the content similarity of the tweets to identify different cate-
 gories. However, the high vocabulary diversity, presence of inherent noise and the high number
 of overlapping keywords present in tweets makes automatic identification of categories and fails
 of the inherent semantic meaning of tweets by unsupervised approaches challenging. To address
 this, Rudra et al. [60, 63] proposed a supervised approach for category identification which explic-
 itly identifies the categories of tweets by AIDR [30] and then, create a summary summarize by
 1A category consists of information related to a same topic/sub-event with respect to any disaster.
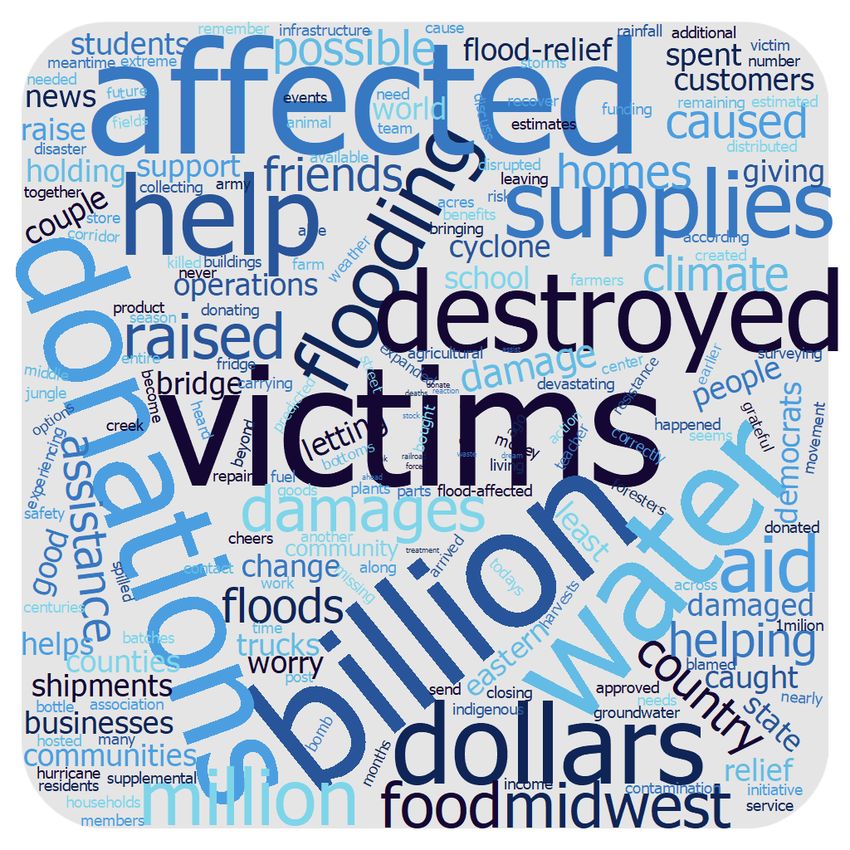
(a) (b) (c)

Fig. 1. We show the word cloud of category Affected Population of 3 different disasters, such as U.S. Floods
in Figure 1(a), Harda Twin Train Derailment in Figure 1(b) and Hagupit Typhoon in Figure 1(c).

selecting appropriate tweets from each category. However, the proposed approach is dependent
on AIDR [30] for category identification of a tweet that requires human intervention for each
dataset [29]. Therefore, while unsupervised approaches fail to automatically identify categories,
supervised approaches require significant human intervention, which is highly difficult to obtain.
 In order to select the representative tweets from each category/group in the second step of
summarization, existing research works [17, 58, 62] have proposed Integer Linear Programming
(ILP) [61], LUHN [42], PageRank [52], Centrality [6], maximum degree [20], maximum length [19]
and maximum marginal relevance [8]. However, existing disaster summarization approaches con-
sider equal importance of each category given a disaster. Moreover, all categories might not be
equally important [9]. Furthermore, none of these approaches considers that the information
present in the same category varies across disasters (as shown in Figure 1 and Table 1). Under-
standing the importance of each category with respect to a disaster guide us in selecting the ap-
propriate number of representative tweets from each category to create the summary. However,
to ensure real-time summarization, we need to minimize human intervention.

Table 1. We show the presence of 5 categories in 6 disasters, like Chile Earthquake, 2010 (D1 ), Italy Earthquake,
2016 (D2 ), India-Pakistan Flood, 2014 (D3 ), South Sulawesi Flood, 2019 (D4 ), Haiyan Typhoon, 2013 (D5 ), and
Megi Typhoon, 2010 (D6 ) based on the information from Wikipedia.

 SNo Category D1 D2 D3 D4 D5 D6
 1 Affected Population Yes Yes Yes Yes Yes Yes
 2 Infrastructure Dam- Yes Yes Yes Yes Yes Yes
 age
 3 Aftershocks Yes Yes No No No No
 4 Donations No No Yes No Yes Yes
 5 International Aid No No Yes No Yes Yes

 In this paper, we propose an ontology based real-time tweet summarizer, OntoRealSumm to gen-
erate a summary automatically given the tweets related to a disaster with minimal human interven-
tion. OntoRealSumm explicitly captures the importance of a category with respect to the disaster
and further, ensures information coverage of each category in the final summary by a three-phase
system. In the first phase, OntoRealSumm identifies the category of a tweet by ontology based
pseudo-relevance based feedback approach. It follows self-supervised learning by utilizing exist-
ing disaster ontology, namely Empathi [21] for automatic classification of tweets into categories
and then, utilizes these classified tweets as feedback to determine the categories of the remaining
tweets. Therefore, by using an existing ontology, it can handle both the information diversity of
each category and manage the vocabulary gap by utilizing semantic similarity [78] without any
human intervention. Furthermore, by integration of feedback based information from already clas-
sified tweets, it ensures it can handle the inherent issues of tweets, like short length, presence of
noise and difference in vocabulary with the ontology to identify the category of a tweet given a
disaster with high precision. In the second phase, we determine the specific importance of each
category with respect to the disaster. For this, identify disasters which are similar on the basis
of categories to automatically identify the importance of a category with respect to each type of
disaster. Therefore, identifying a disaster which has similar information content in categories as
that of the given disaster aids in automatic determination of the importance of each category of
the disaster and thus, determining the number of tweets to be selected from each category. Finally,
OntoRealSumm selects the number of tweets from each category which maximizes the information
coverage of the category and ensures diversity in summary to form the disaster summary by Max-
imal Marginal Relevance based [8]. Therefore, it can automatically identify the category of tweets,
capture category importance, ensure both information coverage of each category and diversity in
summary with minimal human intervention.
 We evaluate the effectiveness of OntoRealSumm on 10 disaster events and compare our results
with the existing research works in terms of ROUGE-N [40] scores. Our results indicate that Onto-
RealSumm is better than existing research works by 2.69% to 31.05% ROUGE-1 F1-scores, 5.51% to
41.93% ROUGE-2 F1-scores, and 4.08% to 17.55% ROUGE-L F1-scores on an average. Additionally,
we perform experiments to analyze the performance of the OntoRealSumm in identifying the cat-
egory of a tweets and study the role of the different components of the OntoRealSumm. We finally
perform a failure analysis of to highlight the shortcomings of OntoRealSumm. We discuss related
works in Section 2 and the datasets details in Section 3. In Section 4, we present problem definition
and discuss details of OntoRealSumm in Section 5. We discuss the experiment details in Section 6
and results in Section 6.2. Finally, we conclude our summary in Section 7.

2 RELATED WORKS
There is a plethora of existing tweet summarization approaches which differ based on their applica-
tion, like sports events [23, 25, 27], political events [35, 53], social events [48, 69], disaster [67, 68]
and news event [10, 13, 82]. Based on the application, these tweets summarization approaches
utilize the temporal [76], the content diversity [2, 11, 45] or both to select the summary tweets.
However, as discussed in Section 1, there is high content diversity across different categories of a
disaster and further, the presence and importance of categories differ from one disaster to another.
Therefore, these existing summarization approaches on different applications can not be directly
applied to tweets related to a disaster.
 During a disaster, a huge number of tweets that comprises of real-time and situational infor-
mation is posted by eye-witnesses and affected people [81]. Therefore, to ensure immediate help,
there is a requirement of automated techniques that can identify, extract, and summarize the rele-
vant required information from this huge information overload [4, 33, 73]. Existing disaster tweet
summarization approaches can be primarily categorized into abstractive [39, 59] or extractive sum-
marization [14, 68] approaches. In this paper, we focus on developing an extractive summarization
approach. Most of the existing extractive tweet summarization approaches can further be seg-
regated based on their proposed methodology into graph based [17], content based [71], deep
learning approaches [15, 36], or integration of multiple approaches [66]. We discuss each of these
approaches in details next.
 Existing content based disaster summarization approaches explore the high variance in the fre-
quency and presence of keywords related to a disaster [61, 62] to generate the summary. Addi-
tionally, several approaches initially classify each tweet either as relevant or non-relevant tweets
and then, they summarize relevant tweets by semi-supervised learning [12] or supervised learn-
ing [44, 58, 65] on the basis of the tweet content followed by selection of representative tweets
from relevant tweets by different techniques, like ILP [61], LSA [24], LUHN [42] or PageRank [52].
Additionally, recent research works utilize neural network-based techniques to utilize the tweet
contents, such as Dusart et al. [15] propose utilization of BERT model [41] to identify the impor-
tance of a tweet. Li et al. [36] proposed the utilization of the graph convolutional neural networks
on a tweet similarity graph to calculate the tweet importance and thereby, select tweets with most
importance to create a summary. However, both of these approaches require huge training data.
However, these summarization approaches do not consider the categories and therefore, fail to
ensure the information coverage of each category in the summary [75].
 In order to handle these challenges, several research works have proposed graph based tweet
summarization approaches [18, 19] which initially creates the tweet similarity graph which rep-
resents tweets as nodes and an edge represent the similarity between a pair of tweets and then,
groups similar tweets together by identifying communities from the tweet similarity graph. Fi-
nally, these approaches select representative tweets from each group based on the length, degree
or centrality based measures to generate the summary [6]. Therefore, these approaches ensure
integration of similar information together by the edge relationships in the graph, implicit iden-
tification of categories and further, ensure information coverage and reduction of redundancy by
selecting representative tweets from each category. For example, Dutta et al. [20] propose a com-
munity based approach to identify the different sub-groups from the tweet similarity graph and
finally, select representative tweets by centrality based measures to create a summary. However,
these approaches rely on community based measures to inherently identify the categories of the
disaster, which is very challenging due to high vocabulary overlap across categories in a disas-
ter. These approaches consider only content based similarity to identify the category, which can
not ensure handling of the inherent issues in tweets [11]. Additionally, these approaches do not
consider the difference in importance of categories and their information content across different
disasters.
 Therefore, to cater to the different requirements, recent disaster summarization based approaches
initially identify the categories from the tweets and then, create a summary from each of these
categories. For example, Rudra et al. [60, 64] use existing category identification classifier, i.e.,
AIDR [30] to identify the categories. In [60], the authors create a word graph for each category
and then, select representative tweets from each word graph on the basis of the presence of the
most important words while ensuring information coverage in summary. Similarly, in [64], the
authors initially identify the sub-event from each category for a disaster and then select the rep-
resentative tweets from each category such that the selected tweet has the maximum number of
content words of that (i.e., nouns, verbs, and numerals) to create a summary. However, AIDR re-
quires human intervention for each new disaster event and is applicable only for real-time disaster
events. Furthermore, none of these approaches considers the difference in category vocabulary and
importance across disasters. Therefore, there is a need to develop a system that can automatically
identify the categories of the disaster with minimum human intervention and further, capture the
specific and implicit importance of each category given a disaster in the disaster summary.
However, there are several challenges in identifying the category of a tweet, like the presence of
a category and high content diversity within a category vary across the different disasters. There-
fore, we propose OntoRealSumm that utilizes an existing disaster ontology, Empathi [21] to ef-
fectively identify the category of a tweet irrespective of the disaster in the first phase and then,
ensure category based representation and information coverage to generate the summary. We dis-
cuss datasets details next.

3 DATASET
In this Section, we discuss the datasets, pre-processing details and gold standard summary.

3.1 Dataset Details and Pre-processing
We evaluate the performance of OntoRealSumm on 10 disaster datasets which are as follows. An
overview of these datasets is shown in Table 2.
 (1) 1 : This dataset is prepared based on the Sandy Hook Elementary School Shooting 2 in which
 around 26 people, including 20 children and 6 adults were killed in December, 2012. This
 dataset is taken from [17].
 (2) 2 : This dataset is prepared based on the Uttarakhand Flood 3 which caused dreadful floods
 and landslides in Uttarakhand, India in June, 2013. This dataset is taken from [17].
 (3) 3 : This dataset is prepared based on the devastating impact of the strong cyclone, Hagupit
 Typhoon 4 on Philippines in December, 2014 which led to the death of around 18 people and
 evacuation of 916 people. This dataset is taken from [17].
 (4) 4 : This dataset is prepared based on the Hyderabad Blast, India 5 in which two consecutive
 bomb blasts killed 17 people and injured 119 people in February, 2013. This dataset is taken
 from [17].
 (5) 5 : This dataset is prepared based on the Harda Twin Train Derailment, India 6 in which
 31 people died, and 100 got injured. The incident happened in August, 2015. This dataset is
 taken from [61].
 (6) 6 : This dataset is prepared based on the Los Angeles International Airport Shooting 7 in
 which around 15 people were injured and 1 person was killed. The incident happened in
 November, 2013. This dataset is taken from [51].
 (7) 7 : This dataset is prepared based on the devastating impact of the terrible hurricane, Hurri-
 cane Matthew 8 on Haiti in October, 2016 which led to the death of 603 people and evacuation
 of 1.5 million people. This dataset is taken from [1].
 (8) 8 : This dataset is prepared based on the Puebla Mexico Earthquake 9 in which 370 people
 died, and 6011 got injured. The incident happened in September, 2017. This dataset is taken
 from [1].
 (9) 9 : This dataset is prepared based on the Pakistan Earthquake 10 in which 40 people died, and
 850 got injured. The incident happened in September, 2019. This dataset is taken from [1].

2 https://en.wikipedia.org/wiki/Sandy_Hook_Elementary_School_shooting
3 https://en.wikipedia.org/wiki/2013_North_India_floods
4 https://en.wikipedia.org/wiki/Typhoon_Hagupit_(2014)
5 https://en.wikipedia.org/wiki/2013_Hyderabad_blasts
6 https://en.wikipedia.org/wiki/Harda_twin_train_derailment
7 https://en.wikipedia.org/wiki/2013_Los_Angeles_International_Airport_shooting
8 https://en.wikipedia.org/wiki/Hurricane_Matthew
9 https://en.wikipedia.org/wiki/2017_Puebla_earthquake
10 https://en.wikipedia.org/wiki/2019_Kashmir_earthquake
(10) 10 : This dataset is prepared based on the Midwestern U.S. Floods 11 which caused dreadful
 floods and massive damages in Midwestern United States in March 2019 to December 2019.
 This dataset is taken from [1].

Table 2. We show the details of the 10 datasets, including dataset number, year, number of tweets, type of
disaster, country, and continent.

 SNo Dataset Year Number Type of Country Continent
 of disaster
 tweets
 1 1 2012 2080 Man-made United States USA
 2 2 2013 2069 Natural India Asian
 3 3 2014 1461 Natural Philippines Asian
 4 4 2013 1413 Man-made India Asian
 5 5 2015 1676 Man-made India Asian
 6 6 2013 1409 Man-made United States USA
 7 7 2016 1654 Natural Haiti USA
 8 8 2017 2015 Natural Mexico USA
 9 9 2019 1958 Natural Pakistan Asian
 10 10 2019 1880 Natural United States USA

 Pre-processing and Gold Standard Summary: As we consider only the tweet text in the OntoReal-
Summ, we perform pre-processing to remove URLs, usernames, emoticons, punctuation marks, and
noise from the tweet text. We use gold standard summary provided by Dutta et al. [17] for 1 - 4
and by Rudra et al. [61] for 5 . For 6 - 10 , we ask 3 annotators to prepare a summary of 40 tweets
for each dataset. We follow the procedure by Dutta et al. [17] to combine the individual summaries
to prepare the final gold standard summary.

4 PROBLEM STATEMENT
Given a disaster event, , that comprises of tweets, T = {T1 , T2, . . . , T }, we intend to create a
summary, S of T . As in most summarization applications, we assume that the length of the sum-
mary, , is provided. We previously discussed in Section 1 that a disaster tweet summarization
approach must ensure information coverage of all the categories present in T where informa-
tion coverage of a category refers to representation of all the important aspects of that category
in S [80]. As there are many different mechanisms, such as topics, keywords, a combination of
content and context based information, to represent aspects [59], we do not provide any specific
method to calculate information coverage and only provide an intuition of information cover-
age next. We refer to information of as ( ) which refers to the aspects present in and
measure the information coverage provided by a tweet, T , of as (T , ( )). Therefore,
 (T , ( )) measures the number of aspects that are present in which are covered by T .
We show all the used notations and corresponding descriptions for OntoRealSumm in Table 3.
 As previously highlighted by existing summarization approaches, the tweets selected in sum-
mary, S, must be diverse among each other, i.e., no two tweets selected in S convey same in-
formation and every tweet in S adds novel information [8, 80]. Therefore, diversity ensures to
minimize redundancy S. In order to ensure diversity in S, it is required to select that tweet into S
such that it maximizes the novelty of information and reduces redundancy in S. Existing research
11 https://en.wikipedia.org/wiki/2019_Midwestern_U.S._floods
Table 3. We show notations and their corresponding description used in OntoRealSumm.
Notation Description
Given a disaster event dataset
Number of tweets in
Set of tweets in
ℎ indexed tweet
Desired length summary (number of tweets)
Total number of categories
Generated summary
ℎ category in
, Tunable parameters
( ) Importance of a category
(T , ( )) Information coverage provided by tweet, of
D ( , )) Diversity if tweet added to
( , ) Semantic Similarity score between and
( , ) Content based similarity between and
( ) Weight score of
( ) Keywords of , such as nouns, verbs, and adjectives
( ) Comprise keywords of
( ) Highest Semantic Similarity score among all for
works measure diversity, i.e., the novelty of information, by the presence of keywords, aspects,
content or contextual information that has not been covered by the tweets already selected in sum-
mary [62, 64]. We use D (T , ) to measure the diversity provided by selecting T into S. Therefore,
to create S, we need to select tweets iteratively that can maximize both information coverage of
each , (T , ( )), and diversity of the summary, D (T , ) simultaneously.
However, this requires knowledge about the category of T which is not known apriori as dis-
cussed in Section 1. Additionally, the importance of a category, i.e., the number of tweets to be
selected from a category in S is required to create S. However, we have previously shown that
the importance of a category varies from disaster to disaster and therefore, requires an automated
system that can determine the importance of each category. We refer to the list of categories as
C = {C1, C2, . . . , C } such that there are categories present in T and the importance of a cate-
gory, as ( ) which measures the number of tweets to be selected from . Thus, we intend to
select tweets from T such that it maximizes the information coverage present in each category,
( ) in C and diversity in S on the basis of ( ). We formally define the problem as
Ø
Ø
= max ( (T , ( )) + D (T , ))
T ∈C ,1≤ ≤
=1 =1
Õ
(1)
. . =
=1
where, I = {I1 , I2 , I3 , . . . , I } represents of the importance of each category/ number of tweets
to be selected from each category, and are tunable parameters that consider the importance ofinformation coverage and diversity respectively [8]. Therefore, we intend to propose an automatic tweet summarization approach that fulfils all these objectives. • Identification of the category of each tweet, Phase-I : We propose a self-supervised approach to identify the category, of a tweet, T . The approach identifies the category of T on the basis of semantic similarity of T with an existing ontology and then, uses the relevant knowledge of the identified tweets as feedback to identify the category of tweets which could not be resolved directly by semantic similarity. • Determination of importance of each category, Phase-II : We determine the importance of each , ( ), with respect to using a Linear Regression model. On the basis of ( ), we select the number of tweets from in S. • Representative tweets selection from , Phase-III : We select the representative tweets from each to ensure (T , ( )) and D ( , )) of a in S. 5 PROPOSED APPROACH In this Section, we discuss proposed approach in details. 5.1 Overview The proposed approach, OntoRealSumm comprises of three phases, Phase-I where we identify the category of T , Phase-II where we compute the importance of for , and finally, Phase-III in which we select representative tweets from that ensures information coverage of each category while maintaining the importance of the category and diversity in summary. For Phase-I, we pro- pose an ontology based pseudo-relevance feedback approach to identify the category of a tweet. For Phase-II, we proposed a metric to compare the similarity between two disaster events con- sidering content and probability distribution of tweets across categories. By identifying a similar disaster, we predict the number of tweets to be selected from each category in the final summary. Finally, in Phase-III, we select the number of tweets as predicted in Phase-II from each category which ensures information coverage and diversity of each category in the final summary. Although in this sequential process of summarizing, we require some data pre-processing and knowledge base in the form of ontology, it does not require human intervention to get an effective summary in real-time. We show the overview of OntoRealSumm in Figure 2. We next describe each of these steps of the OntoRealSumm in detail. 5.2 Phase-I To identify the category of a tweet, we propose an ontology based pseudo-relevance feedback approach. Although there are several different disasters specific ontology available [38, 47, 70, 79], we choose Empathi [21] as it provides the maximum number of categories and covers information related to different types of disasters compared to others. The Empathi disaster ontology comprises of 70 categories and the vocabulary of these categories. We identify the category of those tweets which have high similarity with Empathi by Semantic Similarity score [78], ( , ) of a category, with the tweet, as shown in Equation 2. ( , ) = ( , ) ∗ ( ) (2) ( , ) is the product of content based similarity of the tweet with the category, ( , ), and the weight of the category, ( ) that represents the number of keywords in . We calcu- late ( , ) as the overlap of the tweet keywords, ( ), with the category keywords,
Fig. 2. An overview of OntoRealSumm is shown

 ( ). We consider only nouns, verbs, and adjectives of as ( ) [34] and ( ) as the
normalised number of keywords in as shown in Equation 3.

 ( )
 ( ) = Í (3)
 ∈ ( )
 where, is the total number of categories. On the basis of ( , ), we assign the cate-
gory of which has the highest Semantic Similarity score, ( ) among all categories.

 ( ) = arg max ( ( , )) (4)
 ∈
 Our observations indicate that around 10 − 30% of the total tweets remain unclassified as they
have no overlap with any of the category keywords. The reason being the high vocabulary diversity
in tweets [26, 54]. Therefore, we use the information from the classified tweets of the category
as feedback to increase the existing vocabulary of the disaster category. We create an extended
vocabulary of the category by including only those keywords with frequencies greater than 3 of
the already classified tweets [72]. We use this extended vocabulary to determine the category of
the unclassified tweets. Although we can not ensure the classification of all the tweets, we observe
only a small number of tweets, i.e., around 1 − 10% of the total tweets remain unclassified after this
step. We show in Table 4 the fraction of tweets classified in each of the steps and the fraction of
tweets that are unclassified for 10 disaster events. We do not consider the tweets whose category
could not be determined in Phase-I.

5.3 Phase-II
After identifying the category of the tweets related to a disaster, we determine the importance
of a category with respect to a disaster (say ). The importance of a category, , is needed to
Table 4. We show the % of classified tweets using ontology vocabulary (Pass-I), extended vocabulary (Pass-II),
and remaining tweets after Pass-I and Pass-II for 10 datasets.

 Event Pass-I Pass-II Remaining Event Pass-I Pass-II Remaining
 tweets tweets
 1 72.64 27.15 0.19 6 80.57 14.41 5.01
 2 89.72 7.43 2.84 7 99.51 0.36 0.12
 3 67.22 22.35 10.41 8 99.20 0.44 0.29
 4 73.58 17.55 8.85 9 98.05 1.38 0.56
 5 76.95 11.29 11.75 10 97.17 2.34 0.47

determine the number of tweets to be selected from each category in the final disaster summary.
Therefore, of represents the total number of tweets to be selected from given . We use a
linear regression model to predict the number of tweets to be included in the final summary. This
regression model is trained with a disaster dataset (say ), which is very similar to in terms
of content and tweet distribution across categories. To identify for a given , we propose a
metric disaster similarity score.
 Disaster Similarity Score : Content of the tweets across the categories and the distributions of
the tweets across categories vary with disasters. We propose a disaster similarity score, ( , )
to compute the similarity between any pair of disasters, and . We define ( , )
as the weighted score of information content of the categories, and similarity in probability
distribution between categories . We compute as (1- ) where is the Jensen Shannon
Divergence of two events. ( , ) is calculated as :

 ( , ) = 1 ∗ + 2 ∗ (5)
 s.t. 1 + 2 = 1 (6)
 1, 2 ∈ (0, 1) (7)
 as the cosine simi-
where, 1 and 2 are the weights of and respectively. We calculate
larity [49] of the most frequent occurring keywords between and for a category, and
as the average cosine similarity over all categories as shown in Equation 8.

 1 Õ

 = (8)
 =1
where is the total number of categories. We calculate by the Jensen-Shannon divergence 12
score of a disaster pair and . measures the similarity of the probability distributions of the
categories between and . We select as the disaster which has maximum similarity with
 on the basis of ( , ) where, ∈ 0, 1, . . . , and is the total number of disasters we
have. We discuss this experiment and our observations in detail in Subsection 6.5.

5.4 Phase-III
We finally select from each category using a representative tweet selection approach that can
captures the maximum information coverage and ensures diversity in summary. Based on the
experiment where we compare different selection approaches, such as Semantic similarity score
12 https://en.wikipedia.org/wiki/Jensen%E2%80%93Shannon_divergence
based [78], Eigenvector centrality based [5], PageRank based [7], K-mean clustering based [43], and
Maximal Marginal Relevance based selection [8], we select MMR in OntoRealSumm. We show the
experiment and our observations in details in Subsection 6.6. MMR uses an incremental approach,
comparing each tweet to the current summary tweet to determine its inclusion in summary. We
discuss the experiments next.

6 EXPERIMENTS
In this Section, we initially discuss the details of the existing research works related to disaster
summarization which we use as baseline methods for comparison. Then we provide a performance
comparison of baseline methods with the proposed approach OntoRealSumm.

6.1 Baselines
We compare OntoRealSumm with following state-of-the-art summarization approaches:

 (1) 1 : Rudra et al. [63] propose a summarization framework that initially identifies the tweets,
 which comprises of most important disaster-specific keywords, such as numerals, nouns,
 verbs, and location. Then, the authors create a graph where the nodes represent all the words
 of the identified tweets, and an edge is created between two words if they had occurred as
 a bigram in any of the tweets. Finally, they select those paths from the graph, which can
 ensure maximum information coverage to generate the summary.
 (2) 2 : Dutta et al. [17] propose an ensemble graph based summarization approach which ini-
 tially generates summary by 9 existing text summarization algorithms. The authors create a
 tweet similarity graph where the nodes represent the tweets present in the summary of any-
 one of the 9 existing text summarization algorithms and the edges represent their content
 and context similarity. Finally, the authors follow a community detection algorithm to auto-
 matically identify the categories and then select representative tweets from each category
 on the basis of length, informativeness and centrality scores to create the summary.
 (3) 3 : Rudra et al. [64] propose a sub-event based summarization approach that initially iden-
 tifies the sub-events and then, they generate a summary by selecting representative tweets
 by Integer Linear Programming based selection such that it ensures maximum information
 coverage of sub-events.

6.2 Comparison with Existing Research Works
To evaluate the performance of the OntoRealSumm, we compare the summary generated by the
OntoRealSumm and the existing research works with the ground truth summary on the basis of
ROUGE-N score [40]. ROUGE-N score computes the overlapping words in the generated summary
with a set of ground truth summary. We calculate precision, recall and F1-score for 3 different
variants of ROUGE-N score, i.e., N=1, 2 and L, respectively. Our observations from Table 5 indi-
cate that OntoRealSumm ensure better ROUGE-N precision, recall and F1-scores in comparison
with baselines. The improvement in summary scores of ROUGE-1 F1-score ranges from 1.96% to
62.74%, ROUGE-2 F1-score ranges from 4.34% to 73.33% and ROUGE-L F1-score ranges from 3.57%
to 20.68% respectively. The improvement is highest over the 3 baseline and lowest with the 2
baseline. The performance of the OntoRealSumm is the best for 5 with 0.58 − 0.29 and worst for
 4 with 0.47 − 0.28 in Rouge-1, Rouge-2 and Rouge-L F1-scores.
Table 5. Precision, recall and F1-score of ROUGE-1, ROUGE-2 and ROUGE-L score of OntoRealSumm and
baselines on 10 datasets is shown.

 Dataset Approaches ROUGE-1 ROUGE-2 ROUGE-L
 Precision Recall F1-score Precision Recall F1-score Precision Recall F1-score
 0.56 0.48 0.51 0.21 0.18 0.20 0.31 0.27 0.29
 1 1 0.49 0.58 0.53 0.24 0.29 0.26 0.31 0.36 0.33
 2 0.59 0.47 0.52 0.25 0.20 0.22 0.32 0.27 0.29
 3 0.44 0.53 0.48 0.18 0.22 0.20 0.25 0.29 0.27
 0.46 0.45 0.46 0.17 0.17 0.17 0.27 0.26 0.27
 2 1 0.32 0.35 0.33 0.14 0.15 0.14 0.23 0.25 0.24
 2 0.44 0.32 0.37 0.18 0.14 0.16 0.28 0.22 0.25
 3 0.39 0.44 0.41 0.11 0.13 0.12 0.23 0.26 0.24
 0.50 0.48 0.49 0.19 0.18 0.19 0.28 0.27 0.28
 3 1 0.36 0.36 0.36 0.14 0.14 0.14 0.29 0.29 0.29
 2 0.50 0.34 0.40 0.23 0.15 0.18 0.32 0.23 0.27
 3 0.42 0.47 0.44 0.17 0.18 0.17 0.23 0.25 0.24
 0.49 0.44 0.47 0.19 0.17 0.18 0.29 0.27 0.28
 4 1 0.29 0.36 0.32 0.12 0.14 0.13 0.22 0.27 0.24
 2 0.48 0.35 0.41 0.19 0.14 0.16 0.29 0.23 0.26
 3 0.43 0.48 0.45 0.16 0.18 0.17 0.24 0.26 0.25
 0.58 0.58 0.58 0.29 0.29 0.29 0.31 0.30 0.31
 5 1 0.35 0.62 0.44 0.18 0.32 0.23 0.24 0.40 0.29
 2 0.48 0.54 0.51 0.22 0.25 0.23 0.26 0.29 0.28
 3 0.48 0.58 0.53 0.23 0.28 0.25 0.25 0.29 0.27
 0.57 0.56 0.56 0.23 0.23 0.23 0.29 0.28 0.29
 6 1 0.50 0.47 0.49 0.23 0.22 0.22 0.29 0.28 0.29
 2 0.57 0.41 0.48 0.21 0.15 0.18 0.29 0.22 0.25
 3 0.50 0.55 0.52 0.20 0.22 0.21 0.25 0.27 0.23
 0.54 0.45 0.49 0.17 0.14 0.15 0.25 0.22 0.23
 7 1 0.45 0.51 0.48 0.12 0.14 0.13 0.24 0.21 0.22
 2 0.57 0.40 0.47 0.17 0.12 0.14 0.27 0.21 0.22
 3 0.49 0.40 0.44 0.14 0.11 0.12 0.24 0.20 0.22
 0.48 0.49 0.48 0.15 0.16 0.16 0.25 0.24 0.25
 8 1 0.43 0.48 0.45 0.13 0.14 0.13 0.22 0.24 0.23
 2 0.51 0.43 0.46 0.15 0.13 0.14 0.26 0.22 0.24
 3 0.43 0.46 0.44 0.13 0.14 0.14 0.22 0.24 0.23
 0.56 0.45 0.50 0.17 0.14 0.15 0.25 0.21 0.23
 9 1 0.26 0.16 0.20 0.05 0.03 0.04 0.25 0.17 0.20
 2 0.50 0.44 0.47 0.15 0.13 0.14 0.22 0.20 0.21
 3 0.45 0.45 0.45 0.11 0.11 0.11 0.21 0.21 0.21
 0.51 0.50 0.51 0.13 0.12 0.13 0.22 0.22 0.22
 10 1 0.26 0.15 0.19 0.06 0.03 0.04 0.22 0.15 0.18
 2 0.51 0.45 0.48 0.10 0.09 0.10 0.22 0.19 0.20
 3 0.50 0.49 0.50 0.12 0.12 0.12 0.22 0.22 0.22

6.3 Identification of Category of a Tweet
In this Subsection, we evaluate the effectiveness of Phase-I of OntoRealSumm, proposed self-supervised
tweet category identification approach with an existing unsupervised approach (UnSuA). We se-
lect the approach followed by Dutta et al. [19] for identifying categories to summarize disaster
tweets as UnSuA. Although there are several existing unsupervised approaches, we found [19] to
be most successful. In [19], the authors propose utilization of Louvain community detection algo-
rithm [74] to identify communities which inherently represents categories related to the disaster.
For an experiment, we select 20% tweets randomly from each category for Phase-I of OntoReal-
Summ and UnSuA from 3 disaster events, such as, 2 , 3 and 6 . We ask 3 volunteers who had
a good knowledge of English and provide them with these tweets for annotation. On comparing
the performance of Phase-I of OntoRealSumm with UnSuA as shown in Table 6, we observe that
Phase-I of OntoRealSumm has better performance of atleast 43% in F1-score. Based on our observa-
tions, we found that unsupervised approaches can not directly segregate the tweets into different
categories due to the high vocabulary overlap across different categories and immense vocabu-
lary diversity in each category on the basis of information related to tweet text. Utilization of the
semantic information from ontology in Phase-I helps in categorization of tweets and therefore,
increases the performance.

Table 6. F1-score of Phase-I of OntoRealSumm and unsupervised tweet category identification approach
(UnSuA) on comparing the volunteers annotations for 3 disasters, such as, 2 , 3 , and 6 is shown.

 Dataset Approach F1-score
 2 Phase-I of OntoRealSumm 67.07
 UnSuA 38.72
 3 Phase-I of OntoRealSumm 64.58
 UnSuA 23.37
 6 Phase-I of OntoRealSumm 62.99
 UnSuA 29.93

6.4 Determining Relevance of Category Importance
In Phase-II of OntoRealSumm, we propose a linear regression based model to calculate the im-
portance of each category given a disaster based on the assumption that the importance of the
category varies across disasters. Although we discuss this assumption by intuition in Section 1,
we show this through an experiment next. For our experiments, we compare the summaries gen-
erated by OntoRealSumm and summaries generated by an approach when each category is given
equal importance, EqCatSumm on 6 datasets, such as, 2 , 3 , 4 , 5 , 6 , and 9 . To generate
the summary by EqCatSumm, we follow Phase-III of OntoRealSumm for selection of tweets from
each category. We show the precision, recall, and F1-score for 3 different variants of the ROUGE-
N score, i.e., N=1, 2, and L, in Table 7 which indicates that OntoRealSumm performs consistently
better than EqCatSumm. Therefore, we have empirically shown how identifying the importance
of each category given a disaster is essential for effective disaster tweet summarization.

6.5 Comparing Disaster Similarity
On comparing ( , ) for every disaster pair, we observe that any disaster has the most
similarity score with a disaster that belongs to the same continent, such as USA or ASIA and is of
the same type, i.e., man-made or natural. For example, Uttarakhand Flood ( 2 ) has the highest score
with disaster Pakistan Earthquake ( 9 ) among all the disasters. Similarly, Sandy Hook Elementary
School Shooting ( 1 ) has the highest score with Los Angeles International Airport Shooting ( 6 )
among all the disasters. Therefore, we term and as homogeneous disasters if they belong
to the same continent and is of the same type. Subsequently, we term and as heterogeneous
disasters if they do not satisfy either of these two conditions. We validate next the impact of training
on a homogeneous disaster or a heterogeneous disaster on the summary quality. We show the results
in Table 8.
 For each disaster , we predict the number of tweets to be selected from each category as pre-
dicted by the linear regression model if it was trained on homogeneous disaster or heterogeneous
disaster. We, then, select the representative tweets from each category based on the predicted
number of tweets to create the summary and finally, compare the generated summary with the
ground-truth summary on the basis of ROUGE-N scores. For the experiments, we randomly select
Table 7. F1-score of ROUGE-1, ROUGE-2 and ROUGE-L score on comparing OntoRealSumm which identifies
the importance of each category with an approach when each category gives equal importance, EqCatSumm
is shown.

 Dataset Approach ROUGE-1 ROUGE-2 ROUGE-L
 F1-score F1-score F1-score
 2 OntoRealSumm 0.46 0.17 0.27
 EqCatSumm 0.42 0.14 0.24
 3 OntoRealSumm 0.49 0.19 0.28
 EqCatSumm 0.47 0.17 0.27
 4 OntoRealSumm 0.47 0.18 0.28
 EqCatSumm 0.42 0.13 0.24
 5 OntoRealSumm 0.58 0.29 0.31
 EqCatSumm 0.50 0.20 0.26
 6 OntoRealSumm 0.56 0.23 0.29
 EqCatSumm 0.53 0.19 0.25
 9 OntoRealSumm 0.50 0.15 0.23
 EqCatSumm 0.48 0.14 0.21

5 disasters, such as, 2 , 4 , 5 , 7 , and 8 . We show the precision, recall, and F1-score for 3 differ-
ent variants of the ROUGE-N score, i.e., N=1, 2, and L, respectively, in Table 9. Our observations
indicate that there is around 7 − 21% and 6 − 9% increase in ROUGE-2 F1-score for any disaster
in Asia and USA, respectively, for both man-made and natural disasters. Therefore, our observa-
tions indicate that an effective summary for can be ensured if we identify the importance of
categories from a is which of the same type and from the same continent as .

Table 8. We show the disaster similarity scores for every disaster pair. The first row and first column of this
Table represent the various disasters.

 1 2 3 4 5 6 7 8 9 10
 1 0.4 0.43 0.44 0.44 0.52 0.43 0.39 0.45 0.4
 2 0.4 0.54 0.5 0.48 0.44 0.5 0.5 0.55 0.5
 3 0.43 0.54 0.44 0.4 0.47 0.46 0.46 0.51 0.44
 4 0.44 0.5 0.44 0.51 0.45 0.47 0.45 0.48 0.45
 5 0.44 0.48 0.4 0.51 0.45 0.46 0.45 0.48 0.47
 6 0.52 0.44 0.47 0.45 0.45 0.44 0.45 0.48 0.43
 7 0.43 0.5 0.46 0.47 0.46 0.44 0.52 0.48 0.55
 8 0.39 0.5 0.46 0.45 0.45 0.45 0.52 0.49 0.52
 9 0.45 0.55 0.51 0.48 0.48 0.48 0.48 0.49 0.46
 10 0.4 0.5 0.44 0.45 0.47 0.43 0.55 0.52 0.46

6.6 Comparing different Regression Models
In this Subsection, we compare 3 different types of regression models, such as, Linear regression
model ( 1 ), Ridge regression ( 2 ) model, and Bayesian regression model ( 3 ) to understand which
model should be selected to predict the number of tweets from each category into summary given
 . In order to understand this, given any similar disaster to , say , we train 1 , 2 and 3
Table 9. F1-score of ROUGE-1, ROUGE-2 and ROUGE-L score of OntoRealSumm for training a linear regres-
sion model on a dataset from homogeneous and heterogeneous disasters on 5 datasets is shown.

 Dataset Training ROUGE-1 ROUGE-2 ROUGE-L
 disaster F1-score F1-score F1-score
 5 0.50 0.19 0.29
 1 6 0.51 0.20 0.30
 9 0.49 0.18 0.28
 10 0.49 0.19 0.28
 1 0.43 0.14 0.25
 2 5 0.43 0.15 0.25
 8 0.44 0.15 0.25
 9 0.46 0.17 0.27
 4 0.58 0.29 0.30
 5 6 0.56 0.27 0.28
 7 0.56 0.27 0.29
 9 0.53 0.23 0.28
 1 0.47 0.12 0.21
 7 5 0.46 0.11 0.21
 9 0.47 0.13 0.22
 10 0.49 0.15 0.23
 1 0.45 0.12 0.23
 8 2 0.46 0.15 0.24
 4 0.46 0.14 0.24
 7 0.48 0.16 0.25

respectively on the categories of and predict the number of tweets from each category for .
We evaluate the performance of 1 , 2 and 3 through mean squared error as shown in Equation 9.

 1 Õ

 ( ) = ( − ) 2 (9)
 =1
 where and are the number of tweets from each category in ground truth summary and
predicted by the regression model respectively, is the number of categories in and could be
1, 2 or 3. Therefore, lower the value of ( ), better is the performance of . For the experi-
ments, we randomly select 5 different disasters, such as, 1 , 4 , 5 , 6 , and 9 and compare the
performance of 1 , 2 or 3 on the basis of ( ). We show our observations in Table 10 which
indicate that 1 performs the best followed by 3 and 2 . Therefore, based on these observations,
we select 1 , i.e., Linear regression model in OntoRealSumm to automatically identify the number
of tweets to be selected from a category given a disaster.

6.7 Identifying Representative Tweets from a Category
In this Subsection, we compare the performance of Semantic similarity score based [78] ( 1 ), Eigen-
vector centrality based [5] ( 2 ), PageRank based [7] ( 3 ), K-mean clustering based [43] ( 4 ), and Max-
imal Marginal Relevance based selection [8] ( 5 ) for Phase-III. For the experiments, we randomly
select 4 different disasters, such as 2 , 3 , 5 , and 6 . We compute the F1-scores for 3 different
variants of ROUGE-N score, i.e., N=1, 2, and L respectively. Our observation from Figure 3 indicate
Table 10. We compare Mean Square Error ( ) of 3 different regression models, i.e, Linear, Ridge, and
Bayesian models.

 Dataset Linear Ridge Bayesian
 1 2.84 2.93 3.22
 4 1.12 1.14 1.15
 5 1.37 2.19 2.28
 6 1.66 1.85 2.88
 9 4.13 4.13 4.40

 0.6 S1 0.30 S1
 S2 S2
 S3 S3
 0.5 S4 0.25 S4
 S5 S5

 0.4 0.20
 ROUGE-1 F1-score

 ROUGE-2 F1-score

 0.3 0.15

 0.2 0.10

 0.1 0.05

 0.0 D2 D3 D5 D6 0.00 D2 D3 D5 D6
 Dataset Dataset

 (a) (b)

 S1
 0.30 S2
 S3
 S4
 S5
 0.25
 ROUGE-L F1-score

 0.20

 0.15

 0.10

 0.05

 0.00 D2 D3 D5 D6
 Dataset

 (c)

Fig. 3. F1-score of ROUGE-1 in Figure 3(a), ROUGE-2 in Figure 3(b) and ROUGE-L score in Figure 3(c) of On-
toRealSumm for 5 different representative tweets selection methods, i.e., Semantic similarity score based ( 1 ),
Eigenvector centrality based ( 2 ), PageRank based ( 3 ), K-mean clustering based ( 4 ), and Maximal Marginal
Relevance (MMR) based ( 5 ) on 4 disasters is shown.

that 5 consistently performs the best followed by 1 and 2 . 3 performs the worst irrespective of
the dataset. Therefore, based on our observations, we select 5 , i.e., MMR based selection approach
in OntoRealSumm.
6.8 Limitations of OntoRealSumm
We discuss the limitations of OntoRealSumm that we have observed next.
 (1) Dependence on Existing Ontology : As OntoRealSumm relies on an existing ontology to iden-
 tify the categories of a tweet, it is not directly applicable for other summarization applica-
 tions, like news events, user opinions regarding products, etc., unless an existing ontology for
 that application is available. We are working towards developing an ontology automatically
 from publicly available resources for any application as a future direction so that OntoReal-
 Summ is not dependent on an existing ontology.
 (2) Identification of category of a Tweet : OntoRealSumm can not identify the categories of all
 tweets. For example, we found among all the disasters, OntoRealSumm performs the worst
 for 5 , where it could not identify the category for around 12% of the tweets. Therefore, we
 believe Phase-I of OntoRealSumm could be further improved such that the category of more
 number of tweets could be identified.
 (3) Generalizability of OntoRealSumm : As we currently do not have any dataset from other
 continents except Asia and USA, we can not ensure the generalizability of OntoRealSumm
 irrespective of location. To resolve this, we are working towards collection of tweets related
 to disasters from different locations and preparation of ground truth summaries for them
 such that we can validate the performance of OntoRealSumm as one of our future directions.

7 CONCLUSIONS AND FUTURE WORKS
In this paper, we propose OntoRealSumm which can generate a real-time tweet summary for a
disaster with minimal human intervention. OntoRealSumm utilizes a three-phase approach to ex-
plicitly handles multiple challenges, like improving categorization quality, finding the importance
of each category, ensuring information coverage and information diversity of each category in the
final summary. Our experimental analysis shows that OntoRealSumm can ensure 6 − 42% increase
in Rouge-N F1-scores over existing research works. Through experiments, we show the effective-
ness of each Phase of OntoRealSumm in generating a summary with minimum human intervention.
As a future goal, we plan to extend OntoRealSumm such that it is not dependent on an ontology
by automatically creating the ontology as well as we are working towards improvement in the
categorization of Phase-I.

REFERENCES
 [1] Firoj Alam, Umair Qazi, Muhammad Imran, and Ferda Ofli. 2021. HumAID: Human-Annotated Disaster Incidents
 Data from Twitter with Deep Learning Benchmarks. In Proceedings of the Fifteenth International AAAI Conference on
 Web and Social Media, ICWSM. AAAI Press, 933–942.
 [2] Syed Muhammad Ali, Zeinab Noorian, Ebrahim Bagheri, Chen Ding, and Feras Al-Obeidat. 2020. Topic and sentiment
 aware microblog summarization for twitter. Journal of Intelligent Information Systems 54, 1 (2020), 129–156.
 [3] Moumita Basu, Anurag Shandilya, Kripabandhu Ghosh, and Saptarshi Ghosh. 2018. Automatic matching of resource
 needs and availabilities in microblogs for post-disaster relief. In Companion Proceedings of the The Web Conference
 2018. International World Wide Web Conferences Steering Committee, Republic and Canton of Geneva, Switzerland,
 25–26.
 [4] Moumita Basu, Anurag Shandilya, Prannay Khosla, Kripabandhu Ghosh, and Saptarshi Ghosh. 2019. Extracting
 resource needs and availabilities from microblogs for aiding post-disaster relief operations. IEEE Transactions on
 Computational Social Systems 6, 3 (2019), 604–618.
 [5] Phillip Bonacich. 1972. Factoring and weighting approaches to status scores and clique identification. Journal of
 mathematical sociology 2, 1 (1972), 113–120.
 [6] Stephen P Borgatti. 2005. Centrality and network flow. Social networks 27, 1 (2005), 55–71.
 [7] Sergey Brin and Lawrence Page. 1998. The anatomy of a large-scale hypertextual web search engine. Computer
 networks and ISDN systems 30, 1-7 (1998), 107–117.
[8] Jaime Carbonell and Jade Goldstein. 1998. The use of MMR, diversity-based reranking for reordering documents and
 producing summaries. In Proceedings of the 21st annual international ACM SIGIR conference on Research and develop-
 ment in information retrieval. ACM, New York, NY, USA, 335–336.
 [9] Carlos Castillo. 2016. Big crisis data: social media in disasters and time-critical situations. Cambridge University Press.
[10] Roshni Chakraborty, Maitry Bhavsar, Sourav Dandapat, and Joydeep Chandra. 2017. A network based stratification
 approach for summarizing relevant comment tweets of news articles. In International Conference on Web Information
 Systems Engineering. Springer, 33–48.
[11] Roshni Chakraborty, Maitry Bhavsar, Sourav Kumar Dandapat, and Joydeep Chandra. 2019. Tweet summarization of
 news articles: An objective ordering-based perspective. IEEE Transactions on Computational Social Systems 6, 4 (2019),
 761–777.
[12] Yan Chen, Xiaoming Zhang, Zhoujun Li, and Jun-Ping Ng. 2015. Search engine reinforced semi-supervised classifica-
 tion and graph-based summarization of microblogs. Neurocomputing 152 (2015), 274–286.
[13] Yijun Duan and Adam Jatowt. 2019. Across-time comparative summarization of news articles. In Proceedings of the
 Twelfth ACM International Conference on Web Search and Data Mining. ACM, New York, NY, USA, 735–743.
[14] Alexis Dusart, Karen Pinel-Sauvagnat, and Gilles Hubert. 2021. ISSumSet: a tweet summarization dataset hidden in a
 TREC track. In Proceedings of the 36th Annual ACM Symposium on Applied Computing. 665–671.
[15] Alexis Dusart, Karen Pinel-Sauvagnat, and Gilles Hubert. 2021. TSSuBERT: Tweet Stream Summarization Using BERT.
 arXiv preprint arXiv:2106.08770 (2021).
[16] Ritam Dutt, Moumita Basu, Kripabandhu Ghosh, and Saptarshi Ghosh. 2019. Utilizing microblogs for assisting post-
 disaster relief operations via matching resource needs and availabilities. Information Processing & Management 56, 5
 (2019), 1680–1697.
[17] Soumi Dutta, Vibhash Chandra, Kanav Mehra, Asit Kumar Das, Tanmoy Chakraborty, and Saptarshi Ghosh. 2018.
 Ensemble algorithms for microblog summarization. IEEE Intelligent Systems 33, 3 (2018), 4–14.
[18] Soumi Dutta, Vibhash Chandra, Kanav Mehra, Sujata Ghatak, Asit Kumar Das, and Saptarshi Ghosh. 2019. Sum-
 marizing microblogs during emergency events: A comparison of extractive summarization algorithms. In Emerging
 Technologies in Data Mining and Information Security. Springer, 859–872.
[19] Soumi Dutta, Asit Kumar Das, Abhishek Bhattacharya, Gourav Dutta, Komal K Parikh, Atin Das, and Dipsa Ganguly.
 2019. Community Detection Based Tweet Summarization. In Emerging Technologies in Data Mining and Information
 Security. Springer, 797–808.
[20] Soumi Dutta, Sujata Ghatak, Moumita Roy, Saptarshi Ghosh, and Asit Kumar Das. 2015. A graph based clustering
 technique for tweet summarization. In 2015 4th international conference on reliability, infocom technologies and opti-
 mization (ICRITO)(trends and future directions). IEEE, 1–6.
[21] Manas Gaur, Saeedeh Shekarpour, Amelie Gyrard, and Amit Sheth. 2019. empathi: An ontology for emergency manag-
 ing and planning about hazard crisis. In 2019 IEEE 13th International Conference on Semantic Computing (ICSC). IEEE,
 396–403.
[22] Saptarshi Ghosh, Kripabandhu Ghosh, Debasis Ganguly, Tanmoy Chakraborty, Gareth JF Jones, Marie-Francine
 Moens, and Muhammad Imran. 2018. Exploitation of social media for emergency relief and preparedness: Recent
 research and trends. Information Systems Frontiers 20, 5 (2018), 901–907.
[23] Mehreen Gillani, Muhammad U Ilyas, Saad Saleh, Jalal S Alowibdi, Naif Aljohani, and Fahad S Alotaibi. 2017. Post
 summarization of microblogs of sporting events. In Proceedings of the 26th International Conference on World Wide
 Web Companion. ACM, New York, NY, USA, 59–68.
[24] Yihong Gong and Xin Liu. 2001. Generic text summarization using relevance measure and latent semantic analysis. In
 Proceedings of the 24th annual international ACM SIGIR conference on Research and development in information retrieval.
 ACM, New York, NY, USA, 19–25.
[25] Poonam Goyal, Prerna Kaushik, Pranjal Gupta, Dev Vashisth, Shavak Agarwal, and Navneet Goyal. 2019. Multilevel
 event detection, storyline generation, and summarization for tweet streams. IEEE Transactions on Computational
 Social Systems 7, 1 (2019), 8–23.
[26] Mahmud Hasan, Mehmet A Orgun, and Rolf Schwitter. 2019. Real-time event detection from the Twitter data stream
 using the TwitterNews+ Framework. Information Processing & Management 56, 3 (2019), 1146–1165.
[27] Yue Huang, Chao Shen, and Tao Li. 2018. Event summarization for sports games using twitter streams. World Wide
 Web 21, 3 (2018), 609–627.
[28] Muhammad Imran and Carlos Castillo. 2015. Towards a data-driven approach to identify crisis-related topics in social
 media streams. In Proceedings of the 24th International Conference on World Wide Web. Association for Computing
 Machinery, New York, NY, USA, 1205–1210.
[29] Muhammad Imran, Carlos Castillo, Jesse Lucas, Patrick Meier, and Jakob Rogstadius. 2014. Coordinating human and
 machine intelligence to classify microblog communications in crises.. In ISCRAM. ISCRAM.
[30] Muhammad Imran, Carlos Castillo, Ji Lucas, Patrick Meier, and Sarah Vieweg. 2014. AIDR: Artificial intelligence for
 disaster response. In Proceedings of the 23rd international conference on world wide web. ACM, New York, NY, USA,
 159–162.
[31] Muhammad Imran, Prasenjit Mitra, and Carlos Castillo. 2016. Twitter as a lifeline: Human-annotated twitter corpora
 for NLP of crisis-related messages. arXiv preprint arXiv:1605.05894 (2016).
[32] Muhammad Imran, Ferda Ofli, Doina Caragea, and Antonio Torralba. 2020. Using AI and Social Media Multimodal
 Content for Disaster Response and Management: Opportunities, Challenges, and Future Directions. Information
 Processing & Management 57, 5 (2020).
[33] Marc-André Kaufhold, Markus Bayer, and Christian Reuter. 2020. Rapid relevance classification of social media posts
 in disasters and emergencies: A system and evaluation featuring active, incremental and online learning. Information
 Processing & Management 57, 1 (2020), 102132.
[34] Muhammad Asif Hossain Khan, Danushka Bollegala, Guangwen Liu, and Kaoru Sezaki. 2013. Multi-tweet summa-
 rization of real-time events. In 2013 International Conference on Social Computing. IEEE, 128–133.
[35] Tae-Yeon Kim, Jaekwang Kim, Jaedong Lee, and Jee-Hyong Lee. 2014. A tweet summarization method based on a
 keyword graph. In Proceedings of the 8th International Conference on Ubiquitous Information Management and Com-
 munication. ACM, New York, NY, USA, 1–8.
[36] Quanzhi Li and Qiong Zhang. 2021. Twitter Event Summarization by Exploiting Semantic Terms and Graph Network.
 In Proceedings of the AAAI Conference on Artificial Intelligence, Vol. 35. AAAI Press, Palo Alto, California USA, 15347–
 15354.
[37] LI Lifang, WANG Zhiqiang, Qingpeng Zhang, and WEN Hong. 2020. Effect of anger, anxiety, and sadness on the
 propagation scale of social media posts after natural disasters. Information Processing & Management 57, 6 (2020),
 102313.
[38] Minu Limbu, D Wang, T Kauppinen, and J Ortmann. 2012. Management of a Crisis (MOAC) vocabulary specification.
 Web: http://observedchange. com/moac/ns/(zuletzt besucht am: 29-07-2014) (2012).
[39] Chen Lin, Zhichao Ouyang, Xiaoli Wang, Hui Li, and Zhenhua Huang. 2021. Preserve Integrity in Realtime Event
 Summarization. ACM Transactions on Knowledge Discovery from Data (TKDD) 15, 3 (2021), 1–29.
[40] Chin-Yew Lin. 2004. Rouge: A package for automatic evaluation of summaries. In Text summarization branches out.
 ACL, 74–81.
[41] Yang Liu and Mirella Lapata. 2019. Text summarization with pretrained encoders. Proceedings of the 2019 Conference
 on Empirical Methods in Natural Language Processing and the 9th International Joint Conference on Natural Language
 Processing, EMNLP-IJCNLP (2019), 3728–3738.
[42] Hans Peter Luhn. 1958. The automatic creation of literature abstracts. IBM Journal of research and development 2, 2
 (1958), 159–165.
[43] James MacQueen et al. 1967. Some methods for classification and analysis of multivariate observations. In Proceedings
 of the fifth Berkeley symposium on mathematical statistics and probability, Vol. 1. Oakland, CA, USA, 281–297.
[44] Sreenivasulu Madichetty and Sridevi Muthukumarasamy. 2020. Detection of situational information from Twitter
 during disaster using deep learning models. Sādhanā 45, 1 (2020), 1–13.
[45] Chirantana Mallick, Ajit Kumar Das, Madhurima Dutta, Asit Kumar Das, and Apurba Sarkar. 2019. Graph-based text
 summarization using modified TextRank. In Soft computing in data analytics. Springer, 137–146.
[46] Sandip Modha, Rishab Singla, and Chintak Soni. 2017. Summarizing disaster related event from microblog. SMERP@
 ECIR (2017), 109–115.
[47] Matthias Moi, Nikolai Rodehutskors, and Rainer Koch. 2016. An ontology for the use of quality evaluated social media
 data in emergencies. IADIS International Journal on WWW/Internet 14, 2 (2016), 38–57.
[48] RP Narmadha and GG Sreeja. 2016. A survey on online tweet segmentation for linguistic features. In 2016 International
 Conference on Computer Communication and Informatics (ICCCI). IEEE, 1–6.
[49] Hieu V Nguyen and Li Bai. 2010. Cosine similarity metric learning for face verification. In Asian conference on computer
 vision. Springer, 709–720.
[50] Minh-Tien Nguyen, Asanobu Kitamoto, and Tri-Thanh Nguyen. 2015. Tsum4act: a framework for retrieving and
 summarizing actionable tweets during a disaster for reaction. In Pacific-Asia Conference on Knowledge Discovery and
 Data Mining. Springer, 64–75.
[51] Alexandra Olteanu, Sarah Vieweg, and Carlos Castillo. 2015. What to expect when the unexpected happens: Social
 media communications across crises. In Proceedings of the 18th ACM conference on computer supported cooperative
 work & social computing. ACM, New York, NY, USA, 994–1009.
[52] Lawrence Page, Sergey Brin, Rajeev Motwani, and Terry Winograd. 1999. The PageRank citation ranking: Bringing
 order to the web. Technical Report. Stanford InfoLab.
[53] Rrubaa Panchendrarajan, Wynne Hsu, and Mong Li Lee. 2021. Emotion-Aware Event Summarization in Microblogs.
 In Companion Proceedings of the Web Conference 2021. ACM, New York, NY, USA, 486–494.
You can also read


