OUR CAPITALS 82 98 Manufactured Capital 103 112 Human Capital 130 Social & Relationships Capital 143 Natural Capital 152 Trade-offs in our ...
←
→
Page content transcription
If your browser does not render page correctly, please read the page content below
Our
Capitals
82    Financial Capital
98    Manufactured Capital
103   Intellectual Capital
112   Human Capital
130   Social & Relationships Capital
143   Natural Capital
152   Trade-offs in our Capitals

                                       ANNUAL REPORT 2021   81
SECTION 05: OUR CAPITALS

Financial Capital

Financial Capital is a critical input in executing business activities,
supporting our other Capitals and ensuring Yinson’s long-term
business viability. Our overarching strategy for managing our
Financial Capital guides the management of our financial inputs and
outputs towards achieving long-term, sustainable cash flows.

                                    YINSON’S STRATEGY FOR MANAGING
                                           FINANCIAL CAPITAL

                                Prioritise long-term           Velocitise and realise
                               business sustainability         project value through
                                                            strong teamwork and cross   OUTPUTS
                                                                border integration      (KEY FINANCIAL
 INPUTS
                                                                                        METRICS)
 • Equity shareholders
                                                                                        • Revenue
 • Financing and
                                                                                        • Reported and core
   funding partners
                                 Build strong local            Enlarge territory and      profitability
 • Cash held
                                  knowledge and                  increase impact        • PATAMI
 • Cash flow from
                                    experience                                          • Equity shareholder
   operating activities
                                                                                          performance
        pg 86 - 88
                                                                                        • Capital appreciation

                                                                                              pg 88 - 97
                               Build long-term partnerships with corporate business
                                          partners, lenders and investors

                                       Supported by strong governance on
                                        Tax, Treasury and Finance matters
                                  Corporate tax governance, pg 108;
                                  Tax, treasury and finance, pg 110

                                  LONG-TERM, sustainable CASH FLOWS

82    Yinson Holdings Berhad
Financial Capital

STRATEGY                   PROGRESS IN FYE 2021                                      FOCUS FOR FYE 2022

Prioritise long-term       • Secured RM200 million sustainability-linked financing   • Meet targets to become eligible for
business sustainability      (“SLF”) from HSBC Amanah Malaysia.                        improved pricing from the HSBC
                           • Embarked on corporate credit rating exercise.             Amanah Malaysia SLF.
                           • Achieved recognition for strong financial governance    • Complete corporate credit rating
                             practices.                                                exercise.
                           • Updated and enhanced Group Investment Policies
                             for Offshore Production, Renewables and Corporate
                             Treasury.

Velocitise and realise     • Completed the refinancing of USD800 million project     • Secure project financing for FPSO
project value through        finance of FPSO JAK.                                      Anna Nery and Nokh Project.
strong teamwork            • Secured USD400 million bridge financing for FPSO        • Continue developing and delivering
and cross border             Anna Nery project.                                        velocitisation initiatives to improve
integration                • Corporate team deployed to London to strengthen           project returns and recycle capital
                             Renewables team.                                          into new projects.
                           • Provided corporate support for winning Nokh Project.

Bankers and lenders,
pg 131

Build strong local         • Strengthened awareness and compliance with local tax    • Continue strengthening local
knowledge and                laws.                                                     knowledge and experience.
experience                 • Utilised new Learning Management System ("LMS") to      • Continue strengthening local
                             improve local knowledge and competencies.                 governance.

Corporate tax
governance, pg 108;
Local workforce, pg 122;
Learn@Yinson, pg 123

Enlarge territory and      • Expanded Global Corporate Advisory Office into the      • Continue providing corporate
increase impact              Netherlands and Brazil.                                   support for expansion into new
                           • Provided corporate support and advice for successful      business areas and territories.
                             acquisition and integration for RSE, India.
Renewables, pg 101
                           • Achieved recognition for innovative financing deals.

Build long-term            • Concluded agreement for Sumitomo to participate in      • Continue building long-term
partnerships with            the FPSO Anna Nery project with Sumitomo taking a         partnerships with corporate business
corporate business           25% stake.                                                partners, lenders and investors.
partners, lenders and      • Concluded agreement with “K” Line for their             • Continue expanding network of
investors                    participation in the FPSO Anna Nery project with          bankers and lenders.
                             around a 10% stake upon final acceptance and
                             achievement of stable operations.
                           • Expanded network of banking partners as evident in
Investors and
shareholders, pg 135;        FPSO JAK refinancing exercise and FPSO Anna Nery
Bankers and lenders;         bridge loan.
pg 131; Partners, pg 141   • Carried out Investor Relations Survey.

                                                                                                  ANNUAL REPORT 2021         83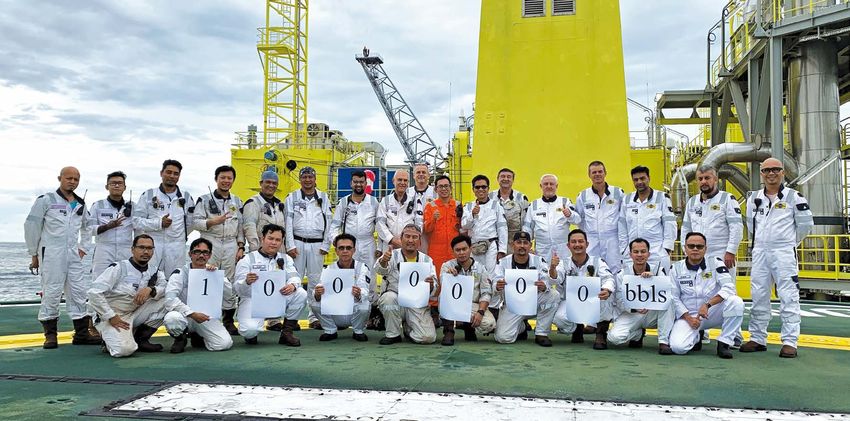
SECTION 05: OUR CAPITALS

Financial Capital

     AWARDS RECEIVED IN FYE 2021 IN
                                                                          GROUP INVESTMENT
     ACKNOWLEDGEMENT OF YINSON’S
                                                                          POLICIES
     MANAGEMENT OF FINANCIAL CAPITAL

     • FinanceAsia’s 2020 Asia’s Best Companies Survey –                  Yinson's Group Investment Policies were updated in FYE
       Malaysia’s Best Mid-Caps Company                                   2021 and adopts a new internal framework to determine
                                                                          the target minimum returns on investments. Under the
     • Asiamoney Asia’s Most Outstanding Companies
                                                                          framework, returns are correlated to a project’s risk
       Poll 2020 – Most Outstanding Company in Malaysia                   factors such as counterparty, contractual legal terms,
       (Energy Sector)                                                    technical requirements, operational requirements,
     • Institutional Investor’s 2020 All-Asia Executive Team              political environment, tax, ESG, project partners involved
       Rankings – Most Honoured Company                                   and strategic considerations. Additionally, any project-
                                                                          specific risk factors are also discussed by Yinson’s
     • Institutional Investor’s 2020 All-Asia Executive Team              Management Committee when making investment
       Rankings – Best CEO (Oil & Gas sector)                             decisions. The updated framework allows a balance to
     • Asset Triple A Awards 2020 – Best Syndicated Loan                  be achieved between the commercial expectations from
                                                                          an investment and Yinson’s strategic goal of achieving
       in Malaysia, in recognition of the USD400 million
                                                                          sustainable growth.
       bridge loan facility for the FPSO Anna Nery project
     • 2019 ASEAN Corporate Governance Scorecard                          Separate policies were adopted for the Offshore
       Award                                                              Production and Renewables business divisions to take
                                                                          into account that the value chain for these businesses
     • The Edge Billion Ringgit Club 2020 – ‘Highest                      differ significantly. Additionally, an investment policy
       Returns on Equity over Three Years’                                for Corporate Treasury was created, setting out the
     • The Edge Billion Ringgit Club 2020 – ‘Highest                      parameters for the management of Yinson’s free cash,
       Growth in Profit After Tax Over Three Years’                       with the objective of capital preservation and liquidity.
                                                                          The Board and management will continually review the
                                                                          policies to keep up to date with best practices.

     Capital
     strategy

                               PROJECT                                                         PLATFORM
                                                            REFINANCING
                                LEVEL                                                            LEVEL

                     Equity sell-down at project        Optimise project capital
                     level to accelerate project       structure and extend debt         Re-leverage order book backlog
                     equity cashflows and boost      maturity of stabilised brownfield         to velocitise capital
                            project returns            assets to enhance returns

     Yinson adopts the above tactical strategies to enhance returns of our investments and accelerate the return of our Financial
     Capital to be deployed into new projects. Through the deployment of these capital strategies, Yinson was able to grow our
     business and fund the capital requirements of the last three FPSO projects without any further fundraising from the equity
     market since 2015, while continuing to provide our shareholders a stable dividend return.

84       Yinson Holdings Berhad
Financial Capital

HISTORICAL UPSTREAMING OF YINSON'S ASSETS

                         Cash generated from Yinson's assets
                                   (2015 to present)
                        Divestment/ sale     Capital                       Yinson's portion   Equity required for new projects
    Dividends           of assets            Reduction                     of free cash               (2018 to present)
    USD182              USD230                   USD109                    USD108
    million             million                  million                   million            Total: USD445 million
                            Total: USD629 million
Strength of relationships with our financing and funding partner group

The uncertainty in the global markets along with movement control orders imposed in many countries due to the Covid-19
situation resulted in delays, or even the cancellation of many business transactions globally.

Despite these challenges, Yinson successfully closed two significant financing transactions in FYE 2021, namely the completion
of the USD800 million refinancing exercise for FPSO JAK in April 2020, and the signing and completion of the USD400 million
bridge loan financing agreement for FPSO Anna Nery in September 2020.

Both transactions received strong support from our financing partners, which is a testament of our lenders’ confidence in
Yinson despite the challenging business conditions in the midst of a pandemic and the decline in oil price.

For FPSO JAK refinancing transaction, in addition to our existing financing partners, CIMB Bank Berhad, Maybank Investment
Bank Berhad, Natixis, Overseas-Chinese Banking Corporation Limited, Standard Chartered Bank (Singapore) Limited and
United Overseas Bank Limited, we also welcomed the following new financing partners:

•     Credit Industriel et Commercial
•     Clifford Capital Pte Ltd
•     DBS Bank Ltd
•     MUFG Bank Ltd
•     Societe Generale
•     The Korea Development Bank
•     Sumitomo Mitsui Banking Corporation

Furthermore, the FPSO Anna Nery financing transaction was oversubscribed by the participating banks which includes Export-
Import Bank of Malaysia Berhad, Maybank International Labuan Branch, Mizuho Bank Ltd, Natixis, Standard Chartered Bank
(Singapore) Limited, Sumitomo Mitsui Banking Corporation and The Hongkong and Shanghai Banking Corporation Limited.

USD800 million refinancing of FPSO JAK signing ceremony

USD400 million bridge loan financing for FPSO Anna Nery virtual ceremony

                                                                                                      ANNUAL REPORT 2021         85
SECTION 05: OUR CAPITALS

Financial Capital

INPUTS
                                                                     EQUITY AND PERPETUAL SECURITIES
Equity shareholders

Yinson’s shares are listed on the Main Market of Bursa                        Perpetual Securities (NC5)
Malaysia Securities Berhad (KLSE:YINSON).                                     USD90 million
                                                                     2019     Perpetual Securities (NC5)
Yinson’s top three shareholders own 52.9% of stock, while                     USD30 million
other public shareholders make up the remaining 47.1%.
Our founder serves as Yinson’s Group Executive Chairman,                      Sukuk Mudharabah (NC15)
                                                                     2018
while both the EPF's Chief Investment Officer and KWAP's                      RM950 million
Chairman of the Investment Panel currently sit on Yinson’s
Board. The founding Lim family has subscribed to all rights
issues raised. In 2015, EPF fully subscribed to Yinson’s private              Perpetual Securities (NC5)
                                                                     2017
placement of RM169.8 million.                                                 USD100 million

                                                                              Perpetual Securities (Private Placement) (NC5)
       Yinson’s Shareholdings By Category                            2015
                                                                              USD100 million

                                                    Lim family
                                                       27.5%       On top of these, we have also successfully raised corporate
  Public                                                           borrowings. In FYE 2021, we successfully raised USD139
  shareholders                                                     million of term loans from our relationship banks, made
  47.1%                                                            possible through our careful cultivation of the relationships
                                                         EPF       over the years via open and honest communication, which
                                                       15.6%       has allowed the banks to better understand our business and
                                                                   appreciate its robustness. Corporate facilities enable us to be
                                                        KWAP
                                                                   flexible when providing funding for our equity requirements,
                                                         9.8%
                                                                   which in turn allow us to pursue business opportunities in a
                                                                   timely manner. We have also successfully raised RM200 million
       (According to the Company’s Register of Substantial         SLF from HSBC Amanah Malaysia, as we continue to make
                Shareholders as at 6 May 2021.)                    progress in the areas of ESG.

                                                                   Project level

Financing and funding partners                                     Over the years, we have built relationships with a network
                                                                   of banks active in FPSO financing. Despite the challenging
We optimise our capital structure by tapping the                   financing environment in FYE 2021, we successfully raised a
financial markets and through resourceful deployment               USD400 million bridge loan for FPSO Anna Nery, as well as
of our internally-generated funds to finance our capital           the USD800 million refinancing for FPSO JAK.
requirements. Since our fundraising exercise with the Group’s
ordinary shareholders in 2015, we have successfully delivered      To navigate the challenging oil & gas financing landscape,
FPSO JAK, FPSO Helang and FPSO Abigail-Joseph, and                 we constantly innovate and explore other modes of financing
are well on track towards the delivery of FPSO Anna Nery in        such as project level preference shares, non-recourse project
2023.                                                              equity or junior loans for our offshore production projects,
                                                                   which may open up fresh pockets of funding liquidity from
Platform level                                                     different pools of financiers including infrastructure or credit
                                                                   funds.
We include perpetual securities and sukuk mudharabah as
part of Yinson's long-term equity structure. These instruments     The appetite for renewables-based projects has grown in
are classified as equity yet do not dilute our existing            the current financing market as we accelerate the transition
shareholders. Yinson has successfully expanded its capital         into cleaner sources of energy. We are actively seeking the
structure with five issuances since its inaugural exercise in      best financing solutions on top of the usual project financing
2015.                                                              with our international banking network. For instance, local
                                                                   currency financing in India could be an attractive solution as
                                                                   it offers a natural hedge and longer tenure financing for our
                                                                   Indian assets, potentially unlocking a new pocket of liquidity
                                                                   for current and future projects.

86     Yinson Holdings Berhad
Financial Capital

As an alternative to project financing, green bonds are also an increasingly attractive source of funding due to the growing
liquidity resulting from increased appetite from ESG-focused investors. Infrastructure funds are also potential partnership
candidates for our renewables-based projects, which we believe will help to accelerate our growth in the industry, thereby
enhancing shareholder returns.

The capital requirements of the Green Technologies Division are expected to be relatively small over the next few years as
we identify the right opportunities to commercialise and scale. Coupled with the dynamic nature of this business, we believe
funding the business with our internally-generated funds is the best strategy until the business reaches critical mass.

Cash and cash equivalents

  Cash and liquid investments (RM MILLION)                        Free and available cash (RM MILLION)

  FYE 2021                                           2,050        FYE 2021                                            1,329

  FYE 2020                            1,465                       FYE 2020                            886

  FYE 2019                       1,290                            FYE 2019                     724

  FYE 2018         717                                            FYE 2018     291

  FYE 2017       661                                              FYE 2017              505

Yinson’s free and available cash position of RM1,329 million provides flexibility for expansion and adequate buffer to meet
any unforeseen cash requirements. Free and available cash is derived through cash flows from operations, raising of financial
capital and drawdown of loans and borrowings pending deployment for projects. Free and available cash is mainly held in
time deposits and interest-bearing accounts, and is managed with a goal of capital preservation and liquidity so that funds are
available at the required time buckets based on cash flow projections. Our strategy for managing liquidity includes:

• Maintaining an appropriate mix of high-quality liquid investments and adequate cash buffers to meet unexpected cash outflows.
• Maintaining 5-year cash flow projections to match the allocation of long-term financial capital with project capital
  expenditure needs.
• Using reasonable assumptions on continuing operations and financing of projects secured, Yinson’s liquidity is sufficient for
  at least the next 5 years.
• Conducting regular stress testing to assess cash flow vulnerability under stressed situations and deploying the necessary
  action plans.

Cash flows from operating activities

  EPCIC                                                           Non-EPCIC and Others
  (RM MILLION)                                                    (RM MILLION)

  FYE 2021     (1,373)                                            FYE 2021                                                 598

  FYE 2020                                            473         FYE 2020                                     445

  FYE 2019                                           152          FYE 2019                                           495

                                                                  FYE 2018                                           497

                                                                  FYE 2017           (54)

                                                                                                     ANNUAL REPORT 2021          87
SECTION 05: OUR CAPITALS

Financial Capital

  Net cash flows (used in)/ generated from operating activities
  (RM MILLION)

  FYE 2021     (775)

  FYE 2020                                                                                                            918

  FYE 2019                                                                                        647

  FYE 2018                                                                              497

  FYE 2017                                             (54)

The Group’s business model of earning stable recurring income from asset leasing contracts is evidenced by the steady
growth of our Non-EPCIC activities’ cash flows from operations over the past years. In FYE 2021, the Group’s overall deficit
in operating activities cash flow position originated from the timing mismatch of recognised revenue from EPCIC activities
performed for FPSO Abigail-Joseph and FPSO Anna Nery and the associated cash inflows that will only be received by the
Group throughout the lease period. FPSO Abigail-Joseph commenced its lease on 28 October 2020, while FPSO Anna Nery
is expected to commence its lease in Q1 2023. Excluding the cash flow effect of EPCIC activities, the net cash flows generated
from operating activities in FYE 2021 would have been RM598 million.

During the financial year, cash flows generated from financing activities primarily through drawdown of loans and borrowings
were deployed towards funding the project execution and investing activities of the Group as presented in the Statements of
Cash Flows from pages 195 to 199.

OUTPUTS (KEY FINANCIAL METRICS)

Revenue

  EPCIC                                                          Non-EPCIC
  (RM MILLION)                                                   (RM MILLION)

  FYE 2021                                        3,394          FYE 2021                                          1,408

  FYE 2020                   1,551                               FYE 2020                            917

                                                                 FYE 2019                               991

                                                                 FYE 2018                           880

                                                                 FYE 2017               500
  Group revenue
  (RM MILLION)

  FYE 2021                                                                                                         4,849

  FYE 2020                                                     2,519

  FYE 2019                     1,035

  FYE 2018                     910

  FYE 2017             543

88     Yinson Holdings Berhad
Financial Capital

To enhance understanding of the Group’s financial performance, we disclose the contribution of EPCIC activities to the Group.
Since the prior financial year, the Group’s awarded lease contracts were systematically classified under International Financial
Reporting Standards (“IFRS”) as finance leases for accounting purposes. EPCIC recognition applies to projects which are of
finance lease in nature, where revenue is recognised either over time based on the progress of construction or at a point in
time when the asset’s rights of use are handed over to a lease client.

This accounting treatment accelerates recognition of lease revenues and profits into the construction phase of the asset,
whereas the asset generates the cash only after construction and commissioning activities have been completed, as that is the
point in time the Group is entitled to start receiving the lease payments. In the case of an operating lease, lease revenues and
profits are recognised during the lease period, effectively more closely tracking cash receipts.

The lease classification and timing of EPCIC revenue recognition (where relevant) for the Group’s FPSOs and FSOs are set out
below.

                                                                  Lease                    EPCIC                     Timing of EPCIC
Project                                                       classification            recognition*                   recognition*

Owned by the Group

FPSO Adoon                                                  Operating lease                   No

FPSO JAK                                                    Operating lease                   No

FPSO Helang                                                   Finance lease                   Yes            Point in time (Q4 FYE 2020)

FPSO Abigail-Joseph                                           Finance lease                   Yes            Point in time (Q3 FYE 2021)

FPSO Anna Nery                                                Finance lease                   Yes                       Over time

Owned through joint venture arrangements

FPSO PTSC Lam Son                                           Operating lease                   No

FSO PTSC Bien Dong 01                                       Operating lease                   No

* Refer to the Group’s accounting policy for EPCIC revenue recognition in Note 2.7(i) to the Financial Statements.

In FYE 2021, the Group experienced significant revenue growth with FPSO Helang completing its first full year of lease charter
(“Non-EPCIC operation activities”), FPSO Abigail-Joseph giving rise to the recognition of a one-off outright sales upon achieving
first oil in October 2020 and FPSO Anna Nery progressively completing its engineering and construction works (“EPCIC operation
activities”). Collectively, these contributed to a reported revenue of RM4,849 million in FYE 2021 – 92% higher than in FYE 2020.

The revenue contributions from the Group’s joint venture arrangements in Vietnam and Ghana are presented separately as
adjusted revenue, and accounted for in accordance with the Group’s equity ownership.

REVENUE (EPCIC)

FPSO Abigail-Joseph and FPSO Anna Nery are the two EPCIC projects undertaken by the Group in FYE 2021. FPSO Abigail-Joseph
was successfully completed and commenced its lease charter on 28 October 2020 with a one-off non-recurring revenue contribution
of RM1,095 million upon handover of the rights of use to the charterer. Meanwhile, the ongoing FPSO Anna Nery project contains an
EPCIC component where such revenue is recognised over time, based on the progress of construction until Q1 2023.

REVENUE (NON-EPCIC)

The Non-EPCIC component represents the Group’s FPSO/ FSO operating activities. The Group has five operating FPSOs and
one operating FSO on charter lease as at FYE 2021. FYE 2021 witnessed fresh revenue contribution from FPSO Abigail-Joseph
since 28 October 2020 and full year’s revenue contribution from FPSO Helang, propelling non-EPCIC revenue beyond the
RM1 billion mark to RM1,408 million.

                                                                                                               ANNUAL REPORT 2021      89
SECTION 05: OUR CAPITALS

Financial Capital

Profitability

Reported and Core PAT (RM MILLION)

                                                      Reported PAT                 : RM412 million
                              FYE 2021
                       Total Non-Core Items           Total Non-Core Items : (RM323) million

                                                      Core PAT                     : RM735 million
         19                                   (10)
                                                      (104) ¢ Contract acquisition costs written off
        (26)                                           (84) ¢ Deal deposit and bad debts written off
           3                                  (104)       2 ¢ Fair value gain on marketable securities
           5                                            (3) ¢ Fair value loss on investment properties
                                                          3 ¢ Gain on remeasurement on step-up
                                                              acquisition of RSE
        (24)
                                                       (33) ¢ Impairment loss on property, plant and
                                                              equipment
                                FYE 2021               (12) ¢ Impairment loss on tax recoverable
        (44)                                            (2) ¢ Loss on disposal of other investments
                                                       (13) ¢ Net loss on foreign exchange
                                                       (44) ¢ One-off charge-out of transaction costs
                                                              related to refinancing of loan
        (13)                                  (84)     (24) ¢ Other operating expenses
                                                          5 ¢ Reversal of impairment loss on receivables
          (2)                                             3 ¢ Reversal of impairment loss related to joint
                                                              ventures
        (12)
                                                       (26) ¢ Share of joint venture's impairment loss on
        (33)                                  2               property, plant and equipment
                                              (3)       19 ¢ Variation compensation income (net of
                                              3              related costs)
                                                       (10) ¢ Warranty costs provided for a project

                                                      Reported PAT                 : RM261 million
                              FYE 2020
                       Total Non-Core Items           Total Non-Core Items : (RM32) million

                                                      Core PAT                     : RM293 million
                                              (1)
         (1)
                                                        (1) ¢ Fair value loss on derivatives
                                              (2)
                                                        (2) ¢ Fair value loss on investment properties
                                                        (5) ¢ Impairment loss on property, plant and
                                                              equipment
                                              (5)
                                                        (1) ¢ Impairment loss on receivables
                                                        (2) ¢ Impairment loss on tax recoverable
        (10)                                            (1) ¢ Loss on disposal of other investments
                                                        (1) ¢ Loss on disposal of property, plant and
                                                              equipment
                                FYE 2020
                                              (1)       (8) ¢ One-off sharing of joint venture's shortfall in
                                                              insurance claims
                                              (2)      (10) ¢ Warranty cost provided for a project
                                                        (1) ¢ Others
                                              (1)
         (8)
                                              (1)

90     Yinson Holdings Berhad
Financial Capital
PAT AND EBITDA (GROUP) (RM MILLION)
Reported PAT Core PAT
FYE 2021 412 FYE 2021 735
FYE 2020 261 FYE 2020 293
FYE 2019 264 FYE 2019 296
FYE 2018 292 FYE 2018 346
FYE 2017 194 FYE 2017 229
Reported EBITDA Core EBITDA
FYE 2021 1,236 FYE 2021 1,491
FYE 2020 770 FYE 2020 793
FYE 2019 801 FYE 2019 832
FYE 2018 650 FYE 2018 695
FYE 2017 273 FYE 2017 316
Adjusted Core EBITDA
FYE 2021 1,533
FYE 2020 865
FYE 2019 897
FYE 2018 823
FYE 2017 533
The Group’s profitability benchmark indicators continued to grow in FYE 2021 despite businesses globally being severely
affected by the Covid-19 pandemic. The Group’s EBITDA was RM1,236 million and PAT was RM412 million, which is 61% and
58% higher than the previous financial year respectively. In addition, the Management uses profitability benchmark indicators
of Core EBITDA and Core PAT to measure operational performance, where non-core financial elements are excluded in its
calculation. These two indicators are 88% and 151% higher at RM1,491 million and RM735 million respectively. Notably
among the non-core financial elements are RM84 million relating to a deal deposit written off upon the lapse of the Ezion
acquisition proposal, RM33 million of impairment loss for certain offshore support vessels ("OSV") and a Very Large Crude
Carrier ("VLCC") of the Group and RM104 million of contract acquisition costs written off for various projects which the Group
participated in.
ANNUAL REPORT 2021 91SECTION 05: OUR CAPITALS Financial Capital PAT AND EBITDA (EPCIC) (RM MILLION) Reported PAT Core PAT FYE 2021 302 FYE 2021 310 FYE 2020 7 FYE 2020 7 Reported EBITDA Core EBITDA FYE 2021 468 FYE 2021 476 FYE 2020 7 FYE 2020 7 EPCIC business activities contributed significantly with an increase of RM295 million to record a PAT of RM302 million. FPSO Abigail-Joseph delivered a one-off PAT of RM105 million and FPSO Anna Nery contributed RM197 million through progression of its construction work. PAT AND EBITDA (NON-EPCIC) (RM MILLION) Reported PAT Core PAT FYE 2021 325 FYE 2021 528 FYE 2020 259 FYE 2020 283 FYE 2019 317 FYE 2019 331 FYE 2018 412 FYE 2018 399 FYE 2017 217 FYE 2017 237 Reported EBITDA Core EBITDA FYE 2021 943 FYE 2021 1,079 FYE 2020 743 FYE 2020 758 FYE 2019 821 FYE 2019 815 FYE 2018 738 FYE 2018 717 FYE 2017 268 FYE 2017 296 Non-EPCIC business activities comprise leasing of vessels and marine-related services, which are areas that the Group has extensive experience and a strong track record. FPSO Abigail-Joseph is Yinson’s newest operating asset, which officially went on charter in October 2020. In FYE 2021, EBITDA and PAT grew by 27% and 25% respectively. Besides the added contribution from FPSO Abigail-Joseph’s lease commencement, the growth is also driven by FPSO Helang completing its first full financial year of operations as well as contributions from charter arrangements of two VLCC tankers during the year. Contribution from VLCC tankers in the coming financial year will be lower as the Group has resolved to retain only one VLCC tanker for prospective projects in our pipeline. 92 Yinson Holdings Berhad
Financial Capital

  PATAMI

  Reported PATAMI                                                  Core PATAMI
  (RM MILLION)                                                     (RM MILLION)
  FYE 2021                                           315           FYE 2021                                               637

  FYE 2020                              210                        FYE 2020                241

  FYE 2019                                  235                    FYE 2019                  266

  FYE 2018                                         292             FYE 2018                         346

  FYE 2017                          197                            FYE 2017               232

  Basic Earnings Per Share
  (sen)
  FYE 2021                                           29.5

  FYE 2020                           19.5

  FYE 2019                                21.4

  FYE 2018                                        26.8

  FYE 2017                         18.1

It is the Group’s strategy to invite strategic partners to participate in our projects to manage our overall portfolio mix and
maximise shareholder value. Thus, shareholders should refer to Profit after Tax and Minority Interests (“PATAMI”) to determine
the amount of profit attributable to them. In FYE 2021, the Group entered into a collaboration arrangement for the FPSO Anna
Nery project with Japan Offshore Facility Investment 1 Pte Ltd (wholly owned by Sumitomo); who took a 25% equity stake
share allotment at a consideration of USD25 million.

The Group recorded higher PATAMI and Core PATAMI in FYE 2021 of RM315 million and RM637 million respectively due
to factors disclosed in the previous profitability section. The Group’s Basic Earnings Per Share (“EPS”), computed based on
PATAMI, reflected similar trends.

  Leverage indicators

  Gearing ratio                                                    Net Gearing ratio
  (times)                                                          (times)
  FYE 2021                                           1.52          FYE 2021                                        1.01

  FYE 2020                            1.01                         FYE 2020                         0.63

  FYE 2019                       0.87                              FYE 2019                  0.51

  FYE 2018                                1.14                     FYE 2018                                 0.87

  FYE 2017                                        1.41             FYE 2017                                               1.14

                                                                                                    ANNUAL REPORT 2021           93
SECTION 05: OUR CAPITALS
Financial Capital
Adjusted Net Debt Adjusted Net Debt /
(RM million) Adjusted Core EBITDA (times)
FYE 2021 4,102 FYE 2021 2.68
FYE 2020 2,475 FYE 2020 2.86
FYE 2019 1,854 FYE 2019 2.07
FYE 2018 2,242 FYE 2018 2.73
FYE 2017 3,136 FYE 2017 5.89
Gearing Ratios (times) Net Gearing Ratios (times)
1.52 1.01
FYE 2021 FYE 2021
0.78 0.27
1.01 0.63
FYE 2020 FYE 2020
0.40 0.01
0.87 0.51
FYE 2019 FYE 2019
0.16 (0.19)
Based on total borrowings Based on total borrowings
Based on total borrowings excluding Based on total borrowings excluding
non-recourse borrowings non-recourse borrowings
The Group applies Net Gearing Ratio (calculated as ‘Total Loans and Borrowings’ less ‘Cash and Bank Balances plus liquid
investments’ divided by ‘Total Equity’) as a key indicator to manage its operation funding structure. This ratio increased to 1.01
times in FYE 2021 in tandem with the progressive execution of the FPSO Anna Nery project and upsized refinancing exercise
of FPSO JAK. This ratio will continue trending upwards until the beginning of 2023, when FPSO Anna Nery is expected to
commence its 25-year lease tenure.
Although Net Gearing Ratio has increased, debt levels remain manageable. As at 31 January 2021, RM3,919 million of loans
and borrowings are project financing loans for FPSO JAK and FPSO Helang, which are structured to ensure smooth repayment
over the course of the firm charter period. Project financing loans are non-recourse to Yinson once operational with Yinson's
guarantee being released from the project financing loan, which minimises the risk of these loans to Yinson’s liquidity. The
project financing lenders are only entitled to repayment from cash flows of the projects the loan is financing, and not from any
other assets of Yinson. As at the issuance date of this Report, the project financing loans for FPSO JAK and FPSO Helang are
non-recourse, where the project financing loan for FPSO Helang became non-recourse on 3 February 2021. Had the project
financing loan for FPSO Helang become non-recourse on 31 January 2021, the Group's Gearing ratio and Net Gearing ratio
would have been 0.54 times and 0.03 times respectively.
94 Yinson Holdings BerhadFinancial Capital
In assessing the Group’s ability to repay its loans and borrowings, the Management refers to the Adjusted Net Debt/ Adjusted
Core EBITDA ratio. This ratio indicates the number of years’ profits that is needed to cover outstanding loans and borrowings.
Management expects next year’s ratio to be higher than 2.68 times as recorded on 31 January 2021, as the FPSO Anna Nery
project nears completion.
As the Group continues to grow, we will continuously assess and determine the appropriate financing strategy for the Group to
ensure an optimal mix of funding of debt and equity markets to support future projects.
Equity shareholder performance
5-YEAR PERFORMANCE
Yinson's share price vs FBM KLCI Index
RM5.20
1566.40
2016 2017 2018 2019 2020 2021
Yinson (KLSE-YINSON) FBM KLCI Index
Source: Investing.com (2021)
• The market continues to rebound given the improving macro-economic fundamentals, ample liquidity and bullish sentiment
in most sectors after the setback from last year due to the Covid-19 pandemic, tracking positive performance on the
benchmark of FBM KLCI with an upward trend.
• With Yinson’s high earning visibility, diversified portfolio and sustainable business model, we remain resilient to the slump in
the equity market, which tumbled to its lowest in March 2020, and are well-positioned to steer on the oil market volatility.
• In tandem with this, Yinson’s capability in delivering long-term growth for our investors is evident, with our share price
appreciating by 1.95 times since FYE 2016, from the share price of RM2.67 as at 2 February 2016 to RM5.20 as at 29
January 2021.
• In comparison, the FBM KLCI’s performance remained flat with a minor decrease from 1653.18 to 1566.40 over the same
period.
ANNUAL REPORT 2021 95SECTION 05: OUR CAPITALS
Financial Capital
SHAREHOLDER RETURNS SINCE 2011 (RM MILLION) 193 Special dividends were paid out
subsequent to major divestment or
monetisation of assets by the Group
146
109
96 93
22
13 16
2 5 5
FYE 2011 FYE 2012 FYE 2013 FYE 2014 FYE 2015 FYE 2016 FYE 2017 FYE 2018 FYE 2019 FYE 2020 FYE 2021
Interim Dividend Special Dividend Final Dividend Share Buy Back
Source: Bloomberg
Since venturing into Offshore Production in 2011, Yinson has maintained a steady return to our shareholders through various
transformation phases, despite periods of economic volatility.
Since FYE 2011 to FYE 2021 Yinson's returns to shareholders are as follows:
• RM700 million of shareholder returns in total.
• 54.85 sen per share or RM525 million in dividends on a cumulative basis. Of this amount, 18.6 sen per share, or RM203
million relate to special dividends paid out subsequent to major divestment or monetisation by the Group.
• RM175 milllion in share buy backs.
Capital appreciation
YINSON’S SHARE PRICE AGAINST BRENT CRUDE PRICE
200
150
100
50
0
1-Feb-20 1-May-20 1-Aug-20 1-Nov-20 1-Feb-21
Yinson (KLSE-YINSON) Brent crude
Source: Investing.com (2021)
96 Yinson Holdings BerhadFinancial Capital
• Yinson’s share price was resilient despite the sharp drop in the Brent crude oil price caused by the Covid-19 pandemic and
political instability. The share price resilience was backed by strong fundamentals and long-term contracts secured by the
Group.
• As oil demand increased, the crude oil price rebounded to approximately USD60 per barrel.
• Resurgence and stabilisation of oil price had some positive effect on Yinson which should translate to more FPSO activities.
YINSON’S SHARE PRICE AGAINST THE KLSE ENERGY INDEX
200
150
100
50
0
1-Feb-20 1-May-20 1-Aug-20 1-Nov-20 1-Feb-21
Yinson (KLSE-YINSON) KLSE Energy Index
Source: Investing.com (2021)
• Yinson’s share price movement trended similarly to that of the Kuala Lumpur Stock Exchange ("KLSE") Energy Index during
FYE 2021.
• Increased renewable energy initiatives and oil price were reflected in the KLSE Energy Index’s uptrend from March 2020,
where other oil & gas counters followed suit.
ANNUAL REPORT 2021 97SECTION 05: OUR CAPITALS
Manufactured Capital
Yinson’s Manufactured Capital consists of our physical key assets.
Our strategy for managing our Manufactured Capital centres around
strong governance, prudent capital management, the experience
and skills of our team, and investment into digitalisation.
YINSON’S STRATEGY FOR MANAGING
MANUFACTURED CAPITAL
Yinson’s
Acquisition and
Manufactured Construction Operations Outcomes
development
Capital
Offshore • Secure quality projects in • Deliver projects • Maintain industry- • Maintain strong
Production the world's most active on time and on leading safety fleet uptime.
• 5 FPSOs and offshore production budget. and operational • Achieve
1 FSO in regions. • Create a performance targeted
operation • Establish respectable sustainable and through digital revenue and
• 1 FPSO under portfolios within the FPSO agile organisation transformation and economic
construction industry, creating a strong to manage innovation. growth.
• 1 donor vessel order book with stable, changing project
long-term cashflows. requirements.
• Actively attract and
velocitise capital.
Renewables • Grow global portfolio • Manage projects • Achieve best-in- • Exceed
• 2 operational (pipeline) of greenfield through local teams class operational contractual
solar plants development projects with support from and safety or budgeted
• 1 solar centred around selected core team. performance power sales.
plant under core markets. • Deliver projects through hands-on • Delivery of
construction • Market selection on time and on asset management. world class
• Multiple criteria: Strong market budget. • Drive improvement renewables
sites under fundamentals and/ or • Ensure quality through assets.
development potential, ability for scale, through effective digitalisation and • Strong pipeline
good counterparties, equipment innovation. for further
quality projects, risk/ selection and growth.
reward balance including contractors/ service
diversification. providers good
• Project selection based coordination with
on resource and partner operations team.
quality, and ability to
deliver value through the
value chain.
Offshore • Participate in Asia Pacific • To ensure delivery • Implement robust • Achieve high
Marine region bids focusing of project (drydock) frameworks and fleet utilisation.
• 3 AHTS on Malaysian market to on time and on governance.
• 1 PSV support PETRONAS and budget. • Achieve optimised
Petroleum Arrangement • Maintain strong operations through
Contractors. workforce digitalisation and
• Secure quality and long- and efficient innovation.
term projects that can organisation
bring stable cashflows. to manage
challenging OSV
market.
98 Yinson Holdings BerhadManufactured Capital
OFFSHORE PRODUCTION DIVISION
Progress in FYE 2021 Focus for FYE 2022
Acquisition • Signed exclusive purchase option for FPSO Nganhurra • Secure a good redeployment project
in preparation for a new FPSO redeployment project. for FPSO Nganhurra.
• Parque das Baleias FPSO award was deferred to FYE • Secure one FPSO conversion contract.
2022, rebid is anticipated to be delivered in May 2021. • Get in position to secure one to two
Group Investment
Policies, pg 84; • Built up a solid base of project targets, including several more projects in FYE 2023.
Industry, pg 134 to be bid in FYE 2022. • Continue building a solid base of
• Participated in virtual exhibitions and marketing project targets for the years to come.
activities. • Continued marketing efforts for
Offshore Production Division.
Development • FPSO Abigail-Joseph achieved first oil on 28 October 2020. • Progress with conversion works for
• FPSO Anna Nery achieved 1 million man hours LTI-free. FPSO Anna Nery as per project
• Construction of FPSO Anna Nery progressed according schedule.
Offshore health and to project schedule. • Prepare internal infrastructure for
safety, pg 125 possible project awards.
Operations • FPSO Abigail-Joseph achieved first export on • Maintain excellent fleet uptime
12 January 2021. records for all FPSOs in operation.
• FPSO Helang achieved 1 million barrels on • Improve and maintain safety records
12 November 2020. for all FPSOs in operation.
Covid-19: Yinson's new
normal, pg 69; • FPSO Adoon achieved 9 years LTI-free. • Continually adapt to safety and
Offshore health and • Brazil and Netherlands offices operational and staffed as operations risks due to Covid-19.
safety, pg 125 per project schedule for FPSO Anna Nery project.
• Health and safety measures intensified as a response to
Covid-19 risks.
Project phase updates
Our assets under construction during FYE 2021, FPSO Abigail-Joseph and FPSO Anna Nery, were not spared from the global
supply chain disruption and movement control restrictions. Throughout the year, our crew’s health, safety and wellbeing remained
our top priority, and we worked closely with our vendors, clients and regulators to manage challenges arising from Covid-19.
FPSO Abigail-Joseph overview
Activity Date
Contract award 28 February 2019
First delivery of steel and pipe materials 9 July 2019
Vessel arrival at shipyard 28 July 2019
Completion of demolition scope 15 September 2019
Installation of metering skid and steel integration 7 October 2019
Completion of dry dock 5 December 2019
Completion of riser balcony structural work 7 December 2019
Accommodation ready for habitation 14 December 2019
Flash Gas/ HP compressors skids installation and integration 27 December 2019
Departure to field 26 February 2020
Hook-up commenced 13 August 2020
Hook-up completed 7 September 2020
Received First Oil Certificate 28 October 2020
Completion of tanks and hull coating 3 January 2021
ANNUAL REPORT 2021 99SECTION 05: OUR CAPITALS
Manufactured Capital
FPSO Anna Nery overview
Activity Date
Contract award/ Letter of Intent ("LOI") issued (effective date) 11 October 2019
Award shipyard contract 13 March 2020
Issue purchase order for long lead items 15 March 2020
Vessel arrival at shipyard 16 March 2020
Entered into definitive contract 23 March 2020
First steel cut at module fabrication yard 1 June 2020
Hazard and operability (HAZOP) study completed 27 July 2020
Completion of first drydocking 12 October 2020
Commencement of second drydocking 25 April 2021
Operations phase updates
Yinson maintained strong operations and safety performance despite the various challenges brought about by Covid-19
pandemic in FYE 2021, as outlined below:
• Achieved average technical uptime of 99.5% and average commercial uptime of 100% for the six assets that were in
operation in FYE 2021.
• Achieved average 5-year technical uptime of 99.8% for the assets that were in operation since FYE 2017.
• Significant resources were deployed to minimise Covid-19 risk on board our assets and maintain our fleet uptimes.
• Several Covid-19 cases were detected on board two of our assets and were swiftly addressed. Performance of the assets
were maintained.
Covid-19: Yinson’s new normal, pg 69
AVERAGE FLEET TECHNICAL UPTIME FOR ASSETS THAT WERE IN OPERATION IN FYE 2021
Q1 Q2 Q3 Q4 FYE 2021 average
FPSO Adoon 100% 100% 100% 100% 100%
FPSO Abigail-Joseph N/A N/A N/A 99.1% 99.1%
FPSO JAK 99.9% 100% 99.9% 100% 99.9%
FPSO Helang 99.2% 99.9% 93.5% 99.6% 98.1%
FPSO PTSC Lam Son 100% 99.9% 99.9% 100% 100%
FSO PTSC Bien Dong 01 100% 100% 100% 100% 100%
* FPSO Abigail-Joseph’s first full quarter of operations was Q4 FYE 2021.
5-YEAR AVERAGE FLEET TECHNICAL UPTIME FOR ASSETS THAT WERE IN OPERATION
Q1 Q2 Q3 Q4
FYE 2017 99.9% 99.9% 99.9% 99.9%
FYE 2018 100.0% 99.9% 99.7% 99.9%
FYE 2019 99.9% 100.0% 100.0% 99.4%
FYE 2020 100.0% 100.0% 100.0% 100.0%
FYE 2021 99.8% 99.8% 98.7% 99.8%
100 Yinson Holdings BerhadManufactured Capital
RENEWABLES DIVISION
Progress in FYE 2021 Focus for FYE 2022
Acquisition and • Acquisition of 95% of RSE, that owns the Rising Bhadla • Expand renewables presence in
development 1&2 Solar Plants in the Bhadla Solar Park, Rajasthan. existing and new regions.
• Secured contract for the construction and operation of • Drive early stage projects forward
a 190MW solar plant in the Nokh Solar Park, Rajasthan. through consenting process to
The contract was won by Yinson’s 80% owned subsidiary, achieve ready-to-build status.
RSEK through a reverse auction process. • Continue building strong pipeline of
• Established strong global pipeline of greenfield renewables projects in core markets,
renewable energy projects in new regions. with scale and value potential.
• Participate in further auctions to build
and operate assets in solar parks.
Construction • Construction of the Nokh Project kicked off and is on • Progress with development of Nokh
track for completion in Q2 2022. Project as per project schedule
• Development process started at multiple sites globally. towards completion in Q2 2022.
• Continue development in multiple
sites.
• Prepare for construction of new
ready-to-build projects.
Operations • Exceeded generation and revenue budget for operating • Maintain good performance for
solar plants. operating assets while looking for
• Kicked off integration of RSE with Yinson. improvement opportunities.
• Complete smooth integration of RSE
with Yinson.
Yinson’s renewables project pipeline spans the entire value chain from site investigation; development & consent; construction;
and owning & operating including power sales. The Renewables Division was established in late 2019 and has already
established an operating portfolio with installed capacity of 140MW, to grow to at least 330MW in FYE 2022. The size of our
pipeline, which is already 3 to 5GW, illustrates the potential for future organic growth over the medium to longer term. This
may be supplemented by further auction opportunities in India in the short to medium time frame.
RENEWABLES PROJECT PIPELINE OVERVIEW
Site Development Own & Operate
Investigation & Consent Construction Including
Power Sales
Timeline: 2 to 5 years
INDIA INDIA
ITALY ITALY
190MW solar plant 140MW Rising
Greenfield development 100MW wind and solar
under construction Bhadla 1&2
GLOBAL* INDIA
Greenfield development Other auction
and M&A opportunities
3000 – 5000MW 100MW 190+MW 140MW
* Global: Europe, Australia, New Zealand, Vietnam, Latin America
ANNUAL REPORT 2021 101SECTION 05: OUR CAPITALS
Manufactured Capital
Our operating assets at the Bhadla Solar Park were acquired during the course of FYE 2021 and were only consolidated
following completion of the second phase of the acquisition in December 2020. The operational performance since initial
acquisition is illustrated in the chart below and demonstrates strong and stable performance, with budgeted generation
exceeded over the year.
MONTHLY AND ACCUMULATED NET POWER GENERATION (GWh)
30.0 300
27.0
250
24.0
21.0
200
18.0
15.0 150
12.0
100
9.0
6.0
50
3.0
- -
Apr-20 May-20 Jun-20 Jul-20 Aug-20 Sep-20 Oct-20 Nov-20 Dec-20 Jan-21
Actual Generation P50 Forecast Accumulated Actual Generation Accumulated P50 Forecast
*100% basis, site meter.
OFFSHORE MARINE DIVISION
• Yinson’s OSVs achieved an average utilisation rate of 76.8% in FYE 2021, dropping from FYE 2020’s utilisation rate of
92.69%. The drop in utilisation was a result of lower demand due to the slowdown in offshore activities and movement
restrictions arising from the Covid-19 pandemic.
• During the low season, we organised for vessel upgrades and overhauls, and certification processes to be carried out. For
example, in Q3 FYE 2021, Yinson Hermes underwent a 19-day drydock and engine overhaul and received bollard pull
certification.
• No new assets were acquired in FYE 2021.
OFFSHORE MARINE FLEET UTILISATION
Yinson Hermes 59.2% PTSC Huong Giang 48.0%
Yinson Perwira 100.0% PTSC Lam Kinh 100.0%
102 Yinson Holdings BerhadINTELLECTUAL Capital
Yinson’s Intellectual Capital encompasses the collective knowledge
of our employees and the systems and structures that support them.
We manage our Intellectual Capital through effective management
systems, built on the specialised knowledge and experience of our
people, and a conducive corporate culture.
YINSON'S STRATEGY FOR MANAGING INTELLECTUAL CAPITAL
Continuous improvement
Board and Senior FOCUS AREAS
Management Outcomes
• Effective
Governance, Governance
pg 154 governance and
management
Provide systems
oversight to Organisational structure • Conducive
environment for
Knowledgeable, collaboration
experienced and and building
passionate employees Business systems and processes relationships
across teams and • Conducive
offices environment
for continuous
Human Capital, Company culture & communication
pg 112 improvement
Continuous improvement
PROGRESS IN FYE 2021 FOCUS FOR FYE 2022
GOVERNANCE
Corporate governance
• Implemented or updated several Group-level governance • Set up a Data Governance Policy and Management team
policies and procedures. to oversee handling of data across the Group, including
• Developed plan to implement governance training on our audit data governance regime, awareness and training.
LMS. • Implement governance training on LMS.
• Achieved recognition for strong governance. • Continuous improvements in ESG rating scores, with a
• Made progress on bridging gaps identified by ESG rating focus on higher-weightage ESG themes.
agencies. • Holistically improve ABAC practices against ISO 37001
• Internal Anti-Bribery & Anti-Corruption (“ABAC”) requirements.
procedures enhanced towards achieving ISO 37001
standards.
• ESG integrated into procurement practices. • Roll out ESG assessments to all registered suppliers.
• Enhance vendor ESG assessments.
ANNUAL REPORT 2021 103SECTION 05: OUR CAPITALS
INTELLECTUAL Capital
PROGRESS IN FYE 2021 FOCUS FOR FYE 2022
GOVERNANCE
Data protection and information security
• Data Protection Officers (“DPO”s) mobilised and trained in • Ongoing training for DPOs.
all country offices. • Maintenance of PDPA notifications and privacy notices on
• Personal Data Protection Act (“PDPA”) notifications and Yinson website.
Privacy Notices updated on Yinson website. • Complete gap analysis on country-specific data privacy
• Developed plan to perform gap analysis on country- compliance and begin implementing measures to address
specific data privacy compliance. them.
• Explored enhancements for document control system. • Strengthen corporate-level document control system.
Offshore production governance
• Kicked off Yinson Management System (“YMS”) • Maintain ISO certifications and improve compliance with
Revitalisation project. the standards.
• Maintained ISO 9001, 14001 and 45001 certifications • Execute YMS Revitalisation project, including employee
for YMS and continually improved compliance with the training and familiarisation.
standards. All audit programmes executed as planned.
• Revised all policies; and revised or developed several key
management system procedures.
• Executed Corporate Standards Revitalisation project, with
most standards revised and republished.
ORGANISATIONAL STRUCTURE
• 29 existing experts mobilised to new territories to • Continue to mobilise our talent across Yinson to support
encourage knowledge transfer and corporate culture knowledge transfer and career development.
adoption. Some transfers were delayed due to movement • Complete internal entity reorganisation exercise.
control orders in various countries.
• Internal entity reorganisation exercise largely completed.
• Appointed Group HR Director and Group Chief Financial
Officer to Senior Management.
BUSINESS SYSTEMS AND PROCESSES
Tax, Treasury and Finance
• Implemented Phase 1 of Treasury Management System. • Implement Phase 2 of Treasury Management System.
• Implement financial consolidation system, Sigma, to • Implement tax deadline monitoring dashboard and
improve reporting turnaround time. analytics.
Enterprise Resource Planning
• Enterprise Resource Planning (“ERP”) system, IFS, • Roll out barcode and offline scanner functions.
upgraded to latest version, enhanced and expanded to • Implement ERP integration platform to enable more
more sites. seamless connection with supporting systems.
• Gear up internal capacity and capability to support rapid
growth of Renewables Division into new markets and
geographical areas.
• Implement ERP system in India.
104 Yinson Holdings BerhadINTELLECTUAL Capital
PROGRESS IN FYE 2021 FOCUS FOR FYE 2022
Offshore Production
• Asset Lifecycle Management approach established in • Establish objective, data-driven decision-making
alignment with relevant strategies. processes.
• Established Working Group for Data Management for data • Develop a lifecycle roadmap for asset management
assurance and availability. practices across the organisation.
• Implemented automated monthly and quarterly operations • Implement a fully integrated mechanical completion
performance dashboards for the fleet. solution.
• Introduced 3D printing of spare parts as part of supply • Strengthen ORA governance and effectiveness.
chain optimisation. • Establish a value chain for data from source to end user.
• Optimised processes relating to spare parts registration • Continue tracking progress towards Group-wide
and controls through the asset lifecycle. environmental targets.
• Established ORA Department within Operations.
• Introduced and implemented Technical Authorities.
• Implemented EMS for full environmental impact
monitoring and control.
• Implemented and fully released new ISO 9001 qualified • Register all offshore production suppliers into new VRP
Vendor Registration Process (“VRP”) system. system.
• Complete supplier performance ratings for major
suppliers.
Information Technology
• Completed Phase 2 of Yinson’s Global Network Revamp. • Extend Group-wide IT infrastructure to cover FPSO project
• Rolled out digitalisation projects to improve workflow sites.
efficiencies across the Group. • Explore and embark on new Robotic Process Automation
• Strengthened cyber security awareness across the Group. projects and workflow approval systems.
• Completed migration from on-premise to cloud-based • Embark on using new technology to enhance IT support
communication and collaboration platform. levels.
• Completed the IT Infrastructure set up for relocation • Review, improve and enhance the cyber security
of Kuala Lumpur office and new locations in Brazil and environment.
Netherlands.
CORPORATE CULTURE AND COMMUNICATION
• Corporate culture workshops revamped to be fully virtual. • Roll out virtual corporate culture workshops across the
• Communication Handbook to provide guidance on Group.
dealing with external communications relating to Yinson • Implement Communications Handbook and brand training
developed and made available to all employees. on LMS.
• Group-wide town halls adapted to become fully virtual. • Regular pulse survey and focus group sessions with
• Pulse survey and focus group sessions held. employees.
ANNUAL REPORT 2021 105SECTION 05: OUR CAPITALS
INTELLECTUAL Capital
GOVERNANCE
Corporate governance Intellectual property Corporate governance policies
recognitions received in FYE 2021 and procedures established or
In FYE 2022, we aim to strengthen updated in FYE 2021
• Received 2019 ASEAN Corporate the management of intellectual
Governance Scorecard Award. property (“IP”) at Yinson through • Sanction Policy
• Maintained a constituent of the the implementation of a Global • Information Security Policy &
FTSE4Good Index Series. Initiative for IP. The initiative will Procedure
• Inclusion in Bursa Malaysia’s include: • Data Privacy & Procedure
Green Lane Policy. • Training and awareness • Hedging Policy & Procedure
• Placed amongst top 26-50% of programmes for employees to • Investment (Renewables) Policy &
Malaysian public listed companies identify and understand IP. Procedure
in FTSE Russell’s ESG Rating • Securing of IP, including • Investment (Offshore Production)
system. trademarks, copyrights, designs Policy & Procedure
• Placed amongst top 30% of and patents. • Stakeholder Communication
Sustainalytics ESG Risk Ratings • Development of IP Management Policy & Procedure
Energy Services industry group. Plan and Strategy. • Corporate Disclosure Policy &
Procedure
Governance training and ESG ratings
awareness
We intend to continuously improve on our ESG Ratings
The following modules will be
administered through LMS in
FYE 2022:
• Code of Conduct and Business
Ethics (“COBE”)
• ABAC
• Policy Pledging
0 0 1
Governance-related fines, Number of complaints received Number of whistleblowing
penalties or settlements involving privacy breach or case received and
imposed in FYE 2021 leaked customer information under review
Anti-Bribery & Anti-Corruption
Yinson considers corruption and bribery to be among our top risk areas. Our approach towards the matter is detailed in our
ABAC Policy, available on the Yinson website. Yinson is undertaking various initiatives towards certifying our Anti-Bribery
Management System (ABMS) to ISO 37001 standards, including implementation/ completion of the following:
• due-diligence processes that utilise screening reports.
• regular internal training and assessments that require all employees to familiarise themselves with all established principles.
• requirement for all employees to undergo annual sign-offs as written expressions of agreement to our policies, including
ABAC.
• gap analysis exercise to determine Yinson’s internal state of readiness in relation to ISO 37001 standards. A gap analysis
report was developed and serves as Yinson’s guiding document towards ISO certification.
Certification process will be initiated upon completion of enhancements.
Approach to sustainability, pg 73; Top 5 Risks, pg 170
106 Yinson Holdings BerhadYou can also read