Our "ESG" Progress Plan: Investing in Efficiency, Sustainability and Growth
←
→
Page content transcription
If your browser does not render page correctly, please read the page content below

Investor Update: April 2021

Our “ESG” Progress Plan:
Investing in Efficiency, Sustainability and Growth

             Finalist for the S&P Global     Best in the U.S. in      We Energies named
             Energy Award in Corporate        Large Customer          Most Reliable Utility
                Social Responsibility      Satisfaction (Top 2 Box)     in the Midwest
                   S&P Global Platts              JD Power                PA Consulting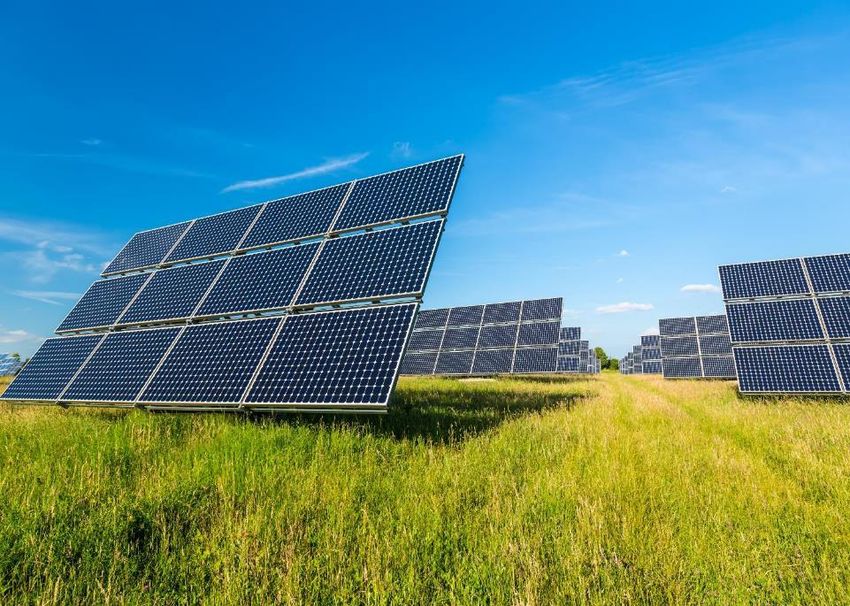
Cautionary Statement Regarding Forward-Looking Information

Much of the information contained in this presentation is forward-looking information based upon management’s current
expectations and projections that involve risks and uncertainties. Forward-looking information includes, among other things,
information concerning earnings per share, rate case activity, earnings per share growth, cash flow, sources of revenue, dividend
growth and dividend payout ratios, sales volumes, capital plans, construction costs, investment opportunities, corporate initiatives
(including the ESG Progress Plan), rate base, and environmental matters (including emission reductions). Readers are
cautioned not to place undue reliance on this forward-looking information. Forward-looking information is not a guarantee of
future performance and actual results may differ materially from those set forth in the forward-looking information.
Factors that could cause actual results to differ materially from those contemplated in any forward-looking statements include, but
are not limited to: general economic conditions, including business and competitive conditions in the company's service
territories; the extent, duration and impact of the COVID-19 pandemic or any future health pandemics; timing, resolution and
impact of rate cases and other regulatory decisions; the company’s ability to continue to successfully integrate the operations of
its subsidiaries; availability of the company’s generating facilities and/or distribution systems; unanticipated changes in fuel and
purchased power costs; key personnel changes; varying weather conditions; continued industry restructuring and consolidation;
continued advances in, and adoption of, new technologies that produce power or reduce power consumption; energy and
environmental conservation efforts; the company's ability to successfully acquire and/or dispose of assets and projects; cyber-
security threats and data security breaches; construction risks; equity and bond market fluctuations; changes in the company’s
and its subsidiaries’ ability to access the capital markets; the impact of tax reform and any other legislative and regulatory
changes, including changes to environmental standards; political developments; current and future litigation and regulatory
investigations, proceedings or inquiries; changes in accounting standards; the financial performance of American Transmission
Co. as well as projects in which the company’s energy infrastructure business invests; the ability of the company to obtain
additional generating capacity at competitive prices; goodwill and its possible impairment; and other factors described under the
heading "Factors Affecting Results, Liquidity and Capital Resources" in Management's Discussion and Analysis of Financial
Condition and Results of Operations and under the headings “Cautionary Statement Regarding Forward-Looking Information”
and "Risk Factors" contained in WEC Energy Group’s Form 10-K for the year ended December 31, 2020, and in subsequent
reports filed with the Securities and Exchange Commission. WEC Energy Group expressly disclaims any obligation to publicly
update or revise any forward-looking information.

                                                                                                                                   1
Company Profile
$29.5 billion market cap*
4.6 million retail customers
60% ownership of American
Transmission Company
$37.0 billion of assets
* As of March 31, 2021
2
A History of Quality Earnings Growth
     $4.50
                                                                                                              $3.99 - $4.03
     $4.00

     $3.50

     $3.00

     $2.50

     $2.00

     $1.50

     $1.00

     $0.50

     $0.00
                '04   '05    '06 '07     '08    '09   '10    '11   '12   '13   '14   '15   '16   '17   '18   '19   '20   '21

                   GAAP           Adjusted**          2021 Guidance
* Estimated based on 2021 guidance midpoint of $4.01 per share
** See Appendix for reconciliation of adjusted amounts to GAAP amounts

                                                                                                                               3
Consistent Performance Over Time
EPS Guidance
2020 Exceeded
2019 Exceeded
2018 Exceeded
2017 Exceeded
The only utility to beat 2016 Exceeded
guidance every year for 2015 Exceeded
17 years running 2014 Exceeded
2013 Exceeded
2012 Exceeded
2011 Exceeded
2010 Exceeded
2009 Exceeded
2008 Exceeded
2007 Exceeded
2006 Exceeded
2005 Exceeded
2004 Exceeded
4
Strong Dividend Growth Continues
                                           Annualized Dividends Per Share
                                                                                                                       $2.71**
In January, raised the                                                                                         $2.53
dividend by 7.1% to a                                                                                  $2.36
new annual rate of                                                                             $2.21
$2.71 per share                                                                        $2.08
                                                                           $1.98
                                                                  $1.83*
Targeting dividend
payout of 65-70% of
                                                          $1.56
earnings                                         $1.445

                                         $1.20
Projecting dividend
                                 $1.04
growth in line with
earnings growth          $0.80

                         2010    2011    2012     2013     2014    2015     2016       2017    2018    2019    2020 2021E
                          *Annualized based on 4th quarter 2015 dividend of $0.4575
                          **Annualized based on 1st quarter 2021 dividend of $0.6775

                                                                                                                             5
What’s New?

              6
Electric and Gas Rate Case “Stay-Out”
We Energies & Wisconsin Public Service
Filed with the Public Service Commission of Wisconsin on March 30
One year “stay-out”
Maintain current authorized return on equity:
Wisconsin Electric – 10.0%
Wisconsin Gas – 10.2%
Wisconsin Public Service – 10.0%
Maintain current capital structure equity component at all three utilities:
50.0% – 55.0%
Modify earnings sharing mechanism for 2022 only:
WE & WPS WG Treatment
10.00% – 10.15% 10.20% – 10.35% No sharing
>10.15% – 10.75% >10.35% – 10.95% 50/50 sharing
>10.75% >10.95% 100% customer
Commission review and consideration expected over the next two to three months
Will file next rate reviews no later than May 1, 2022
7
Recent Initiatives - Seeking Wisconsin Commission Approval
Investments in Regulated Renewables
Our ESG Progress Plan is building a bright, sustainable future
Paris Solar-Battery Park
Expected investment: $383M for 90% of the project (solar: $245M / batteries: $138M)
Total project: 200MW of solar generation and 110MW of battery storage
Planned in-service: 2023
Darien Solar-Battery Park
Expected investment: $401M for 90% of the project (solar: $310M / batteries: $91M)
Total project: 250MW of solar generation and 75MW of battery storage
Planned in-service: 2023
Red Barn Wind Park
Expected investment: $146M for 90% of the project
Total project: 92MW
Planned in-service: 2022
8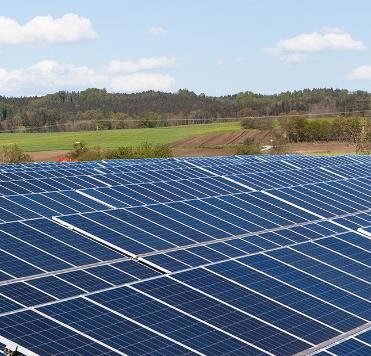
WEC Infrastructure Investment
Jayhawk Wind Farm
70 wind turbines with a
capacity of ~190MW Expected total investment: $302 million
90% ownership interest and substantially all of the
tax benefits
Under development by Apex Clean Energy and
will be co-owned and operated by Invenergy
Located in Bourbon and Crawford counties,
Kansas
Expected returns are higher than those in our
regulated business
Long-term offtake agreement with Facebook
Projected commercial operation: Late 2021
9ESG Progress
Plan
102021-2025 Capital Plan
Our ESG Progress Plan
Investing $16.1 billion for:
Efficiency
Sustainability
Growth
112021-2025 Capital Plan ($ in billions)
Investing in Efficiency, Sustainability and Growth
Growth
Sustainability
Gas distribution $1.6
$3.0
Renewables $4.1 19% Electric (G,T&D) $1.4
Grid and fleet reliability $6.3
$16.1 billion
Planned
$10.4 Investment $2.7
64% 17%
Efficiency
Technology $1.0
Grid and fleet modernization $1.7
12Robust Growth in Asset Base
7%
Growth
$32.2
billion
$22.8
billion
2020A 2025E*
*Estimated year-end average asset base
13Allocating $1.9 Billion for Regulated Renewables
Investing in Carbon-Free Generation
Build and own 1,800 MW of new solar, wind, and battery storage
Currently Under Development or In-Service
200 MW solar – WPS*
100 MW solar – We Energies
New Planned Clean Energy Additions
800 MW solar
100 MW wind
600 MW battery storage
* 100MW in-service November 2, 2020
14Reducing 100MW of Capacity
Modernizing Our Gas-Fueled Generation Fleet
Retiring
400 MW of older, less-efficient
gas generation expected
Building
100 MW of RICE generation
planned
Investing
West Riverside Energy Center
(now operational)*
200 MW - combined cycle
Reciprocating Internal Combustion
$180 million investment Engines (RICE) are modular, run on
expected natural gas and allow for reliable and
2023 – 2024 flexible operations.
* Pending due diligence and regulatory approval
15Aggressively Reducing Coal-Fueled Generation
Plant retirements have lowered costs
and reduced CO2 emissions
Retirements
Pleasant Prairie
1,190 MW Expected Future
4,935
Edgewater Retirements
MW
100 MW Oak Creek
Pulliam
3,095 Units 5-8* –
200 MW MW 1,100MW
Columbia 1,700
Presque Isle
350 MW Units 1-2* – MW
300MW
2017 2020 2023 – 2024E 2025E
* Expected retirements in 2023 - 2024
16Our ESG Progress Plan
Carbon Reduction Goals – Electric Generation
Achieved and anticipated CO2 reductions (net mass)*
Baseline Reduction goals:
-10%
-20%
-30%
Targeting
a 55%
reduction
70%
below 2005
by 2025 levels by 2030
-40%
-50%
Net carbon
-60% neutral
-70% by 2050
-80%
-90% Goals aligned with the
-100%
Paris Climate Accord
2005 2020 2030 2050
Our capital investment plan aligns with and fully supports our carbon reduction goals.
*Includes projection of potential carbon offsets by 2050
17Reducing Greenhouse Gas Emissions
Greenhouse gas intensity*
(metric tons CO2e/MWh)
0.9
0.8
0.78
0.7
0.6
0.5
0.42
0.4 0.36
0.3 0.25
0.2
0.1
0**
0
2005 2020 2025E 2030E 2050E
*Includes owned electric generation, purchased power and WEC Infrastructure. The environmental attributes of the WECI renewable facilities
are or may be the property of third parties. As such, these third parties are solely entitled to the reporting rights and ownership of the
environmental attributes such as renewable energy credits, offsets, allowances and the avoided emissions of greenhouse gases.
**Includes projection of potential carbon offsets by 2050.
18Our ESG Progress Plan
Methane Reduction Goal
More than
halfway
0% Reduction Goal:*
30%
toward our
goal
-10%
-20%
by the year 2030
-30% from a 2011 baseline
-40%
2011 2020 2030
*This goal represents a decrease in the rate of methane emissions from the natural gas distribution lines in our
network of 30% per mile by the year 2030 from a 2011 baseline.
19Allocating $2.2 Billion 2021-2025
Infrastructure Portfolio
In-Service Capacity Investment
(MW) (in millions)
Upstream 200 $307
SD
Bishop Hill III 132 $166
Coyote Ridge 97 $145
Blooming Grove 250 $389
NE
Tatanka Ridge 155 $240
IL
Total 834 $1,247
KS
Under Development Capacity Investment
Thunderhead* 300 $381
Jayhawk* 190 $302
Total 490 $683
In-service Expect an additional $1.5 billion of investment
over the five-year period
Under development
*Investment part of the 2021-2025 capital plan
20Regional Economy
21Powering Industry Leaders in our Region
22Wisconsin Segment
Broad Ranging Growth Driving
Longer-Term Sales Forecast
Year-over-Year
2022 - 2025
Sales Growth Forecast Electric 1.0% - 1.3%
(weather-normalized)
Gas 1.0% - 1.3%
23Key Takeaways for WEC Energy Group
ESG Progress Plan supports 5-7% EPS growth with
minimal impact on customer rates
100% of capital allocated to regulated businesses or
contracted renewables
Dividend growth projected to be in line with earnings growth
No need to issue additional equity through forecast period
Strong and improving ESG profile
By the end of 2025, we expect that less than 10% of our
revenue and asset base will be tied to coal
Poised to deliver among the best risk-adjusted returns
in the industry
24Appendix
Electric Generation         Electric Distribution       Natural Gas Distribution

                  Energy Infrastructure             Electric Transmission

                                                                60% ownership

                                                                                   26
Office of the Chair
“Working together as a team, we will
leverage the strengths of each individual
as we write the next chapter of the
company’s growth, development and
service to our customers.”
- Gale Klappa, Executive Chairman
Scott Lauber Kevin Fletcher Xia Liu
Senior Executive Vice President and CEO Executive Vice President
President and Chief and Chief Financial Officer
Operating Officer
27Environmental, Social & Governance Focus
Met and exceeded our 2030 target. Set new goals to reduce carbon
Carbon Goals dioxide emissions from electric generation by 70% below 2005 levels by
2030 and to be net carbon neutral by 2050.
Methane Reduce the rate of methane emissions by 30% per mile from a 2011
Reduction Goal baseline by 2030
15.7 million Amount of combustion products for beneficial use provided over the past
metric tons two decades
$1.9 billion Planned utility renewable investments (2021-2025)
)
$2.2 billion Planned investment in contracted energy infrastructure (2021-2025)
Contributed by our companies and foundations to nonprofit
$20 million
organizations in 2020
46% diversity Board of directors who are diverse based on gender and/or race
Spent with certified minority-, women-, service disabled- and veteran-
$303.4 million
owned businesses in 2020
$119.4 million Spent on energy efficiency and conservation in 2020
28Today and Tomorrow
Why Our Natural Gas
Distribution Networks Matter -46°
Our Service Area -26°
65-78% of homes use natural gas for heating -26°
Growth continues as customers convert to natural gas
Hydrogen opportunities post 2030+ -23°
Potential to blend
Investment potential to convert existing distribution networks
Electric Conversion Debate
Today, electric heat pumps in our region are 4-5x more costly than natural gas heating*
Potential cost effective option after 2055?*
Natural hedge in Wisconsin since we serve both electric and natural gas customers
Weather in the map reflects (in Fahrenheit) actual temperatures reported by NOAA during the January 2019 polar vortex
* Based on independent research for the region we serve
29Wisconsin Utilities
Carbon-Free Generation Currently Under Development
Solar generation technology has improved in
efficiency, become more cost-effective and
complements our summer demand curve.
Wisconsin Electric, Wisconsin Public Service
and Madison Gas & Electric are partnering on
major solar initiatives.
In addition, Wisconsin Electric is moving forward
on two innovative renewable pilot programs for
185 MW of carbon-free generation.
Project Utility Location Investment Capacity* Timing
In Service:
Two Creeks Solar Project WPS Two Rivers, WI $130M 100MW
November, 2020
Targeted in-service:
Badger Hollow I Solar Park WPS Iowa County, WI $130M 100MW
Summer 2021
Targeted in-service:
Badger Hollow II Solar Park WE Iowa County, WI $130M 100MW
December, 2022
*Madison Gas & Electric will own an additional 50 MW at each site
30New Liquefied Natural Gas (LNG) Storage Facilities
Taking steps to maintain reliable and affordable service for our customers
LNG provides a solution We Energies is seeking approval for two
for Southeastern LNG facilities to address the need for
Wisconsin to meet peak
additional natural gas supply in Wisconsin
customer demand on the
coldest days of the year Total expected investment: $370 million
If approved, construction is expected to
begin fall of 2021
Targeted in-service date: Late 2023
31Project Highlights
Efficiency, Growth and Sustainability Progress
Electric Delivery Natural Gas System Technology
Redesign / Resilience Modernization Enhancements
• Addressing aging Illinois • Implementing advanced
infrastructure • Expected replacement of 2,000 metering
miles of piping for safety and
• Enhancing efficiencies and reliability in Chicago • Installing new customer
reducing operating costs information system
• Project $280-300 million annual
• Expect to spend $2.9 billion average investment • Project to spend
(2021-2025) $1.0 billion (2021 – 2025)
• Illinois law authorizes rider through
2023
Wisconsin
• Increasing quantity and reliability of
natural gas service in Southeastern
Wisconsin
32Wind Infrastructure Investment Summary
WEC
Commercial
Project Developer Location Investment Offtake Agreement Operations Capacity
Bishop Hill III 80% on 8/31/18
Henry County, $166M for WPPI Energy
Wind Energy Invenergy Incremental ~132MW
IL 90% ownership 22-years
Center 10% on 12/5/18
Upstream Wind Antelope $307M for Affiliate of Allianz 80% on 1/10/19
Invenergy ~200MW
Energy Center County, NE 90% ownership 10-years 10% on 4/8/20
$145M for
Coyote Ridge Avangrid Brookings Google Energy LLC
80% ownership and 12/20/19 ~97MW
Wind Farm Renewables County, SD 12-years
99% of tax benefits
Verizon and
Blooming Grove McLean $389M for
Invenergy Saint-Gobain North 12/8/2020 ~250MW
Wind Farm County, IL 90% ownership
America 12-years
Google Energy
Deuel County, $240M for 85%
Tatanka Ridge Avangrid 12-years
SD ownership and 99% 1/5/2021 ~155MW
Wind Farm Renewables Dairyland Power
of tax benefits
10-years
Thunderhead Wheeler and
$381M expected for AT&T
Wind Energy Invenergy Antelope Projected: 2021 ~300MW
90% ownership 12-years
Center Counties, NE
Bourbon & $302M expected for
Jayhawk Wind Apex Clean
Crawford 90% ownership and Facebook Projected: 2021 ~190MW
Farm Energy
Counties, KS 99% of tax benefits
Projected Returns Higher than Regulated Business
33$16.1 billion projected capital spend from 2021-2025
Low-Risk Capital Plan Drives 5% to 7% EPS Growth
$3,451 $3,489
$3,500
$3,312
$375
$688 $375 $3,037
$3,000 $253
$375 $2,811
$289 $93
$258 $107 $176 $375
$2,500 $99 $662 $96 Energy Infrastructure
$144
$584 $92 ATC Investment 1
$578 $614
$2,000 MERC/MGU
$542 $616
Illinois
$619
$1,500 $585
WI/MI Gas Delivery 2,3
$695
3
$582 WI/MI Electric Delivery
$664
$571 WI/MI Generation 3,4
$1,000
$578 $685
$652
$500 $900
$767
$555 $506
$350
$-
$ In millions 2021 2022 2023 2024 2025
Depreciation at the utilities expected to average $1.1 billion annually, and
$132 million at ATC, over the 2021-2025 period
1) ATC is accounted for using the equity method; this represents WEC’s portion of the investment
2) Gas delivery includes capital spend at Bluewater
3) Includes UMERC
4) Generation includes capital spend at We Power
34By Company
Capital Plan Projections ($ in millions)
2021 2022 2023
Wisconsin Electric $933.5 $1,032.0 $1,375.3
Wisconsin Gas $234.4 $256.2 $234.4
Wisconsin Public Service $578.8 $537.6 $443.8
Upper Michigan Energy Corp $16.7 $18.8 $16.7
Wisconsin Segment $1,763.4 $1,844.6 $2,070.2
Peoples Gas $509.5 $517.2 $598.6
North Shore Gas $64.4 $64.6 $62.3
Illinois Segment $573.9 $581.8 $660.9
Minnesota Energy Resources Corp $58.8 $49.2 $48.3
Michigan Gas Utilities $39.6 $57.6 $44.2
Other States Segment $98.4 $106.8 $92.5
WE Power $26.1 $99.2 $32.2
Infrastructure Investments* $713.9 $380.7 $376.9
Nonutility Energy Infrastructure $740.0 $479.9 $409.1
Corporate and Other $17.1 $10.1 $3.7
Total $3,192.8 $3,023.2 $3,236.4
* Infrastructure investments include capital spend at Bluewater
35Composition of Asset Base
Total 2020 Average Asset Base of $22.8 billion
Company Asset Base - $B % of Total
Wisconsin Electric $6.5 28.5%
Wisconsin Gas 1.6 7.0
Wisconsin Public Service 3.7 16.2
Upper Michigan Energy Resources 0.4 1.8
Peoples Gas 3.4 14.9
North Shore Gas 0.3 1.3
Minnesota Energy Resources 0.4 1.8
Michigan Gas Utilities 0.3 1.3
We Power 3.0 13.1
Bluewater 0.2 0.9
WEC Infrastructure 0.5 2.2
American Transmission Company 2.5 11.0
Total $22.8 100%
Note: We Power value represents investment book value
361
Power the Future Investments
Natural Gas Coal
2
Capacity 1,090 MW 1,030 MW
2
Investment $664 million $2 billion
ROE 12.7% 12.7%
Equity 53% 55%
In Service Dates Unit 1 – July 2005 Unit 1 – February 2010
Unit 2 – May 2008 Unit 2 – January 2011
Lease Terms 25 years 30 years
Cost Per Unit of Capacity $609/kW $1,950/kW
1. PTF provides approximately $200 million in positive cash flow annually.
2. All capacity and investment amounts reflect WEC ownership only.
Demonstrated capacity for the coal units is 1,056 MW – value shown in table is amount guaranteed in lease agreement.
37One of the Top Performers in Operating Efficiency
$35
2019 Non-Fuel O&M per MWh*
$31.20
$30 $29.30
$25
$23.30
$21.30 $21.50 $21.51
$20.80
$20.10
$20
$18.30
AVERAGE
$15.30
$15 $14.00
WEC
$10
The top 10 vertically integrated electric utilities by market cap
Source: FERC Form 1 Reports
*For all companies, excluded 1) pensions and other employee benefits, 2) costs reported as “transmission of electricity by others” to
neutralize differences in ownership of the transmission utilized by each utility, and 3) costs reported as “rents” within the production section
to control for difference in how power plants are owned and financed
38Focused on Efficiency
Reducing Day-to-Day O&M Expense*
$1,342
$1,281
$1,234
4.5%
3.7%
$1,143
$1,107
7.4%
3.2%
2-3%
$ In millions 2016 2017 2018 2019 2020 2021E
*Excludes costs that have a revenue offset such as operation and maintenance costs associated with the We Power generation units,
transmission expenses that are collected in rates, regulatory amortizations, riders, and other pass through expenses.
39Balance Sheet Remains Strong
Funds from Operations/Debt
18.0%
17.0%
16.0% 16.9% Target
15.0% WEC Energy Group 2020-2025
15.4%
14.0% S&P
>15%
13.0% FFO to Debt
12.0% Moody’s
>16%
11.0% CFO Pre-WC/Debt
10.0%
2020 Actual* 2020 Adjusted**
Issuer Credit Ratings Holding Company Debt to Total Debt
S&P Moody’s
Entity 30%
Rating Rating
28% Goal of
WEC Energy Group A- Baa1 25%
30% or
Less
Wisconsin Electric A- A2 20%
Wisconsin Gas A A3 15%
Wisconsin Public Service A- A2
10%
Peoples Gas A- A2 2020 2021-2025E
*FFO to debt ratio using GAAP operating cash flow and debt balance
**See reconciliation on last page of presentation
40Balanced Sales Mix
2020 Retail MWh Deliveries Mix*
33% Large C&I by Segment
Paper/Packaging 27%
Foundry (SIC 33) 10%
Mining/Minerals 9%
Small C&I Large C&I Food/Agriculture 9%
35% 33% Other Manufacturing 8%
Metal (SIC 34,35,37) 7%
Medical 6%
Residential Education 3%
plus Farm Chemical 4%
32% Printing 3%
Office 2%
Other 12%
*Wisconsin segment includes Michigan electric and retail choice customers in the Upper Peninsula
41Diverse Portfolio of Businesses
By Business By Jurisdiction
FERC Contractual FERC Contractual
(WECI) (WECI)
2% 2%
FERC FERC
Regulated Regulated
- Electric MI/MN - Electric
13% 5% 13%
Electric
Generation
Gas and IL WI
Distribution Distribution 16% 64%
34% 51%
Based on 2020 average asset base.
42Open Regulatory Matters
Estimated Key Dates
Wisconsin (apps.psc.wi.gov)
Decision on 2022 Rate Case “Stay Out” Q2 2021
Decision on Red Barn Wind Park (Docket 5-BS-256 filed 3/29/2021) 2021
Decision on Darien Solar and Battery Storage
(Docket 5-BS-256 filed 3/16/2021) 2022
Decision on Paris Solar and Battery Storage
(Docket 5-BS-254 filed 2/16/2021) 2022
Decision on LNG project (Docket: 5-CG-106 filed 11/1/2019) Q4 2021
Illinois (icc.illinois.gov)
Decision on NSG proposed base rate increase of $7.6 million or 8.5%
(Docket: 20-0810 filed 10/15/2020) Q3 2021
Decision on 2016 Rider QIP Reconciliation (Docket: 17-0137 filed 3/20/17) 2021
Michigan (michigan.gov/mpsc)
Decision on MGU proposed base rate increase of $15.1 million or 10.7%
(Docket: U-20718 filed 3/22/2021) Q4 2021
Minnesota (mn.gov/puc)
Nothing material pending
43Regulatory Environment
Wisconsin Illinois
Governor Tony Evers (D) Governor J.B. Pritzker (D)
Commission Commission
Gubernatorial appointment, Gubernatorial appointment, Senate
Senate confirmation confirmation
Chairman: Gubernatorial appointment Chairman: Gubernatorial appointment
6-year staggered terms 5-year staggered terms
Wisconsin Commissioners Illinois Commissioners
Name Party Began Serving Term Ends Name Party Began Serving Term Ends
Rebecca Valcq Carrie Zalewski
D 01/2019 03/2025 D 03/2019 01/2024
Chair Chair
Ellen Nowak R 12/2018 03/2023 D. Ethan Kimbrel D 01/2018 01/2023
Maria Soledad
Tyler Huebner* D 03/2020 03/2027 I 04/2019 01/2023
Bocanegra
Michael Carrigan D 01/2020 01/2025
Vacant
* Pending confirmation
44Rate-Making Parameters by Company
Utility Equity Layer (1) Authorized ROE
Wisconsin Electric 50.0%-55.0% 10.0%
Wisconsin Public Service 50.0%-55.0% 10.0%
Wisconsin Gas 50.0%-55.0% 10.2%
Peoples Gas 50.33% 9.05%
North Shore Gas 50.48% 9.05%
Minnesota Energy Resources 50.9% 9.7%
Michigan Gas Utilities 52% 9.9%
We Power 53%-55% 12.7%
American Transmission Company 50% 10.52%(2)
Constructive regulatory environments
Earnings sharing mechanism at all Wisconsin utilities
(1) Represents the equity component of capital; rates are set at the midpoint of any range
(2) Raised from 10.38% pursuant to FERC decision on May 21, 2020
45Key Rate Making Components
Michigan–
Illinois– Minnesota– Electric & Wisconsin– Wisconsin–
Area Gas Gas Gas Gas Electric
Gas Pipeline Replacement
PGL
Rider
Bad Debt Rider ✓
Bad Debt Escrow Accounting Residential Residential
Decoupling ✓ ✓
Fuel Cost Recovery 1 for 1 recovery of prudent fuel costs +/- 2% band
Manufactured Gas Plant Site
✓ ✓ ✓ ✓ N/A
Clean Up Recovery
Invested Capital Tax Rider ✓
Forward-looking test years ✓ ✓ ✓ 2 years 2 years
Gas Utility Infrastructure
Cost Rider Surcharge ✓
No sharing on first 25 bp
above allowed ROE, 50/50 on
Earnings sharing
next 50bp, 100% to
customers beyond 75 bp
46Industry Leading Total Shareholder Returns*
Over the past decade, WEC Energy Group has consistently delivered among the best total
returns in the industry
350%
300%
250%
WEC Energy Group
200% Dow Jones Utilities
S&P Utilities
150% Philadelphia Utility
S&P Electric
100%
50%
0%
One-Year Three-Year Five-Year Ten-Year
* Total return including reinvested dividends for the periods ended December 31, 2020
Source: Bloomberg
47Contact Information
M. Beth Straka
Senior Vice President – Investor Relations
and Corporate Communications
Beth.Straka@wecenergygroup.com
414-221-4639
Ashley Knutson
Investor Relations Analyst
Ashley.Knutson@wecenergygroup.com
414-221-3339Reconciliation of Reported EPS (GAAP) to
Adjusted EPS (Non-GAAP)
2014 2015 2016 2017
Reported EPS – GAAP basis $2.34 $2.59 $ 2.96 $ 3.79
Acquisition Costs $0.39 $0.06 $ 0.01 –
Integrys Earnings $(0.47)
Impact of Additional Shares $0.47
Tax benefit related to Tax Cuts and Jobs
– – – $ (0.65)
Act of 2017
Adjusted EPS – Non-GAAP basis* $2.73 $2.65 $ 2.97 $ 3.14
* WEC Energy Group has provided adjusted earnings per share (non-GAAP earnings per share) as a complement to, and
not as an alternative to, reported earnings per share presented in accordance with GAAP. Adjusted earnings per share
exclude, as applicable, (1) a one-time reduction in income tax expense related to a revaluation of our deferred taxes as a
result of the Tax Cuts and Jobs Act of 2017; (2) costs related to the acquisition of Integrys Energy Group; (3) the results of
operations of Integrys and its subsidiaries; and (4) the additional shares of WEC Energy Group common stock that were
issued as part of the acquisition. None of these items are indicative of WEC Energy Group’s operating performance.
Therefore, WEC Energy Group believes that the presentation of adjusted earnings per share is relevant and useful to
investors to understand the company’s operating performance. Management uses such measures internally to evaluate the
company’s performance and manage its operations.
49Ratio of FFO to Debt
(in millions, except percent)
Ratio of FFO to Debt 2020
Net cash provided by operating activities $2,196.0
Total Debt $14,290.8
Ratio of FFO to Debt 15.4%
Ratio of FFO to Debt - Adjusted 2020
Net cash provided by operating activities $2,196.0
Add: Employer contributions to qualified pension plans 100.0
Add: Accounts receivable arrears attributed to COVID-19 85.0
Net cash provided by operating activities – adjusted $2,381.0
Total Debt $14,290.8
Less: Employer contributions to qualified pension plans 100.0
Less: Accounts receivable arrears attributed to COVID-19 85.0
Total Debt - Adjusted $14,105.8
Ratio of FFO to Debt - Adjusted 16.9%
50You can also read