Parliament of Australia Joint Select Committee on Road Safety August 2021 Submission
←
→
Page content transcription
If your browser does not render page correctly, please read the page content below

Parliament of Australia

Joint Select Committee on Road Safety

            August 2021 Submission

   Andrew King | 3M Transportation Safety, ANZ Business Manager
Kosta Karagiannopoulos | Application Engineering Specialist – TSD ANZ
         Richard Lord | 3M Head of Government Affairs ANZ
          Dr Kim Tan | 3M Asia Regulatory Affairs Manager

                                                                        1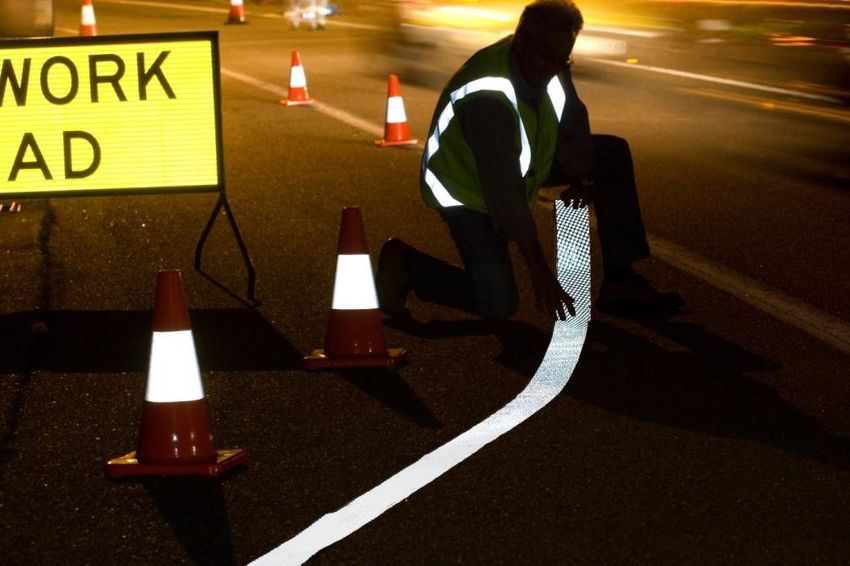
3M Australia
       Parliament of Australia Joint Select Committee on Road Safety Submission 2021

1 Introduction
With 3M’s nearly 80-year history of contributing to safer roads, we know that it takes all stakeholders
working together to address issues surrounding transportation and mobility, and to drive real and
lasting improvement. Together, with the combined and collaborative efforts of government agencies,
safety associations and advocacy groups around the world, we strive to reduce traffic fatalities globally
and help save lives.

By working with leading global organizations, including the United Nations, Fédération Internationale
de l'Automobile, and the International Road Federation, 3M hopes to improve road safety and realize
zero fatalities through the deployment of advanced technologies. In addition, 3M is working today on
the connected roads of tomorrow. Many of the automated technologies found in cars today use the
same infrastructure drivers have relied on for years to help them safely navigate. 3M’s goal is to
continue to help improve safety through enhanced infrastructure for both human drivers and
automated vehicles.

Like you, we aspire to a world free of roadway fatalities and serious injuries. Its why we have partnered
with the U.N internationally and are a national partner of The Safer Australian Roads and Highways
Group (SARAH) and Australasian Collage of Road Safety. In partnership with ACRS, we have created the
premier road safety award recognizing exemplary innovation and effectiveness to save lives and injuries
on our roads. Now in its 11th year the 3M-ACRS Diamond Road Safety Award is open to any road safety
practitioner who works within the public and private sector. The individual team leader of the winning
project receives a trip to the ATSSA annual convention in the USA and visit 3M head office in
Minnesota. Along with this award, 3M are a sponsor of the Safety360 truck, that provides a custom-
built road safety exhibition that educates young road users how to share the road safely with trucks in
an exciting and engaging way through immersive virtual reality.
3M has also pledged support as a founding donor to a newly established United Nations Road Safety
Trust Fund and has committed $250,000 to the UN Road Safety Trust Fund which aims to accelerate
progress in improving global road safety by bridging the gaps in the mobilization of resources for
effective action at all levels.

3M has a long history of using science to improve lives. Its Transportation Safety Division is a global
leader in developing products, systems and services for the traffic safety and vehicle registration
segments, with the mission to help bring families home safely.

In the following subsections, we outline the key technologies that 3M provide and summarise how they
can assist in providing better road safety outcomes.

    1. Retroreflective Traffic Signs
    2. Wet Reflective Pavement markings
    3. Heavy Vehicle Conspicuity Markings

We hope the Joint Select Committee on Road Safety will make determinations of global best practices,
adopt policy measures and budget appropriations to further enhance the safety of Australian driving
public.

                                                                                                            2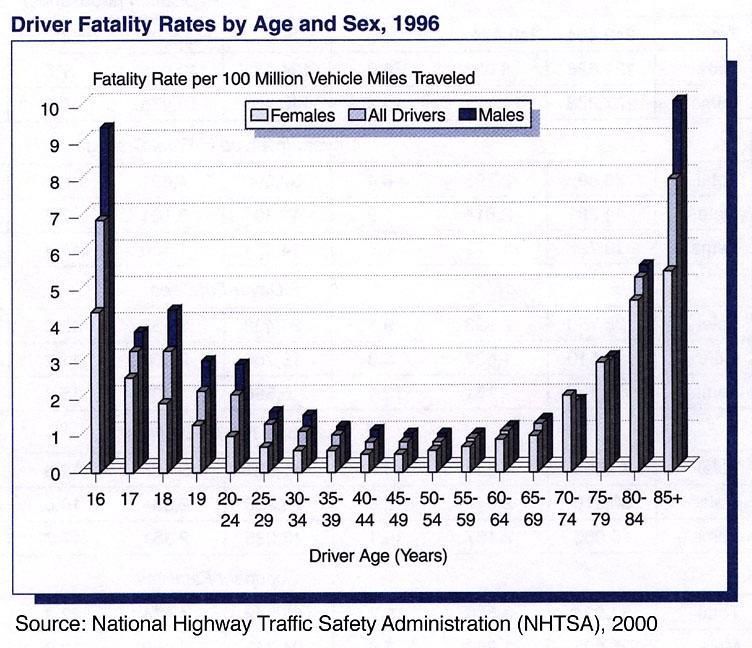
Contents
1      Introduction ...................................................................................................................................2
Contents .................................................................................................................................................3
2      Retroreflective Traffic Signs ..........................................................................................................4
    2.1        Ambient Light ............................................................................................................................. 4
    2.2        Sign Position ............................................................................................................................... 5
    2.3        Headlight Changes ...................................................................................................................... 5
    2.4        Vehicle Type ............................................................................................................................... 5
    2.5        Speed of Travel ........................................................................................................................... 6
    2.6        Age of the Driver ........................................................................................................................ 6
    2.7        Fluorescent Signs ........................................................................................................................ 6
    2.8        Recommendations for Traffic Sign Standards ............................................................................. 6
3      Wet Reflective Pavement Markings ..............................................................................................7
    3.1        Improvements on High Trafficked Roads .................................................................................... 7
    3.2        Improvements on Rural Low Trafficked Roads ........................................................................... 7
    3.3        Catering for Autonomous Vehicle Features ................................................................................ 8
    3.4        Carbon Reduction and Sustainability .......................................................................................... 8
    3.5        Recommendations for Pavement Marking Standards ................................................................ 8
4      Heavy Vehicle Conspicuity Markings...........................................................................................10
    4.1        Recommendations for Heavy Vehicle Conspicuity Mandate .................................................... 11
5      Summary ......................................................................................................................................12
6      Appendix ......................................................................................................................................14
    6.1        Global Road Safety Action Plan ................................................................................................ 14
    6.2        Retroreflective Traffic Signs ...................................................................................................... 14
       6.2.1          Ambient Light ................................................................................................................... 14
       6.2.2          Sign Position ..................................................................................................................... 15
       6.2.3          Headlight Changes ............................................................................................................ 16
       6.2.4          Vehicle Type ..................................................................................................................... 17
       6.2.5          Speed of Travel ................................................................................................................. 18
       6.2.6          Age of the Driver............................................................................................................... 19
       6.2.7          Fluorescent Signs .............................................................................................................. 20
    6.3        Wet Reflective Pavement Markings ......................................................................................... 21
       6.3.1          Improvements on High Trafficked Roads .......................................................................... 21
       6.3.2          Improvements on Rural Low Trafficked Roads ................................................................. 23
       6.3.3          Catering for Autonomous Vehicle Features ...................................................................... 24

                                                                                                                                                              3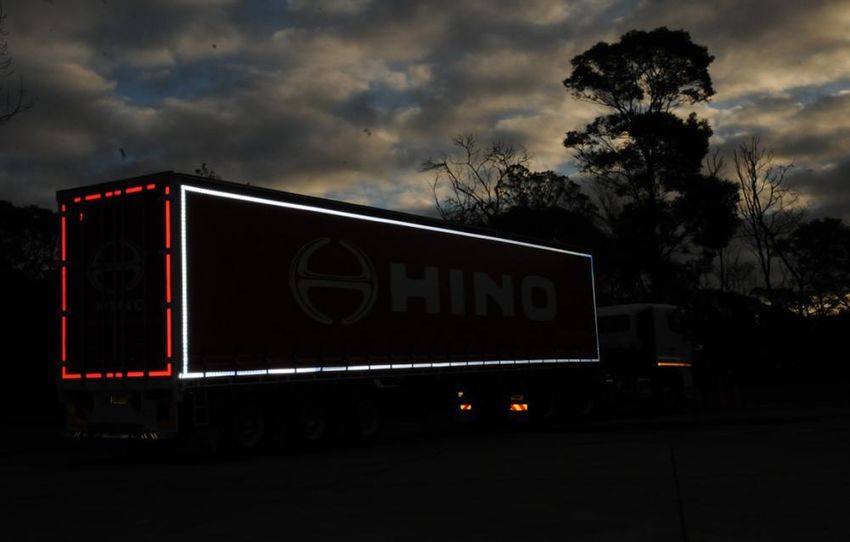
2 Retroreflective Traffic Signs

The science of signs is well established, and 3M were the first company to introduce retro-reflectivity
into traffic signage in the 1930’s. This technology has improved immensely in this time and the
standards have been adapted to leverage this technology and its use on our roadways.

When the sun is out, the daylight illumination can be as high as 100,000 lux in tropical places. In
comparison, the headlights from vehicles are approximately 10,000 lux total and at a distance of 5 m
from the headlights on the road surface, the illumination is a mere 200-300 lux. Very little light from the
vehicle goes towards other cues for driving including traffic signs. Driving at night is very challenging.
Statistically, fatal crashes happen a lot more often at night, with a fatality rate per kilometre of travel
about three times as high as daytime hours i. Studies have found that the driver sees less than 5% of
visual cuesii such as road lanes, road shoulder, roadside hazards, traffic control devices, guardrails,
vegetation, etc. at night versus daytime driving. This visibility is more adversely affected by the
prevailing weather conditions such as rain, fog, snow and ice.

The function of a traffic sign is to convey information to the drivers. More visible signs have been shown
to cut nighttime accidents by up to 48% iii. Sign reading has to be effortless and quick allowing the driver
to redirect visual attention back to the roadway and attend to varied driving tasks. There are several
factors that make traffic sign recognized differently during the daytime and nighttime. We call these
disadvantaged driving factors as below:

    a.   Ambient light,
    b.   Sign position,
    c.   Headlight changes,
    d.   Type of vehicles,
    e.   Speed of travel and,
    f.   Age of the driver.

                          What you see during the day is not what you see at night.

2.1 Ambient Light
Lights from commercial buildings, advertisement billboards, street lighting etc. can all be distracting to
drivers in an urban environment whether that is a motorway or just driving in a city centre. Traffic signs
need to compete with all of the above to get the driver’s attention. Brighter signs are required to win
the driver and ensure safety brightness comes on top.

                                                                                                          4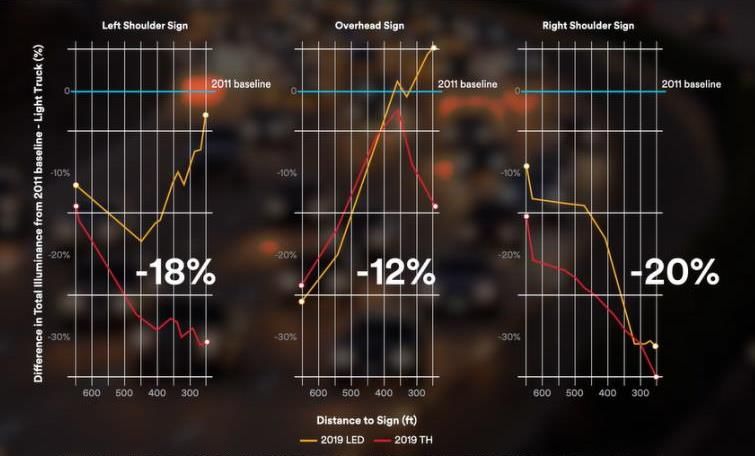
Conversely for rural roads the ability to locate signage and visual delineation is important in an
environment where limited ambient light is available, and illumination is fully dependent on the
vehicle’s headlights.

2.2 Sign Position
Overhead or gantry mounted signs are much preferred by drivers because the messages for drivers in
each lane can be setup and there is no foliage or other large and tall vehicle obscuration unlike shoulder
mounted signs. Vehicle headlights however are designed to provide “seeing light” which is directed
towards the road surface and only a small amount of “glare light” is directed towards traffic signs.
Since those signs are located high up, they only receive a very small amount of light, they will never be
as bright and therefore as visible as other signs at road shoulder level. A higher performance sheeting
(class) is therefore required to compensate for that disadvantaged position to ensure drivers see them
on time, pay attention and reduce unnecessary last minute corrections by oversteering.

2.3 Headlight Changes
The latest 2019 market-weighted sedan car and light truck low beam distribution conducted by
University of Michigan Transportation Research Institute (UMTRI) revealed that the traffic sign
illumination has dropped by as much as 20% versus the last such market-weighted headlight research in
2011 vehicle models. The relative illumination patterns of 2011 and 2019 vehicle headlights are shown
below.

To mitigate the issue of less light reaching traffic signs from new vehicles, we urge the committee to
consider upgrading at least the overhead and far shoulder signs to the performance of a Class 1100
sign. This will dramatically increase the visibility for those signs that otherwise could go unnoticed by
the driver and convey their messages to them.

2.4 Vehicle Type
Truck drivers sit much elevated versus their headlights than in sedan vehicles. Their views of the
overhead signs are not obstructed by small vehicles during the day. However, when night falls, they rely
on headlight illumination to read signs and it is this situation that they are significantly disadvantaged
by their large observation angles at short viewing distances of 50 to 150 m. Upgrading overhead signs
can gives the truck drivers twice as much light to read the signs and therefore safer navigation.

                                                                                                            5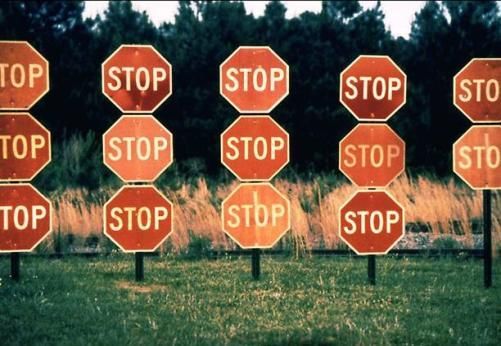
2.5 Speed of Travel
Not only the letter sizes can be increased to provide higher visibility to the motorists traveling at high
speed, but the need also to provision for 5-6 seconds of legibility distance14 for 4-8 guide sign words
means the traffic signs must be brighter and is legible from longer distances, perhaps towards 200-250
m distancesiv.

2.6 Age of the Driver
Older drivers are disadvantaged in that they need several times more light to read and understand the
same traffic sign vs. younger drivers and they require more reaction time to respond to the driving
cues. With demographic changes in Australia there is a need to recognise the reduced visual acuity of
older drivers to improve road safety for older drivers

2.7 Fluorescent Signs
Fluorescent signs improve “daytime” legibility of traffic signs v and enhances safer driver behaviour
compared to standard coloured signs when used appropriately vi. It is therefore a global best practice
that fluorescent yellow signs replace standard yellow signs in critical warning situations; fluorescent
yellow green signs replace standard yellow signs for dealing with vulnerable road users such as
pedestrians, cyclists, and motorcyclists; fluorescent orange signs replace standard orange signs for work
zone applications. The use of fluorescent colours, apart from higher day time brightness, promotes an
automatic visual attention due to the attractive, uncommon coloursvii. Work zone signs are especially
critical because the routing and channelization can change by the week, day or even hours. The use of
fluorescent orange work zone colour positively affects the driver behaviour, inducing them to take
timely and proper actions to the work zone messagesviii.

Therefore, we urge the committee to expand the use of fluorescent signages in all cases of dealing with
critical locations such as blackspots, vulnerable road users and work zones.

2.8 Recommendations for Traffic Sign Standards
Traffic sign upgrades offer tremendous potential to elevate road safety. We suggest the committee
consider a targeted and evidence-based approach to provide guidelines for the state roadway
authorities to mandate Class 1100 signages for critical and disadvantaged situations. These include,

    a.   High speed roads whether motorways or rural highways,
    b.   High complexity environment such as city centres, shopping districts, high density traffic roads,
    c.   All overhead and far shoulder signs because the illumination levels are low,
    d.   Critical locations such as blackspots, school zones, silver zones, pedestrian zones, work zones
    e.   Fluorescent signages when dealing with vulnerable road users – pedestrians, cyclists, and
         motorcyclists and,
    f.   Fluorescent signages for work zone signs because motorists will be unfamiliar with each work
         zone channelization which changes often.

In a 2013 Albuquerque, New Mexico, US road safety study ix, the treatment area where the signages
were upgraded to ASTM Type XI saw night-time crashes reduced by 30% vs the control section one year
after mitigation was put in place. In the 2005 study by Ripley iii, it was reported that the benefits of
upgrading traffic sign was 22 times the investment, compared to around seven times returns for
erecting new median barriers or upgrading guardrails.

                                                                                                             6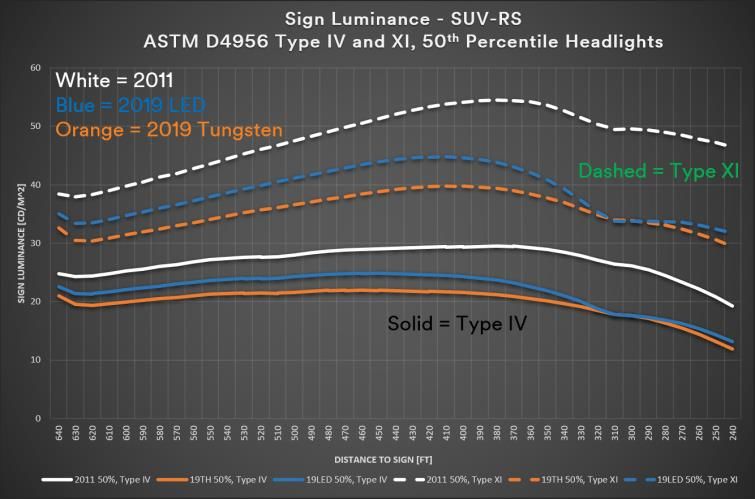
3 Wet Reflective Pavement Markings

In terms of road safety improvement and investment, there seems to be two groups of road lanes
requiring distinct road safety improvement solutions. The paved undivided roads, including rural
highways which are mostly two lanes, are 15 times longer lane-km than the paved divided roads
(including 4-lane highways, 4 or more lane motorways and metropolitan tunnels). It also means paved
undivided roads are mostly rural and may only carry low traffic volumes. The divided road lane-kms
carry the majority of Australian road traffic with only 6% of the lane-km and 3% of the linear km.

The biggest complaint about line markings is often that they disappear in the rain and after rain when
the surface is wet. This leads to increased road crashes in wet conditions, especially at night-time.
Forbes reportedx that approximately half of the US fatalities happened at night, though the traffic
volumes at night were light vs. the daytime traffic. As a result, night-time driving is three times higher
risks as far as road traffic fatalities is concerned. The New Zealand Transport Agency (NZTA) data xi show
evening rush hour (4-5pm) has approximately twice the number of fatalities and serious injuries than
morning rush hours (8-9 am). The US Federal Highway Administration (FHWA) similarly found xii that
21% of the nearly 6 million crashes in the US are weather related (data from 2007 to 2016) of which
70% of the weather events are wet pavement (after the rain) and 46% during active rainfall.

3.1 Improvements on High Trafficked Roads
The high-volume roads require several pavement marking attributes to serve the safety needs of the
road users and the goals of the road authorities.

    a. High visibility of lane lines in dry, rain and after rain (wet) conditions both daytime and night-
       time,
    b. Durable lane line markings so as to minimize restriping frequency that puts workers at risk of
       road crashes and inconvenience the motoring public and,
    c. Special attention to the lane line adhesion on concrete road surface to make the markings last
       as long as those on asphalt surface.

The evidence from multiple research projects for crash reduction benefits of wet reflective road
markings is clear and convincing. There are however continued budget challenges to put up wet
reflective markings state-wide, nationwide. The key here is to perform total cost of ownership over the
warranted service life of the installed markings.

California Department of Transport (Caltrans) for example issued an annual efficiencies report xiii in 2018
that estimated the state saved US$16.5 million per year or 38% of ongoing line marking maintenance
costs for the new 6-year contract after awarding line marking contracts to a new technology that is
more durable and high performance including having the wet retro reflectivity. The report claimed the
high-performance lines gave longer preview distances, would improve guidance and road safety and
the restriping frequency would be reduced, causing less inconveniences to the motorists and also
improve road safety. It is worth noting that the cost of ownership each year went down despite the
markings being upgraded from 4” to 6” width lines.

3.2 Improvements on Rural Low Trafficked Roads
Roadway Departure (RwD) or not keeping lanes on the road is the most dangerous driver behaviour.
The US Federal Highway Administration (FHWA) reported xiv approximately 51% of the US road traffic
fatalities in 2016-2018 involved RwDxv which often results in head-on collisions. Australia’s road safety
factsheetxvi for 2015-2016 cited 44% of all crashes on regional and remote roads are single vehicle run-
                                                                                                            7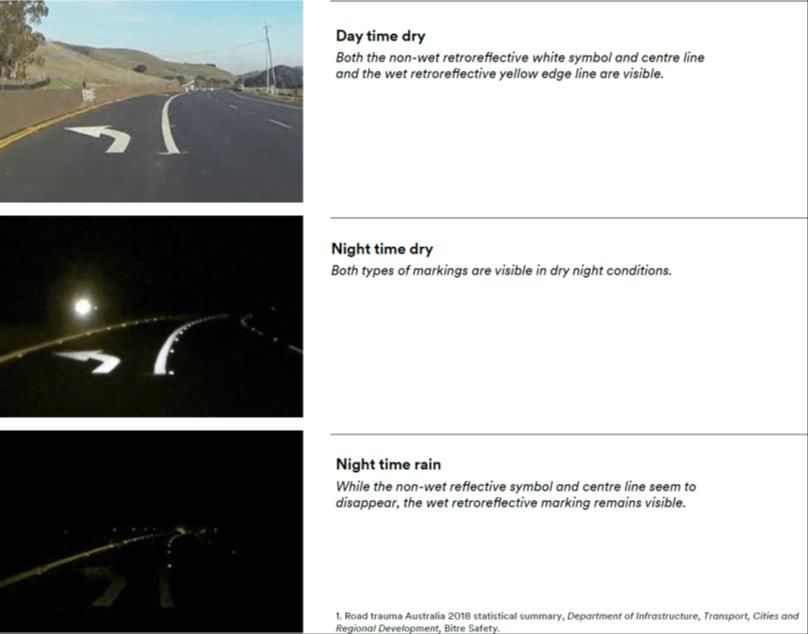
off crashes. In addition, Australia road death dataxvii that is available from January 1989 to July 2021
shows that the fatalities from single vehicle crash type is twice the number of multiple vehicle crash
type at night-time. The ratio for daytime traffic fatality is slightly less for single-vehicle crash type. This
suggests visibility at night-time is a factor for the single vehicle run-offs.

Professor Haworth from Queensland University of Technology’s Centre for Accident Research and Road
Safety (CARR-Q) is of the opinion that road infrastructure rather than drivers’ risky behaviours has a
greater impact on the serious injuries from road crashes xviii. We urge the committee to look into
requiring and funding the vast network of rural 2-lane undivided roads with the minimum standard of
centre line and edge line markings. The markings should fully function as delineation guides in daytime,
night-time, dry and wet weather conditions to reduce the risks of roadway departures resulting in
single vehicle crashes.

3.3 Catering for Autonomous Vehicle Features
It is worth noting that the benefits of better line marking do not have to wait for full vehicle autonomy.
We already have more than 50% of new vehicles in mature auto markets such as Australia that come
fitted with these features as standard offering. Lane Keep Assist and Lane Departure Warning Systems
are low-level vehicle autonomy safety features rated as SAE Level 0 or 1 automation. Tapping into these
features to save lives can start now if they do not need to be disabled in inclement weather conditions.

3.4 Carbon Reduction and Sustainability
With more durable markings being adopted, it is also expected that the solution is more sustainable,
helping to reduce carbon footprints. In fact, in Germany’s autobahns running over four states, the
practice is to embed road marking tapes into newly laid asphalt while it is cooling down. The road
owner does not need to replace the markings for as long as the asphalt overlay is not renewed.
Preformed tapes with high performance optics and durable topcoat are selected for this application.
Fewer durable marking products needed to be produced in the factories, consuming less raw materials
and energy/electricity can lead to a reduction in the carbon generated in these processes. Less frequent
restriping creates less carbon dioxide with the application activities (workers’ per capita carbon, carbon
emission from the transportation of products, workers and equipment, application equipment
fuel/energy related carbon emission, etc.).

3.5 Recommendations for Pavement Marking Standards
It is recognized that the goal to upgrade the vast road network in Australia, measuring some 380k
linear km and some 790k lane km, to global standard is mammoth undertaking. We urge the committee

                                                                                                                  8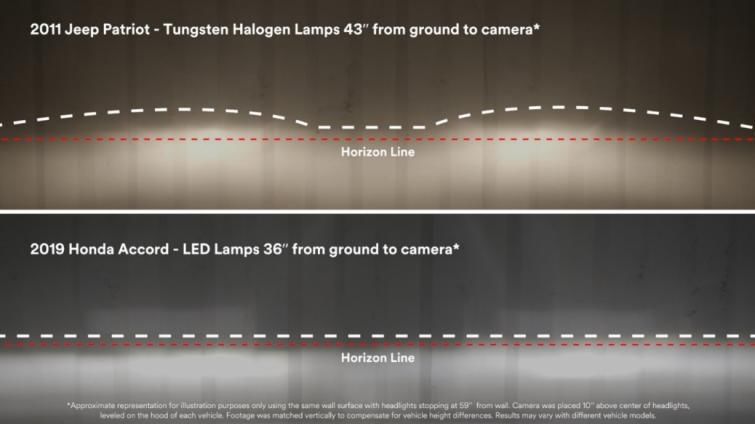
to investigate the following items to enhance the road safety in Australia via road marking standard
upgradation.

    a. Harmonize the state road marking standard specifications guided by Austroads ATS-4110-21 in
       which a mandatory 80 units of RL wet retro reflectivity is the needed performance at any time.
       The target road network may be the estimated 20% paved divided roads, motorways, and rural
       highways.
    b. Specify increased durability intervals along with the required minimum RL performance over
       four (4) years for the prioritized road segment above a certain AADT and road presence more
       than six (6) years.
    c. Specify preformed permanent tapes for concrete road surface both to create the contrast
       markings and to increase the durability in adhering to the road surfaces.
    d. Recommending performance-based contracts which are awarded to contractors for longer
       durations, taking best practices from Sydney Road Asset Performance contract setup that
       rewards lower total cost of ownership over longer contract durations (9 to 15 years).
    e. For the vast network of 2-lane undivided rural roads with low AADT, mandate a minimum
       standard line marking to ensure visibility of roadways and traffic lanes to reduce risk of
       roadway departures at night and in adverse weather conditions. Marking edge lines and centre
       line is the lowest cost short term solution in the road safety toolkit.
    f. Assess road marking standard specification to support current and future autonomous safety
       features such as lane departure warning and lane keep assist.
    g. Assess carbon footprint of road marking solutions over the life of contract, potentially setup a
       carbon offset mechanism or adding a virtual markup of tender value due to carbon footprint
       evaluation may be implemented to nudge the industry towards longer durability solutions.

                                                                                                       9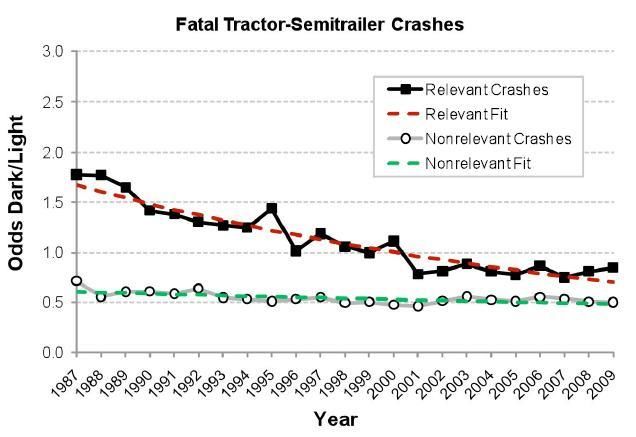
4 Heavy Vehicle Conspicuity Markings

The road safety outcomes through the use of Conspicuity tapes on Heavy Vehicles has had extensive
research globally spanning over 30 years and there are at least 13 research papers that provide
evidence on its effectiveness to reduce road crashes and fatalities. This evidence and accompany
information were presented by 3M to the Australian Joint Select Committee on Road Safety in 2020 and
the full submission is on record and available.

The overwhelming evidence has led to the mandatory introduction of these products into the USA for
new vehicles in 1993 and retrofitting of existing vehicles in 2001. A review of the heavy vehicle crash
data from 1987 to 2009 in the states of Florida and Pennsylvania by University of Michigan
Transportation Research Institute foundxix that rear and angled collisions at nights involving trucks and
trailers fell by 58% cumulatively over the 23-year period that conspicuity laws were becoming
mandatory in the US.

In 2000, Darmstadt University of Technology in Germany studied 2216 crashes involving trucks. Of the
collisions that occurred during darkness and twilight, 37% of impacts on a truck side and 41% of impacts
on the truck rear were caused by the truck not having been recognized in time by other drivers involved
in the crashes. Following this analysis 1000 trucks were taken to be studied over a two-year period to
evaluate the effectiveness of contour markings to help with early recognition and crash reduction. The
results were significant: the control group with no reflective markings had 30 incidents of side or rear
collisions, whereas only 1 crash occurred in the test treatment group of trucks with contour markings.

In Europe, Italy was the first country to introduce mandatory conspicuity markings for all commercial
vehicles and trailers above 3.5 tonnes in to ECE R48 and R104 regulations for all new heavy vehicles
manufactured after July 2011. The ECE R48 and R104 regulations had been widely replicated in Asia in
2000s, including mandatory applications in India, Malaysia, Thailand, Indonesia, Singapore, Korea and
Taiwan.

The ECE R104 Regulation is included in the Australian Design Rule 13/00 – “Installation of lighting and
light signalling devices on other than L-Group Vehicles 2005” (Section 6.21.). This inclusion of the

                                                                                                          10
regulation has had a variation added in Section 8.15.1 that states: ‘Mandatory read optional’ and as
such the adoption of these markings is on an optional or voluntary basis.
4.1 Recommendations for Heavy Vehicle Conspicuity Mandate
The Joint Select Committee has outlined the committee work to reduce road trauma with a focus on
heavy vehicle safety and the gig economy. As we gave evidence in the last committee hearing, the
statistics on heavy vehicle accidents are of great concern to the community. In the 12 months to the end of
March 2020, we have seen 176 fatalities involving heavy vehicles. Concerningly, heavy vehicles and buses
make up only 3.7 per cent of the Australian fleet yet are involved in 16 per cent of all road fatalities.
Australia is missing out on the “entitlement” of approximately 58% reduction in relevant nighttime crashes
involving heavy vehicles that major advanced economies have enjoyed since the mandatory introduction of
contour markings almost 30 years ago. We urge the committee to relook the case of mandatory markings
per ADR 13/00 which will save tremendous number of lives in the decades to come, and it is consistent with
UN Decade of Action for Road Safety pillar and Safe System Design of vehicle safety.
115 Summary
Australia’s draft National Road Safety Strategy (NRSS) 2021-2030 has called for aggressive 50% road
traffic fatality and 30% serious injury reductions, both reductions pegged to 100k population basis. The
last NRSS cycle (2011 – 2020) saw approximately 9% road traffic fatality reduction versus a target of
30%. Clearly, road safety gains are harder to come by and the national road traffic fatality over the last
decade had been range bound to 1,200 +/- 100. It is against this backdrop that we are urging the Joint
Select Committee to review the learnings of the road safety initiatives over the last decade and
consider bold policy measures to set the country to the right trajectory for the new decade. The
International Transport Forum (ITF) Road Safety Report 2020 pegged Australia to less than 20% road
death reduction over 2010-2018 and ranked the country at #20 amongst the OECD countries. Norway,
Ireland, Denmark, Korea and Japan had reductions that were 30% or more over the same period.
Our policy inputs are grouped into three categories:
a. Retroreflective traffic signs,
b. Wet reflective pavement markings and,
c. Heavy vehicle conspicuity markings.
In traffic signage domain, the key factors impacting road safety are the disadvantage driving situations,
such as a. ambient light, b. sign position, c. headlight changes, d. type of vehicles, e. speed of travel and
f. age of the driver.
The majority of Australian traffic revolves around major cities where bright lights and high-density
traffic is the norm. Our recommendation is to mandate Class 1100 traffic signs to provide sufficient
brightness contrast to compensate for the bright ambient. We also suggest Class 1100 for overhead and
far shoulder signs with larger letters in line with global practices to cater for the disadvantaged older
drivers. Catering for the disadvantaged sitting positions such as SUV and heavy truck drivers makes
sense too. These drivers experience 2 to 3 times larger observation angles (a factor on sign visibility) to
traffic signs than sedan car drivers. Newer generations of vehicles have headlights that point more
towards the road than to the verge and up high where many signs are located. The traffic sign
illumination may be as much as 20% to 35% less depending on sign positions and vehicle approach
distances. It is therefore common sense to insist on Class 1100 signages in place of Class 400 signages
so that new vehicle and tall sitting drivers get the visibility cues for driving safely. Fluorescent signages
are particular effective for the most critical road stretches such blackspots and in dealing with
vulnerable road users such as school children and pedestrians and improve visibility in low ambient
light conditions such as dawn and dusk as well as in foggy conditions.
A peculiar trend of the Australian road traffic fatality is that two thirds of lives are lost in the regional
and remote areas versus one third in major cities, even though the major cities have over 70% of the
populations. As a result, the traffic fatality rate in regional and remote areas is about 5 times that of the
major cities. Single vehicle run-off crashes are 44% of the crashes on regional and remote roads. The
fatalities related to night-time single vehicle crash type is twice that of the multiple-vehicle crash type,
whereas they are about the same during daytime crash fatalities. This suggests that night-time visibility
of regional and remote roads is inadequate. We propose that the committee assesses the critical data
about delineation on rural low traffic roads and causes of roadway departure crashes and consider
simple improvements such as enhanced pavements marking and delineation.
For the high traffic density roads around major cities and major rural highways, the suggestion is to
tackle the wet reflectivity requirements to provide adequate visibility to the drivers in all weather
12conditions. High brightness performance and long durability markings can go hand in hand. For
concrete surface roads, preformed pavement marking tapes may be a suitable solution to enhance the
adhesion on concrete so that these markings are highly durable. Harmonizing road marking
specifications across various states go some ways towards elevating the standards to support safer
roads and autonomous vehicle features. Maintenance contracts that are long term may be used to
encourage contractors to adopt the lowest total cost of solutions rather than a low tender price that
requires frequent restriping. A road marking solution that lasts 2 to 3 times longer than current solution
may help to reduce carbons associated with the road marking material production, transportation, and
application if the restriping frequency is drastically reduced.
Heavy vehicles are overrepresented in road traffic fatalities and serious injuries. Australia remains the
only advanced western country that does not require mandatory ECE R104 contour conspicuity
markings or equivalent. As a result, the heavy vehicle fleet has low penetration of voluntary conspicuity
tape markings. The country is missing out on an entitlement gain of some 60% relevant night-time crash
reduction that US data has proven. There is little excuse to not do all we can as responsible policy
makers to save lives, in the face of overwhelming safety benefits from nearly 40 years of conspicuity
research findings. We strongly urge the committee to come up with policy measures to encourage the
adoption of ADR 13/00 as a mandatory regulation.
136 Appendix
6.1 Global Road Safety Action Plan
Road safety is not a uniquely Australian issue. United Nations (UN) recognized road traffic crashes,
injuries and fatalities are a leading cause of mortality globally. The first global Ministerial Conference on
Road Safety was organized in Russia1 in 2009 to address the health epidemic in road trauma. The
conference led to the UN launching the first Decade of Actions for Road Safety (DOA 2) and put World
Health Organization (WHO) in charge of coordinating global actions. The target of the DOA 2011-2020
was to reduce road traffic injuries and fatalities by 50% at the closing of the decade. In the Australia
case, the country managed to reduce road traffic deaths from an average of 1,427 (2011 baseline
target) to 1,121 by mid-2020, a 9% reduction. The target according to National Road Safety Strategy
(NRSS) 2011-2020 was 998 road deaths (a 30% reduction).
WHO reported in Global Road Safety Status Report 3 2018 that the world loses about 1.35 million people
due to road crashes. It is certainly an epidemic especially amongst the young road users, in which road
traffic injuries are the number two cause of mortalities 4. The UN General Assembly agreed on
Resolution A/RES/74/299 in September 2020 to improve global road safety and proclaimed a second
DOA for Road Safety 2021-2030 with the aim to halve the road traffic injuries and fatalities 5. Australia’s
draft National Road Safety Strategy (NRSS) 2021-2030 are aligned to the global action plan in which the
country targets to reduced road traffic fatalities per capita (based on per 100k population metric) by
50% and serious injuries per capita by 30%. If these targets are met, the country could look for
approximately 41% reduction from current levels to 689 road traffic deaths a year by 2030.
UN DOA teaches Safety System Design based on five pillars of road safety – a. Road Safety
Management, b. Safer Roads, c. Safer Vehicles, d. Safer Road User and e. Post-Crash. The mantra of
Safety System design is that people and drivers will make mistakes. The roads and vehicle designs are
forgiving in that mistakes on the roads are not penalized with deaths and/or serious injuries. While
safer road users in the form of education, outreach and enforcement of sensible traffic rules and
regulations such as wear seat belts, helmets, child restraints; not driving at excessive speeds, alcohol
and drugs impairment, mobile phone distractions; drivers’ training and licensing, etc are important,
safer roads and vehicles pillars continue to be the major focus for enhancing road safety.
6.2 Retroreflective Traffic Signs
6.2.1 Ambient Light
The night-time visibility of signs depends on the surrounding visual environment. This complexity may
be generated by street lighting, lighting sources from commercial buildings, advertisement billboards,
oncoming vehicles headlight and other vehicle taillights. In general, urban motorways with the high
traffic volumes and density are more visually complex than rural highways with the vehicles traveling
faster and further apart and the surrounding is pitch black. Therefore, rural driving requires less
1
https://www.who.int/roadsafety/ministerial_conference/en/
2
https://www.who.int/roadsafety/decade_of_action/en/
3
https://www.who.int/violence_injury_prevention/road_safety_status/2018/en/
4
S. McIlvenny, Road Traffic Accidents - A Challenging Epidemic,
https://www.ncbi.nlm.nih.gov/pmc/articles/PMC3074911/
5
https://undocs.org/en/A/RES/74/299
14cognitive demand6. For urban driving, which is where the majority of the traffic in Australia is, bright
retroreflective sheeting used in signing applications has the potential to improve sign conspicuity in
cluttered visual environments – city centres and suburban shopping districts7. Some studies have
reported that driver luminance needs to double for drivers to correctly read signs because of the
additional glare sources during legibility testing8,9.
In this regard, AS/NZS 1906.1 Class 1100 retroreflective signs which are more than double the
luminance performance of the closest Class 400 signs should be regulated as the minimum requirement
for urban motorways, downtown shopping districts, city centres, etc. This recommendation is line with
the guidelines published by NCHRP Report 828, where ASTM Type XI or Class 1100 signs are proposed
for Level 4 visual complexity overhead signs10. Germany has a similar EN 12899-1 Class 3B sign mandate
for bright areas, i.e., urban roads and autobahns11.
6.2.2 Sign Position
Overhead or gantry mounted signs are much preferred by drivers because the messages for drivers in
each lane can be setup and there is no foliage or other large and tall vehicle obscuration unlike shoulder
mounted signs. Vehicle headlights however are designed to provide “seeing light” which is directed
towards the road surface and a small amount of “glare light” that is directed towards traffic signs. It is
well established that 6.5-meter-tall overhead mounted signs do not receive even 20% of the
illumination of 2.5-meter-tall shoulder mounted signs for a sedan car headlight positioned at 600 feet
(183 m) from the signs. As a result, while overhead signs are not obstructed by vegetation and there is
one message for each lane, they can be a lot darker than shoulder mounted signs for the same grade of
retroreflective sheeting.
In the Figure 1, the luminance (brightness) is calculated for a passenger car approaching a Gantry /
Overhead (GO) sign and a Nearest Shoulder (NS – left hand shoulder for left most lane and right-hand
shoulder for right most lane) sign. The vehicle headlight distribution was pre-2011 US market-weighted
low beam headlighting patterns12. The coefficients of retroreflection on relevant types of sheeting were
measured using 3M reflective sheeting at all required approach distances and the luminance curves
were computed using these two sets of experimental data. As is evidenced from the luminance data,
Class 1100 signs (labelled as Type XI in the chart) are at least 50% higher Class 400 signs (labelled as
Type IV in the chart) within the critical legibility range of < 200 m. Class 400 overhead signs are quite
low in luminance and this is a case where Class 1100 will enhance the safety by increasing the visibility
by at least 50%. As a best practice reference, the BS EN 12899-1: 2007 calls for EN Class R3C-UK
(equivalent to ASTM Type XI and Class 1100) as the permitted retroreflective material for gantry signs
because vehicle headlamps provide only limited illuminations to overhead signs.
6
3 C. Arien, et al., “A simulator study on the impact of traffic calming measures in urban areas on driving behavior
and workload”, Accident Analysis and Prevention 61 (2013), 43-53
7
F. Schieber and C.H. Goodspeed, “Nighttime Conspicuity of Highway Signs as a Function of Sign Brightness,
Background Complexity and Age of Observer”, Proceedings of the Human Factors and Ergonomics Society 41st
Annual Meeting - 1997
8
A. J. Holick and P.J. Carlson, “Minimum Retroreflectivity levels for Blue and Brown Traffic Signs”, US Department
of Transportation, FHWA, FHWA-HRT-08-029
9
P. J. Carlson, "Performance Evaluation of Retroreflective Traffic Signs," Transportation Research Board 94 th
Meeting, 2015
10
Carlson, P. J., Brimley, B., Chrysler, S. T., Gibbons, R., Terry, T. “Recommended Guidelines for Nighttime Visibility
of Overhead Signs”, Transportation Research Record, NCHRP Report 828, Washington, DC, 2016.
11
Need a reference
12
B. Schoettle, “A Market-Weighted Description of Low-Beam Headlighting Patterns in The U.S.: 2004”, UMTRI-
2004-23 Report.
15For traffic signs posted on the opposite shoulder of two-lane undivided rural highways and shoulder
mounted signs in multi-lane divided highways, the large lateral sign to vehicle offset means the
entrance angle is made worse versus the nearest shoulder signs adjacent to traveling lane. In these far
shoulder signs, Class 1100 signs will improve the visibility of shoulder mounted signs with large lateral
offsets.
Figure 1: 3M calculated luminance curves for low beam headlight from a 2004 model sedan car
illuminating overhead and nearest shoulder signs.
6.2.3 Headlight Changes
Further the latest 2019 market-weighted sedan car and light truck low beam distribution conducted by
University of Michigan Transportation Research Institute (UMTRI) revealed that the traffic sign
illumination has dropped by as much as 20% versus the last such market-weighted headlight research in
2011 vehicle models13. The amount of illumination drop depends on left shoulder (US driving, far
shoulder; Australia driving, nearest shoulder), overhead or right shoulder (US driving, nearest shoulder;
Australia driving, far shoulder) sign locations. The traffic sign illumination over 650 to 250 feet (200 to
75 m) approach distances are given in Figure 2. Both LED and tungsten-halogen (TH) low beam
headlights were measured. What this means is brand new signs with 2019 cohort of vehicles in the US
(we expect Australia fleet to have a similar distribution) will appear less bright by as much as 20% for
any grade retroreflective sheeting. In the traffic sign industry, a 20% drop below the standards
threshold is an end of warranty situation. The calculated sign luminance for both 2019 and 2011 SUV
vehicle model headlights are given in Figure 3. From the chart, the driver would receive about 30 units
of luminance at about 400 feet (122 m) with 2011 TH low beam headlights illuminating a Class 400
(ASTM Type IV) sign. With 2019 TH, the luminance computed is 21 units (30% drop). The mitigation in
this case is to upgrade Class 400 signs to Class 1100 signs because this process brings about 50%~100%
brightness enhancement to compensate for the droop in new vehicle model headlight illumination. In
the example given, the 2019 TH low beam with Class 1100 returns about 40 units of luminance to the
13
3M Research Synopsis, “A Market-Weighted Description of Tungsten-Halogen
and LED Low-Beam Headlighting Patterns in the US”, https://multimedia.3m.com/mws/media/1775333O/low-
beam-headlight-study-summary.pdf
16SUV driver. That is almost twice as bright as Class 400 with 2019 TH low beam (21 units) and brighter
than Class 400 with 2011 TH low beam (30 units).
Figure 2: Illumination differences of low beam headlights from 2019 model vehicles versus 2011 model
vehicles.
Figure 3: 3M calculated luminance curves for low beam headlight from 2019 and 2011 model SUV
vehicles illuminating nearest shoulder signs.
6.2.4 Vehicle Type
We already know that statistics show heavy vehicles (large trucks) are involved in road traffic fatalities
and serious injuries at a rate much higher than its vehicle fleet composition. Part of that is the crash
momentum does not favour the occupants of smaller vehicles. The other physical factor is that truck
drivers are the disadvantaged viewers of traffic signs by their seating positions versus the truck
headlights. A standardized model for a truck driver seating is 1.4 m and a sedan car driver seating is
0.55m above their respective headlights. It follows that at about 100 m approach distance to the traffic
overhead sign, the observation angle for the truck driver is about 1.0 degree and the sedan car driver
0.3 degrees. The observation angle is the separation between the driver gaze towards the sight and the
headlight direction to the sign.
17The luminance curves 3M calculated with Class 1100 (ASTM Type XI) and Class 400 (ASTM Type IV) for
both the sedan and truck drivers approach an overhead sign is shown in Figure 4. At the optimal 100-m
distance to read the signs (legibility zone), Class 400 signs return about 2.8 units of luminance which is
hardly visible. In fact, the luminance won’t climb to about 9 units until the viewing distance is increased
to 200 m. Due to the human acuity limitation, sign letters at this distance are not readable unless they
are made very large letters. In comparison, a Class 1100 overhead sign presented to the truck driver
returns about 8 units of luminance at 100-m viewing distance. Truck drivers sit elevated versus sedan
vehicles. Their views of the overhead signs are not obstructed by small vehicles during the day.
However, when night falls, they rely on headlight illumination to read signs and it is this situation that
they are significantly disadvantaged by their large observation angles at close viewing distances of 150
to 50 m. Upgrading Class 400 overhead signs to Class 1100 gives the truck drivers twice as much light to
read the signs and therefore safer navigation. As a best practice reference, the BS EN 12899-1: 2007
calls for EN Class R3C-UK (equivalent to ASTM Type XI and Class 1100) to provide improved brightness
at night from overhead signs for drivers of heavy goods vehicles.
Figure 4: 3M calculated luminance curves for low beam headlight from a 2004 model sedan car and
truck illuminating overhead signs.
6.2.5 Speed of Travel
Speed is often being blamed as the cause of crash and casualties. High speed makes the vehicle harder
to control and any crash more severe. With respect to traffic sign specification, speed is a factor on
preview distance. For example, traveling at the rural highway speed limit in Australia, which is typically
100 km/h in most states, the vehicle would have travelled 28 m every second. Garvey et al 14.
recommended four (4) seconds of sign reading for 1-3 words of guide sign messages at 110 km/h speed.
Reviewing the chart in Figure 2, the optimal legibility distance is 50 m or greater. Hence the driver
needs to be able to read the sign letters starting from 162 m to the sign. There is a concept call
Legibility Index (LI), which is the ratio of viewing distance to the letter height. The US MUTCD manual
recommends an LI of 30, which means 30 feet of viewing distance for 1” letter height (360:1 ratio). In
the above example, the capital letter height would be about 450 mm. In Australia practice, AS 1743
14
P.M. Garvey et al., “Highway Sign Visibility”, Chapter 7 in Automobile Transportation—Traffic, Streets, and
Highways, 2011 McGraw-Hill Education, ISBN 9780071614771.
18calls for 200 mm and 250 mm capital letter heights for rural and urban roads, at 100 km/h speed for
Series E letters. These letter sizes work out to be 60 and 50 LI. It is generally understood that 60 LI is
setup for 20/20 visual acuity drivers. For drivers with 20/40 visual acuity, a 30 LI is required15.
Not only the letter sizes can be enhanced to provide higher visibility to the motorists traveling at high
speed, but the need also to provision for 5-6 seconds of legibility distance14 for 4-8 guide sign words
means the traffic signs must be brighter and is legible from longer distances, perhaps towards 200-250
m distances16. This is an area where Class 1100 traffic signs have that 50% higher luminance advantage
over Class 400 signs whatever the vehicle type or the sign location. Vietnam TCVN 7887-2018 and India
IRC 67-2020 are amongst the recent standard specification upgrades that permit only ASTM Type XI
signs to be used for high-speed roads such as expressways with design speeds above 80 km/h.
6.2.6 Age of the Driver
Older drivers are disadvantaged in that they need several times more light to read and understand the
same traffic sign vs. younger drivers and he requires more reaction time to respond to the driving cues.
Research by National Highway Safety Administration (NHTSA) shows that driver fatality rates per 100
million vehicle miles travelled is two times or more for 65-years and older drivers vs. the safest drivers
of the lot at around 40-55 years old (Figure 5). Australia could be facing similar aging trends as US and
West Europe advanced societies if immigration slows.
In a legibility study conducted by Operator Performance Laboratory17, it was reported that the
information acquisition time of senior drivers (all participants were 55 years of age or older) ranged
from 1 to 2.5 seconds on average for 3.2 to 80 cd/m^2 luminance. The legibility index (LI) used for this
sub-group was 40 and the information acquisition accuracy was 50%. If a higher accuracy at 84% was
required, the same LI of 40 returned between 1.5 to 5 seconds of information acquisition time. The
hypothesis that increasing the letter size will improve the information accuracy was tested with an LI of
33. The letters were increased by 21% to change LI of 40 to 33. In the results reported, the 84-
percentile accuracy with LI of 33 was on par with 50-percentile accuracy with LI if 40. Clearly, senior
drivers could be helped to make fewer mistakes if the letter sizes were at least 33 feet viewing for one
inch height. The same study also found that higher luminance improves the information acquisition –
3.2 cd/m^2 was the minimum18, 20 units would be a lot better and 80 units which can be supplied by
ASTM Type XI nearest shoulder sign at about 100 m approach distance for a sedan driver is optimal19.
The age dependency on the legibility distance was reported by Griffith 20. It was found that older drivers
above 65 years of age came to about half the legibility distance for the same sign letter heights when
compared to younger drivers below 40 years of age. The author compared street name, regulatory,
warning and guide signs and the finding was applicable in all four sign types. With such industry study
evidence and demographic changes in Australia, the committee will do the nation a great service to
15
H. G. Hawkins, et al., “Legibility comparison of three freeway guide sign alphabets”, FHWA/TX-99/21276-1F
Report, 1999, https://static.tti.tamu.edu/tti.tamu.edu/documents/1276-1F.pdf
16
M.S. Griffith et al., “Entrance Angle Requirements for Retroreflectorized Traffic Sign,” Transportation Research
Record 1421, pp. 53-60.
17
T. Schnell, et al., “The Effect of Luminance and Text Size on Information Acquisition Time from Traffic Signs”,
Transportation Research Record No: 2122, pp. 52-62, 2009
18
M. R. Russell, et al., Characteristics and Needs for Overhead Guide Sign Illumination from Vehicular Headlamps,
Dept of Civil Engineering, Kansas State University. 1999, FHWA Office of Safety and Traffic Operations Research
and Development, FHWA-RD-98-135.
19
T. Schnell, et al., Traffic Sign Luminance Requirements of Nighttime Drivers for Symbolic Signs. Transportation
Research Record No. 1862: Journal of the Transportation Research Board, 2004: p. 24-35, 2004.
20
M.S. Griffith et al., “Entrance Angle Requirements for Retroreflectorized Traffic Sign,” Transportation Research
Record 1421, pp. 53-60.
19prepare the road safety industry to set standards that are ready for the aging driver population. Taking
the needs of the disadvantaged drivers as the primary road safety management goal will ensure this
driver group is not disproportionally represented in road crash statistics.
Figure 5: US road traffic fatality rates by male and female drivers per NHTSA study 2000.
6.2.7 Fluorescent Signs
As we have outlined above, reading traffic signs in high visual complexity environment can be helped by
selecting higher tier sheeting to provide the needed contrast vs. the cluttered background. Similarly, in
the hours of dawn and dusk when the sun light illumination is low and the environment is not fully dark,
traffic sign visibility is compromised by the transition between diffuse reflection with low sun light
illumination and retroreflection with high ambient background. In this situation, fluorescence in the
traffic sign helps to convert the short wavelength sun light illumination into visible light that the drivers
can see. It has been reported fluorescent yellow/green coloured signage can be up to 3 times more
visible and up to 10 times more recognizable21.
Fluorescent signs improve “daytime” legibility of traffic signs 22 and enhances safer driver behaviour
compared to standard coloured signs when used appropriately 23. It is therefore a global best practice
that fluorescent yellow signs replace standard yellow signs in critical warning situations; fluorescent
yellow green signs replace standard yellow signs for dealing with vulnerable road users such as
pedestrians, cyclists, and motorcyclists; fluorescent orange signs replace standard orange signs for work
zone applications. The use of fluorescent colours, apart from higher day time brightness, promotes an
21
D.M. Burns, et al., “Visibility of Durable Fluorescent Materials for Signing Applications”, COLOR Research and
Application, Volume 20, Number 2, April 1995
22
T. Schnell, et al., “Legibility Distances of Fluorescent Traffic Signs and Their Normal Color Counterparts”,
Transportation Research Record, No: 1754, pp. 31-41, 2001.
23
K.A. Eccles, et al., “Safety Effects of Fluorescent Yellow Warning Signs at Hazardous Sites in Daylight”, TRB
Annual Conference. 2001. Washington, D.C.
20automatic visual attention due to the attractive, uncommon colours24. Work zone signs are especially
critical because the routing and channelization can change by the week, day or even hours. The use of
fluorescent orange work zone colour positively affects the driver behaviour, inducing them to take
timely and proper actions to the work zone messages25.
Therefore, we urge the committee to expand the use of fluorescent signages in all cases of dealing with
critical locations such as blackspots, vulnerable road users and work zones.
In a 2013 Albuquerque, New Mexico, US road safety study 26, the treatment area where the signages
were upgraded to ASTM Type XI saw night-time crashes reduced by 30% vs the control section one year
after mitigation was put in place. In the 2005 study by Ripley iii, it was reported that the benefits of
upgrading traffic sign was 22 times the investment, compared to around seven times returns for
erecting new median barriers or upgrading guardrails.
6.3 Wet Reflective Pavement Markings
Australia has unique challenges with respect to maintaining its vast road networks across a large
country. It has about the same land mass (7.7 million sq. km) as contiguous US. Yet it has about 12.5
times less population than contiguous US (26 million vs. 328 million). As a result, Australian population
is concentrated in several capital cities and the populations outside of the big cities are small. Roads
connecting capital cities and other large cities run through long rural distances. Australia has a reported
paved road network of about 385k km (44% total roads) vs the US which has about 4.6 million km of
paved roads 27 (coincidentally about 12X longer than Australia, similar to the population ratio).
Non-paved roads are the majority of roads in rural Australia, there is no pavement marking to speak
about. The majority of the paved roads are undivided 2-lane roads28 (about 370k km), also divided
highways (about 8,500 km, typically 4 lanes) and motorways (about 2,900 km, typically 4 to 6 lanes).
Bureau of Infrastructure, Transport and Regional Economics (BITRE) also uses a metric called “Value
Equivalent” lane kilometre (lane-km) to rank the nation’s road network. This metric is a reflection of the
amount of capital investment, land cost that has been put into these roads and the economic values to
the road users. On that basis, paved roads constitute 96% of all lane kms in Australia. The paved
undivided roads make up about 50%, followed by motorways 27%, tunnels 12% and divided highways
and urban roads 7%. Improvements on High Trafficked Roads
6.3.1 Improvements on High Trafficked Roads
High trafficked roads carry the majority of Australia traffic and they include motorways, divided
highways, rural undivided highways connecting cities that are far apart, urban roads, etc. They typically
carry more than 2,000 annual averaged daily traffic (AADT) per lane but may be as high as 20,000 per
lane AADT for the busiest metropolitan motorways. Of the approximately 790k lane-km, we can assume
this group has 20% or 160k lane-km and the rest of paved roads 80% or 630k lane-km carry low volume
traffic.
24
Schieber, et al., “Fluorescent Colored Stimuli Automatically Attract Visual Attention: An Eye Movement Study”,
Heimstra Human Factors Laboratories, University of South Dakota, Vermillion, SD, 2006
25
Hummer, et al., “Driver Performance Comparison of Fluorescent Orange to Standard Orange Work Zone Traffic
Signs”, Transportation Research Record, No: 1657, pp. 55-62, 1999.
26
B. Brimley, “Safety Effects of Traffic Sign Upgrades in Albuquerque, New Mexico”. Transportation Research
Board 96th Annual Meeting, Washington, DC, January 8-12. Washington, DC: Transportation Research Board
27
International Road Federation (IRF) World Road Statistics 20120. https://worldroadstatistics.org/
28
Bureau of Infrastructure, Transport and Regional Economics publication ID INFRA 3317, “Growth in the
Australian Road System”, Aug 2017, https://www.bitre.gov.au/sites/default/files/is_092.pdf.
21You can also read