Patterns of livestock transport in the EU and to third countries - IN-DEPTH ANALYSIS
←
→
Page content transcription
If your browser does not render page correctly, please read the page content below
IN-DEPTH ANALYSIS
Requested by the ANIT Committee
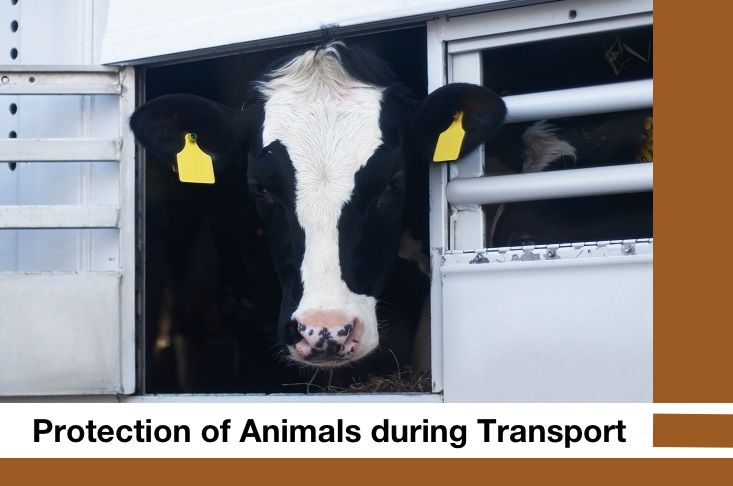
Patterns of livestock
transport in the EU
and to third countries
Policy Department for Structural and Cohesion Policies
Directorate-General for Internal Policies
PE 690.883 - June 2021 EN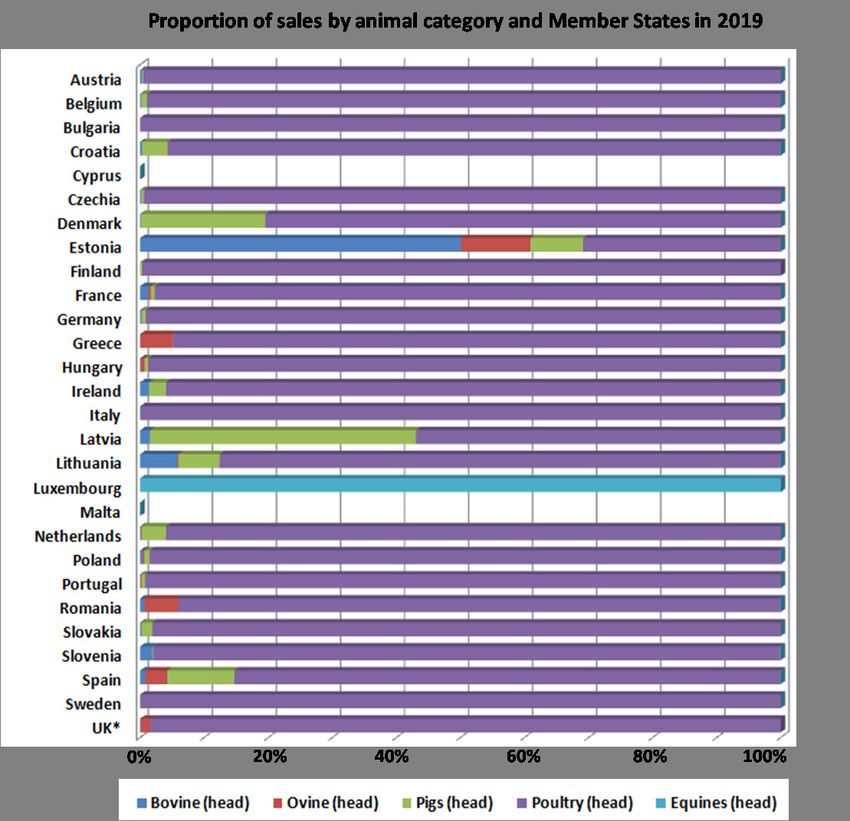
RESEARCH FOR ANIT COMMITTEE

 Patterns of livestock
  transport in the EU
and to third countries

 Abstract
 This in-depth analysis was commissioned by the European
 Parliament’s Committee of Inquiry on the Protection of Animals
 during Transport (ANIT). The paper provides an analysis of the
 main drivers and key features of livestock transport within the EU
 and to third countries.
This document was requested by the European Parliament's Committee of Inquiry on the Protection of
Animals during Transport (ANIT).

AUTHORS

Research administrator: Albert MASSOT, François NEGRE, Claudia VINCI and Thaya DINKEL (trainee)
Project, publication and communication assistance: Adrienn BORKA, Kinga OSTAŃSKA
Policy Department for Structural and Cohesion Policies, European Parliament

LINGUISTIC VERSIONS

Original: EN

ABOUT THE PUBLISHER

To contact the Policy Department or to subscribe to updates on our work for the ANIT Committee
please write to: Poldep-cohesion@ep.europa.eu

Manuscript completed in June 2021
© European Union, 2021

This document is available on the internet in summary with option to download the full text at:
https://bit.ly/3qQAlvU

This document is available on the internet at:
http://www.europarl.europa.eu/thinktank/en/document.html?reference=IPOL_IDA(2021)690883

Further information on research for ANIT by the Policy Department is available at:
https://research4committees.blog/anit/
Follow us on Twitter: @PolicyAGRI

Please use the following reference to cite this study:
Massot, A. et al. 2021, Research for ANIT Committee – Patterns of livestock transport in the EU and to
third countries, European Parliament, Policy Department for Structural and Cohesion Policies, Brussels
Please use the following reference for in-text citations:
Massot et al. (2021)

DISCLAIMER

The opinions expressed in this document are the sole responsibility of the authors and do not
necessarily represent the official position of the European Parliament.

Reproduction and translation for non-commercial purposes are authorized, provided the source is
acknowledged and the publisher is given prior notice and sent a copy.
© Cover image used under the licence from Adobe Stock
Patterns of livestock transport in the EU and to third countries

CONTENTS

LIST OF ABBREVIATIONS                                                                                     4
LIST OF FIGURES                                                                                           5
LIST OF TABLES                                                                                            5
1.   INTRODUCTION                                                                                         6
2.   DRIVERS OF LIVESTOCK TRANSPORT IN THE EU AND THIRD COUNTRIES                                         9
     2.1. Regulatory framework                                                                            9
     2.2. Free trade of goods                                                                            10
     2.3. Localisation and production factors                                                            11
     2.4. Evolution of slaughterhouses                                                                   11
     2.5. Market dynamics                                                                                13
     2.6. Environmental and health constraints                                                           15
     2.7. Specific local patterns                                                                        17
3.   LIVESTOCK TRANSPORT IN THE EU AND TO THIRD COUNTRIES: KEY FEATURES                                 18
     3.1. Intra-EU trade                                                                                 19
           3.1.1. Number of consignments                                                                 21
           3.1.2. Main trading countries                                                                 23
           3.1.3. Duration of journeys                                                                   23
           3.1.4. Trade Value                                                                            24
           3.1.5. Reasons for transport                                                                  24
     3.2. Extra-EU trade                                                                                 25
           3.2.1. Number of consignments                                                                 25
           3.2.2. Main trade partners                                                                    26
           3.2.3. Duration of journeys                                                                   27
           3.2.4. Trade Value                                                                            27
           3.2.5. Reasons for transport                                                                  28
           3.2.6. Travel routes                                                                          29
REFERENCES                                                                                              30

                                                 3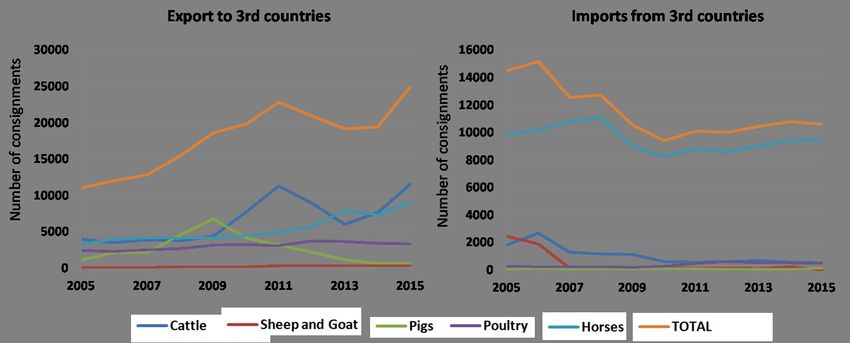
IPOL | Policy Department for Structural and Cohesion Policies

LIST OF ABBREVIATIONS

 AGRI              Committee on Agriculture and Rural Development

 ANIT              Committee of Inquiry on the Protection of Animals during Transport

 CAP               Common Agricultural Policy

 DG-SANTE          Commission's Directorate-General for Health and Food Safety

 EFA               Eurogroup for animals

 EPRS              European Parliamentary Research Service

 EU                European Union

 F2F               Farm to Fork

 GHG               Greenhouse Gas

 IEEP              Institute for European Environmental Policy

 MS                Member State

 TRACES            TRAde Control and Expert System

 UK                United Kingdom

 US                United States of America

                                                       4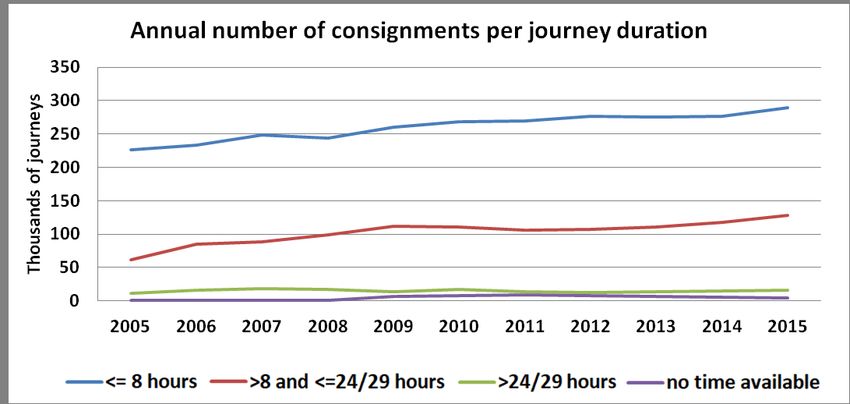
Patterns of livestock transport in the EU and to third countries
LIST OF FIGURES
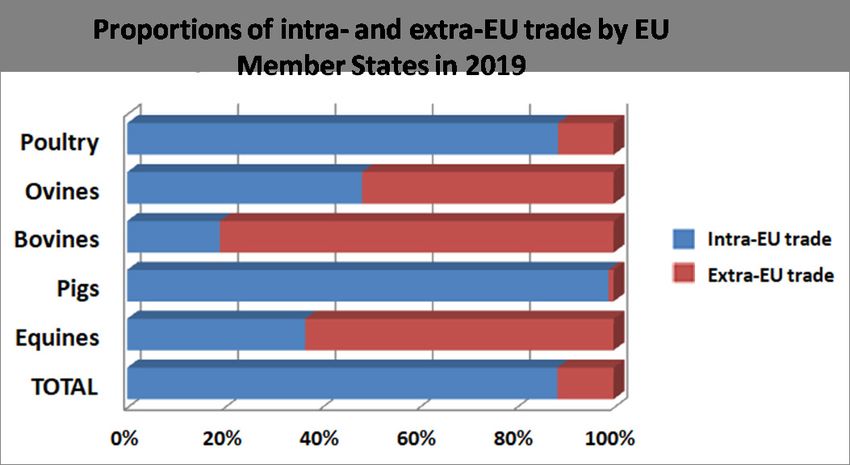
Figure 1: Proportion of intra and extra-EU trade of livestock during 2019 7
Figure 2: Proportion of animal category sales from Member States in 2019 20
Figure 3: Proportion of animal categories sold by one Member State to the rest of EU MSs in 2019 21
Figure 4: Number of transported animals (in millions) and number of consignments for the intra-EU
trade in 2005, 2009 and 2015 22
Figure 5: Annual number of consignments per journey of duration for intra-EU trade from 2005 until
2015 24
Figure 6: Number of consignments for EU imports and exports between 2005 and 2015 26
Figure 7: Value of the EU27* exports from 2011 to 2020 for all animal categories 28
Figure 8: Value of the EU27* imports from 2011 to 2020 for all animal categories 28
Figure 9: Main transport routes for extra-EU live animal transport 29
LIST OF TABLES
Table 1: Top EU companies of slaughterhouses for swine and their activity in 2016 12
Table 2: Per capita consumption (kg/capita/year) of meat and trends by regions 14
Table 3: Number of transported animals (in millions), number of consignments within the EU and
mean number of animals transported per consignment for 2005, 2009 and 2015 22
Table 4: Top intra-EU traders of live animals in 2019 (total of intra-EU trade) in million head of animals
23
Table 5: Top receiving countries for EU exports of live animals in 2019 in thousands of animal heads
27
5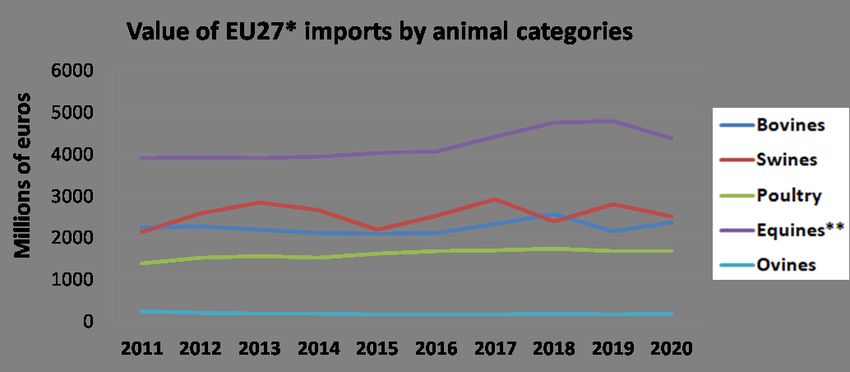
IPOL | Policy Department for Structural and Cohesion Policies

1.         INTRODUCTION

                                               KEY FINDINGS
       •   Every year, millions of livestock is transported within and outside of the European Union
           for trade purposes.
       •   Trade reasons can be various, among those: breeding, fattening and slaughtering.
       •   Intra-EU trade of livestock represents 85% of transports, while 15% of transport is headed
           to extra-EU destinations.
       •   In 2019, about 1.4 billion bovines, swine, poultry, ovine, caprine and equines were traded
           across the EU Member States.
       •   Poultry is the most traded farm animal in Europe. 98% of intra-EU trade and 97% of extra-
           EU trade (as expressed in numbers of animals transported) are represented by this
           species.

Every year, millions of live animals are transported within and outside of the European Union (EU) for
trade purposes (EPRS, 2020). Animals can be traded for diverse reasons such as essential domestic
transport (transport from the farm to a slaughterhouse, or transport of cattle-fattening farms),
breeding, relocation of companion animals or trade of laboratory animals.
Council Regulation (EC) No 1/2005 of 22 December 2004 on the protection of animals during transport
and related operations (“Transport Regulation”) is the current EU legislative framework to ensure the
welfare during movement of live animals. It aims at avoiding injury or undue suffering to animals
during transport, setting minimum requirements for fitness for transport, loading densities, journey
and resting times, availability of water and feed, transport organisation and driver requirements. It
applies to all live vertebrate animals transported in connection with an economic activity within the
European Union, as well as to all consignments entering or leaving the customs territory of the
Community (EPRS, 2018). However, the regulation does not apply to the transport of animals not in
connection with an economic activity or to the transport to or from a veterinary practice or clinics,
under the advice of a veterinarian (Article 1.5.of Regulation (EC) 1/2005). Moreover, there is a
derogation for the transport of registered equines and their transport for non-commercial purposes
such as competition, races, cultural events or breeding (Eurogroup for animals (EFA), 2021). Data on
the transport of traded animals are not always available as the Transport Regulation (Council
Regulation (EC) 1/2005) does not require Member States (MSs) to collect and report them in a
harmonised way (EFA, 2021).
This in-depth analysis will focus on drivers of livestock transports within the EU and trade with third
countries. Livestock includes bovines, swine, poultry, ovine, caprine and equines. Data will either refer
to the entire animal category (e.g. ovines) or is else specified by the concrete age group or species (e.g.
sheep or goats).
In 2019, about 1.4 billion bovines, swine, poultry, ovine and caprine and equines were traded across EU
Member States. Extra-EU trade amounted to roughly 230 million animals of the same species. Poultry
is the most traded farm animal species representing about 97 % of the intra-EU trade and 98 % of extra-
EU trade (as expressed in numbers of animals transported) (EFA, 2021). Intra-EU trade represented 85
% of the farmed animal transport (including equines) in 2019 with the remaining 15 % corresponding

                                                       6
Patterns of livestock transport in the EU and to third countries
to extra-EU trade (Figure 1). The intra-EU transport of poultry, ovine, caprine and swine was higher
than the extra-EU transports, while bovines and equines trade to extra-EU countries dominated their
intra-EU trade (EFA, 2021).
Figure 1: Proportion of intra and extra-EU trade of livestock during 2019
Data from Eurogroup for animals, 2021. Graphic authors’ elaboration.
Livestock transport is a major animal welfare concern. Animals are exposed to the stress of loading and
unloading, hunger, thirst, exhaustion, and lack of space and rest during transit (EFA, 2021).
Furthermore, in case of sea transport, the inadequacy of more than half of the operating vessels can
pose a serious welfare risk (Boada-Saña et al., 2021). There is a lack of regular feedback from third
countries on the conditions of the animals during transport and at arrival (DG SANTE 2019-6835).
The presence of veterinarians cannot always be guaranteed at the farm or at the point of loading.
Farmers, drivers and inspectors experience difficulties in recognising the unfitness of livestock to be
transported (EPRS, 2018).
While the Transport Regulation seeks to overcome these issues, there are a number of problems that
remain to be solved, such as: the long-distance transports of unweaned calves, the need to ascertain
the state of pregnancy, the extent to which the journey logs are checked, the relationship between
infringements, enforcement and penalities, the ‘mixed’ impact of training, education and certification,
border control and so on (EPRS, 2018).
The European Parliament ( 1), the European Court of Auditors ( 2) as well as many academic analysis and
NGO reports have noted that, despite the adoption and entry into force of Council Regulation (EC) Nº
1/2005 on the protection of animals during transport( 3), the degree of progress in the implementation
of many of its provisions by Member States has been insufficient to meet the regulation’s objectives.
As a result, weaknesses still persist in certain areas related to welfare issues during transport.
1
European Resolution of 14 February 2019 on the implementation of Council Regulation (EC) Nº 1/2005 on the protection of animals
during transport within and outside the EU; European Implementation Assessment on the Regulation (EC) Nº 1/2005 on the protection
of animals during transport and related operations, European Parliamentary Research Service (EPRS), October 2018.
2 European Court of Auditors, Special report Nº 31/2018 - Animal welfare in the EU: closing the gap between ambitious goals and practical
implementation, 14 November 2018.
3
Council Regulation (EC) Nº 1/2005 of 22 December 2004 on the protection of animals during transport and related operations
(consolidated text).
7IPOL | Policy Department for Structural and Cohesion Policies
In this context, the European Parliament decided to set up the Committee of Inquiry on the Protection
of Animals during Transport (“ANIT Committee”) on 19 June 2020 to investigate alleged violations in
the application of EU law on the protection of animals during transport and related operations within
and outside the EU, including by air, road, rail and sea. The work of the ANIT Committee is focused on
how EU rules are being implemented by Member States and whether the EU Commission is enforcing
them properly ( 4).
This research project is meant to provide the ANIT Committee Members with an overview of the main
characteristics of animal transport in the EU and to third countries.
While the hearings and workshops organised by the ANIT Committee covered specific aspects of the
transport of live animals within and outside the EU, this overview of the patterns of transport in the EU
and to third countries will complete the sectoral or topical approach to provide input to the
Committee’s final report. In doing so, this in-depth analysis will, whenever possible, build on the
research already delivered to the ANIT Committee ( 5).
4 ANIT Committee Web page
5 for the transport to third countries see the conclusions of the ANIT Hearing on ‘The transport of live animals to third countries’
https://www.europarl.europa.eu/RegData/etudes/STUD/2021/690877/IPOL_STU(2021)690877_EN.pdf organised on 1 March 2021 and the
workshop on ‘The practices of animal welfare during transport in third countries: an overview’
https://www.europarl.europa.eu/RegData/etudes/STUD/2021/690877/IPOL_STU(2021)690877_EN.pdf held on 25 May 2021.
8Patterns of livestock transport in the EU and to third countries
2. DRIVERS OF LIVESTOCK TRANSPORT IN THE EU AND THIRD
COUNTRIES
KEY FINDINGS
• There are several drivers that affect the transport of livestock within the EU as well as to
third countries.
• The EU’s regulatory framework has influenced transport patterns in the past and will
continue to do so in the future. The Farm to Fork strategy, new welfare requirements and
the new Common Agriculture Policy will shape the transport patterns and conditions in
the following years.
• The decreasing number of slaughterhouses in Europe in the past four decades has led
to a centralization of livestock slaughter in fewer larger abattoirs; thus increasing the
distance that livestock has to travel.
• The free trade gives farmers more negotiation flexibility taking advantage of cost
variations in different countries. This provides an incentive for the transport of livestock
to increase cost-benefits.
• Specific local patterns are another driver for transports of livestock to the Middle East
and North Africa.
• Meat consumption trends have been changing in the EU and the world, affecting the
production and the destination of livestock.
• Environmental and health constraints related to livestock production are more
prominent than before and have to be considered in the future: greenhouse gas
emissions, water shortage and the impact of animal diseases will affect the conditions of
livestock transport in the coming years.
2.1. Regulatory framework
Livestock transport has seen many changes in the past years. The regulatory framework of the EU
played a decisive role in this. This section lists some of the key elements that have affected and will
affect trends and patterns in livestock transport, namely:
• Hygiene package - Regulation (EC) No 853/2004 of the European Parliament and of the
Council of 29 April 2004 laying down specific hygiene rules for food of animal origin. - has
strongly affected the evolution of slaughterhouses in Europe (See section 2.2. Evolution of
slaughterhouses).
• Increase in free trade between MSs allowed for easier cross-border movement of animals, thus
affecting livestock transport (See section 2.3. Free trade of goods).
• Farm to Fork (F2F) strategy - for fair, healthy and environmentally friendly food systems - is
at the heart of the European Green Deal. This strategy will aim to accelerate the transition to a
sustainable food system where animal welfare will play a major role. The F2F strategy will have
effects on the future regulation of the Common Agricultural Policy (CAP). Transport of livestock
will also be considered (See section 2.6.2. Farm to Fork Strategy).
9IPOL | Policy Department for Structural and Cohesion Policies
• Council Regulation (EC) No 1/2005 came into force on 25 January 2005 and is aimed at
protecting the welfare of animals during transportation. It lays down common rules for the
transport of live vertebrate animals in connection with an economic activity within the EU, as
well as all consignments entering or leaving the customs territory of the Community. This
regulation covers general conditions for the transport of animals, specific requirements for
transporters, keepers and assembly centres, obligations for competent authorities and
enforcement measures and exchange of information, among others.
• New animal welfare requirements - While Council Regulation (EC) No 1/2005 aims at
protecting the welfare of animals during transport, there are still concerns about an inadequate
application. Long-distance transports of unweaned calves, the need to ascertain the state of
pregnancy of live animals, the extent to which the journey logs are checked, the infringement-
enforcement-penalty relationship, the ‘mixed’ impact of training, education and certification,
border controls etc. are some of the topics that still require improvements and solutions (EPRS,
2018). Progress in the application of welfare requirements will strongly affect livestock
transport dynamics in the following years, thus affecting the transport trends within the EU and
to third countries.
2.2. Free trade of goods
The free trade of goods in Europe, and the growing fragmentation and specialization of the farming
system enables food producers to take advantage of the cost variations between different countries.
Certain costs can be cut, due to different comparative advantages. For instance, variations in access
and costs of raw materials (e.g. feed) and in labour costs can strongly affect the trade between
countries. It can therefore be profitable to breed an animal in Country A, fatten it in country B, and then
slaughter it in Country C. The possibility to transport livestock between MSs therefore gives farmers
more negotiation possibilities. The related reduction in production costs must not be overstated
however, as even moderate tariff variations could prevent or at least reduce trade (Mann et al.,2018).
An example of this can be observed in the transport of piglets from Denmark to Poland: while
production of piglets is cheaper in Denmark, rearing is cheaper in Poland. The result is that five million
piglets were sold and transported from Denmark to Poland in 2018( 6).
As the EU single market allows producers to export live animals and meat, there are ongoing debates
on why animals should be transported alive rather than being traded as meat/carcasses.
Regarding the sustainability of meat transportation as compared to live animal transportation, studies
by Baltussen et al (2009 and 2017) have estimated the advantages and disadvantages of long-distance
transport of live animals for slaughter, compared to local slaughter followed by transport of meat, using
a series of economic and sustainability indicators (transport costs, slaughter costs, animal welfare,
environmental impact (CO2 emissions NOx emissions), employment and other social effects). They
concluded that:
• The intra-EU transport of 67 thousand horses required 3 thousand consignments in 2007.
The trips lasted on average a week. Slaughtering horses in the production area and transport
them as meat would decrease the number of consignment to 1 400. Consignments with meat
are faster as no resting times for live animals are necessary. Diesel costs were calculated to be
reduced by 48% considering that the transport of meat requires fewer consignments but does
need investments in refrigeration. Baltrussen et al. (2009) concluded that a ban in horse
transport would therefore benefit an animal’s welfare, and reduce the CO2 emission by almost
half.
6 https://www.theguardian.com/environment/2020/jan/24/something-is-wrong-meps-say-eu-is-failing-to-regulate-live-animal-exports
10Patterns of livestock transport in the EU and to third countries
• Intra-EU transport of swine in 2007 was about 22 million animals. Germany was the main
buyer for swine in 2007 (Baltrussen et al., 2009) and is still nowadays (EPRS, 2020). The ban or a
reduction in live pig transport would change employment within Europe, affecting drivers as
well as slaughterhouse employees. While drivers’ numbers would actually be reduced, the
slaughterhouse employment would change location but not necessarily decrease.
Consignments would be reduced, meaning less use of fuel and lower emissions of CO2. The
scenario for a complete live pig transport ban in 2007 would cause a 40% reduction of CO2
emissions and total transport costs could be reduced by 29 %. Less transport of adult pigs and
piglets within Europe would therefore lower the risk of welfare problems, decrease the
emissions of CO2 and the transport costs. Transporting meat instead of adult pigs and piglets
would therefore be more sustainable when looking at those parameters. There would
nevertheless be huge structural effects in the regional production and slaughter of swine
within Europe (Baltrussen et al., 2009).
• Long distance transport of hens from the Netherlands to slaughter in Poland is not
sustainable from an animal welfare, animal health and environmental perspective, with an
increasing risk of bruises, broken bones, stress, death on arrival, as well as higher CO2 and NOx
emissions. From a cost perspective, higher prices in the Netherlands create a difference of EUR
0.52 per kilogram of meat. (Baltussen et al., 2017).
• Long-distance transports of lambs from Hungary to Italy is not sustainable at all. All costs
are higher, animal welfare is worse, the risk of spread of animal diseases and the environmental
impact is higher. It would therefore be preferable to slaughter lambs in Hungary and avoid live
transport (Baltussen et al., 2017).
2.3. Localisation and production factors
The regional production of meat in the EU is not equal to regional consumption. This is one of the
underlying drivers for intra-community trade of meat and live animals between MSs (Baltussen et al.,
2017). Therefore, the majority of the European livestock experiences transport during their life for
several reasons that can vary from domestic transport to breeding or other reasons. While 70% of cattle
and pigs were transported for production, in the EU, in 2019, sheep and goats were predominantly
transported for slaughter (EPRS, 2020).
2.4. Evolution of slaughterhouses
Number of slaughterhouses
It is accepted by stakeholders in the food chain that slaughterhouse location has a major impact on the
transport of live animals: as a consequence of the decrease in slaughterhouses, animals have to endure
longer journeys, facing possible welfare concerns (EFA, 2019).
The number of slaughterhouses in Europe has been decreasing in the past decades, due to a
concentration of slaughtering activity in larger abattoirs (EFA, 2019). In 2002, there were 3 890 large-
scale slaughterhouses in the EU, which decreased to 2 863 in 2007 (Carlsson et al., 2007). This
decreasing trend has been continuous over the last four decades, but has been accelerated since the
entry into force of the EU Hygiene Package in January 2006 (Regulation (EC) No 853/2004). This
package established a stricter rule of hygiene requirements with the consequence that many small
slaughterhouses struggled to fulfil them, while maintaining an economically profitable activity (EFA.
2019). On the other hand, it is easier for larger slaughterhouses to meet the hygiene regulations, but
11IPOL | Policy Department for Structural and Cohesion Policies
they also need a higher number of animals to operate in full capacity. As a consequence, a higher
number of animals has to be transported from farther locations to meet the slaughterhouse demand.
At EU level, a few groups control some of the largest slaughterhouses on an industrial scale. In 2014,
the ten biggest abattoirs in the EU slaughtered more than 44 million swine a year: this represented for
instance around 17 % of the European total of pig slaughter (Table 1).
Table 1: Top EU companies of slaughterhouses for swine and their activity in 2016
Activity in 2014
Companies (origin)
(millions of slaughtered swine)
Danish Crown (DK) 21.7
Tönnies (DE) 17.2
Vion (NL) 15.8
Westfleisch (DE) 7.7
Pini (IT) 6.1
Cooperl (FR) 4.9
Bigard-Socopa (FR) 4.6
Vall Companys (ES) 4.4
Belgian Pork Group (BE) 4.2
Batallé-Juià (ES) 3.9
Source: May 2016 / IFIP / France. https://www.ifip.asso.fr/fr
Mobile slaughterhouses
While mobile slaughterhouses ( 7), which reduce welfare issues that livestock may face during transport,
can be seen as an alternative, industry figures suggest that the costs involved would be too high.
Carlsson et al., studied consumers’ willingness to pay more for meat coming from mobile
slaughterhouses that therefore reduce live animal transport times. According to the 2016
Eurobarometer on the Attitudes of Europeans towards Animal Welfare, Europeans were asked whether
they would be willing to pay more for products sourced from animal welfare-friendly production
systems and if so, to what extent. Overall, 59 % of EU citizens mentioned they would be prepared to
pay more. More specifically, more than a third (35 %) are prepared to pay up to 5 % more and more
than one in ten (16 %) are prepared to pay 6 % to 10 % more for products sourced from animal welfare-
friendly production systems. Very small percentages of Europeans are ready to pay 11 % - 20 % more
(5 %) or more than 20 % (3 % of respondents). However, more than a third of EU citizens (35 %) are not
ready to pay more and a small percentage mentioned spontaneously (4 %) that it depended on the
price of the product (DG for Health and Food Safety, 2016).
7 EU legislation allows mobile slaughter of all kinds of domestic animals (Council Regulation (EC) No 1099/2009). A mobile slaughterhouse
plant is a self-contained processing unit that can be moved between farms, allowing slaughter to be performed on farm and avoiding
the relocation of livestock.
12Patterns of livestock transport in the EU and to third countries
Parallel trend towards small-scale production of premium products
Not all meat-processing companies have concentrated their activities as a response to the increasing
price competition. There is also a trend of smaller businesses that focus on quality, eco-friendly
production and animal welfare. Food scandals related to contaminated meat and hygiene problems
are a driving force in this trend (6).
As example, strict regulatory standards for animal welfare and food safety and a large home market
have driven Sweden to invest in small-scale production, as consumers increasingly focus on local,
sustainable meat. While the slaughter prices in large abattoirs make it impossible for small and medium
sized slaughterhouses to compete, some are still working in Germany selling premium products from
regional and transparent supply chains ( 8).
Average slaughterhouse wage in Europe
The shift towards mass production in large units has been driven by structural market forces such as
retailer concentrations, price pressure but also by the competition and imports from low-wage
countries (Eurofound, 2018) thus affecting the transport and slaughter conditions of live animals.
While average wage data for meat processors is not available for all MSs, a comparison on minimum
wage highlights the differences in salaries between MSs. In January 2021, ten MSs located in the east
of the EU, had minimum wages below EUR 700 per month: Bulgaria (EUR 332), Hungary (EUR 442),
Romania (EUR 458), Latvia (EUR 500), Croatia (EUR 563), Czech Republic (EUR 579), Estonia (EUR 584),
Poland (EUR 614), Slovakia (EUR 623) and Lithuania (EUR 642). Only six MSs, all located in the west and
north of the EU, have minimum wages above EUR 1 500: France (EUR 1 555), Germany (EUR 1 614),
Belgium (EUR 1 626), the Netherlands (EUR 1 685), Ireland (EUR 1 724) and Luxembourg (EUR 2 202) (9).
The pay and wage levels of meat processors vary across EU MSs.
Until recently, meat processing used to be a low-wage industry in Germany, often based on temporary
contracts ( 10). A mean wage for a permanent contract in Germany in 2017 was EUR 21 576 to 32 232 per
year, while temporary and posted workers were in some cases paid only EUR 4 to 6 an hour (Eurofound,
2018). Sweden has an average wage for meat processors of EUR 33 679, which is regarded as a high
cost level compared to other MSs. This number nevertheless does not represent the temporary
workers’ wage (Eurofound, 2018).
2.5. Market dynamics
Meat consumption trends
Population growth and per capita consumption of meat products have an effect on transport patterns
of livestock, as well as meat. Income growth in emerging economies has led to an increasing
consumption of higher value products such as meat and dairy products. The rise of societal and
environmental concerns in developed economies led to lower red meat consumption (EU Agricultural
Market briefs, 2019).
The changes in meat consumption patterns in Europe and around the world have had effects on the
internal trade, as well as exports and imports. The consumption of beef in Europe has been relatively
8 https://euagenda.eu/upload/publications/untitled-178347-ea.pdf
9 https://ec.europa.eu/eurostat/web/products-eurostat-news/-/ddn-20210205-1
10 The Occupational Safety and Health Inspection Act (Arbeitsschutzkontrollgesetz) adopted in December 2020 and in place since 1
January, 2021 sets rules for a transition away from a low-wage industry, https://www.bundesregierung.de/breg-
de/suche/arbeitsschutzkontrollgesetz-1772606
13IPOL | Policy Department for Structural and Cohesion Policies
stable in the past few years (Table 2). It is expected that beef consumption will decline by 0.9 kg by
2030 (EC, 2020). The beef production is also expected to continue declining, despite moderate export
prospects and decreasing feed prices (EC, 2020).
The EU production and consumption of sheep/goat meat has decreased gradually until 2013, when
the production stabilized. The EU consumption is expected to remain relatively stable by 2030 at 1.3
kg per capita. The withdrawal of the UK from the EU creates uncertainty in the predictions in the sheep
sector, as it was the EU’s largest producer (EC, 2020).
While the EU is the largest consumer of pig meat worldwide (40 kg per capita), there is a slight decrease
in consumption. Strong international demand and increased prices are believed to be main drivers in
the decreasing pattern (EC, 2020).
The production of pig meat has not decreased, while exports have been increasing (+12%) (EU
Agricultural Market briefs, 2019). The EU is expected to continue being a main exporter and pig meat
supplier, but not rebounding the record levels of 2019-2020 (EC, 2020).
Poultry meat consumption is increasing significantly in all regions of the world. The consumption in
the EU is currently 25 kg per capita and is expected to increase.
The EU is one of the major poultry exporter and importer worldwide. The demand of poultry meat is
increasing in Africa and Asia, possibly having effects on EU exports. (EU Agricultural Market briefs,
2019).
Table 2: Per capita consumption (kg/capita/year) of meat and trends by regions
Per capita consumption (kg/capita/year)
Beef Pig meat Poultry
Europe 15 40 25
Africa 5 Na 6
Asia 5 15 10
Oceania 20 20 40
North America 35 30 50
South America 35 na 40
Note: Increasing consumption trends in orange. Decreasing consumption trends in yellow.
Source: EU Agricultural Market briefs, 2019. Table own elaboration.
As consumer dietary patterns, health considerations, and convenience trends change, the EU meat
consumption is projected to decline by 1.1 kg per capita per year (from 68.7 to 67.6 kg) by 2030 (EC,
2020).
The worldwide demand, on the other hand, is expected to sharply increase by + 15 % over the next ten
years, reaching 38 kg per capita in 2027 (OECD-FAO, 2018; Peyraud et al., 2020). These patterns will have
an impact on the transport of livestock to slaughterhouses, as well as on exports and imports of meat
and live animals from and to third countries.
14Patterns of livestock transport in the EU and to third countries
Consumer patterns and preferences
Environmental concerns will shape consumer preferences and increase their attention on local
markets, organic and other quality schemes, animal welfare and environmental footprint. Changes in
consumption habits are driven by different reasons such as dietary adjustments (more flexitarians,
vegetarians and vegans), health considerations (population ageing and lower protein needs) and
convenience (shift from fresh meat to more processed meat and preparations) (EC, 2020). In fact,
sustainability is expected to take a more prominent role in EU meat markets, among both producers
and consumers (EC, 2020).
This could lead to a smaller EU livestock herd, particularly of bovines and swine (-5.5 million and -4.5
million heads respectively) by 2030.
Linked to production and sustainability, there is an expected decline in exports that will affect
livestock (-30 %). Exports of live cattle are expected to decline gradually due to a lower demand from
Turkey and increasing concerns over animal welfare during transport (EC, 2020). The export of ovine is
also projected to slowly decline to 40 thousand heads by 2030 (-32 % compared to 2020). The main
reasons are animal welfare concerns and financial risks linked to certain trade destinations.
Supplies from other markets such as Brazil, the United States of America (US) and Argentina for beef or
US, Brazil and Canada for pig meat will further drive the evolution of prices for meat products in the EU
and thus shape the export of meat and livestock.
2.6. Environmental and health constraints
Environmental factors play a key role in agriculture and livestock production. Concerns about
greenhouse gas emissions, changes in temperatures, water shortages, reoccurring appearance of
zoonosis and many other factors are affecting the trade of livestock. The EUs commitment to a greener,
fairer and more sustainable transition in the agricultural sector will have to address and foresee
environmental challenges. Some main drivers that may affect the transport of livestock are mentioned
in this section.
Greenhouse gas emissions
The European Council, in its conclusions of 12 December 2019, agreed on the objective of achieving a
climate-neutral EU by 2050, in line with the objectives of the Paris Agreement. On 4 March 2020, as part
of the European Green Deal, the European Commission adopted a legislative proposal for a European
Climate Law ( 11), setting out the objective of a decarbonised EU economy and establishing a framework
for achieving this objective.
To this end, the Commission shall proceed to the quantification of the mitigation potential in
agriculture up to 2030, which will include reductions in greenhouse gas (GHG) emissions, effects of
land use changes and carbon storage in agricultural soils. Modelling projections for 2030 show that
GHG emissions from EU agriculture are going to remain largely unchanged from current levels (EC,
2020). Enabling agriculture to make a significant and proportionate contribution to the EU’s climate
mitigation efforts will require the deployment of all the tools and options available to the sector to
drive down GHG emissions (IEEP, 2019).
The majority of agricultural emissions (~59 %) are attributed to livestock production (including manure
decomposition and enteric fermentation) (IEEP, 2019). While the vast majority of emissions are
11 commission-proposal-regulation-european-climate-law-march-2020_en.pdf (europa.eu).
15IPOL | Policy Department for Structural and Cohesion Policies
attributed to the production cycle of livestock, some are caused by the transport of livestock between
EU MSs and to third countries.
Transporting meat instead of live animals has been proposed as a means to reduce emissions.
Transporting carcasses instead of livestock implies shorter journeys (less resting stops for live animals),
a decrease in consignments (more carcasses can be transported in the same volume than livestock),
and an increase in energy for refrigeration, amongst other factors.
Based on the 2007 trade volumes, Baltrussen et al. calculated that transporting horse carcasses instead
of live horses within the EU could reduce CO2 emissions by 48%, while stopping the intra-EU transport
of live swine would cut CO2 emissions by 40 % (Baltrussen et al., 2009).
Concrete calculations show that transporting live lambs from Hungary to Italy, instead of their
carcasses, increases CO2 emissions in 108 gram per kg of meat, NOx emissions by 0.41 gram per kg
meat, and requires 0.03 more litres of diesel per kg of transported meat (Baltrussen et al., 2017). CO2
and NOx emissions were also estimated to be 85 % higher in long-distance transport of livestock,
compared to long-distance transport of meat. The transport of carcasses requires 5 times less
consignments then the transport of livestock; however, this is partially compensated by a 20 % increase
in diesel use for refrigeration (Baltrussen et al., 2017).
While transport represents just a minor percentage of GHG emissions in the livestock production cycle,
it is a factor to be considered when discussing measures to reduce emissions. Switching livestock
transport to meat and carcass transport would also have a relevant impact on the welfare of animals.
Farm to Fork strategy
On 20 May the European Commission unveiled the Communication ‘A Farm to Fork Strategy - For a
fair, healthy and environmentally-friendly food system’ (COM (2020) 381).
Livestock farming is one of the sectors most concerned by the Farm to Fork (F2F) Strategy. It highlights
the environmental and climate impacts of current levels of consumption and production of meat, dairy
and eggs and addresses the need to shift to a more plant-based diet (Massot, 2019). The F2F Strategy
also addresses the revision of the EU legislation on animal welfare, including on animal transport and
slaughter of animals. To enhance the regional and local food systems, the Commission will also support
reducing the dependence on long-haul transportations of primary agricultural goods (COM (2020)
381) 12.
A change in consumption patterns and concerns about animal welfare during the production cycle
(including transport) will affect the meat production and therefore also the amount of transported
livestock within the EU. It is yet unclear if a decrease in meat consumption in the EU will cause a
decrease in overall livestock production and transport, or rather be compensated by an increase in
exports to third countries. All of the above-mentioned factors will determine livestock transport
patterns in the coming years.
Animal Health
Animal diseases can cause serious social, economic and environmental damage, and can in some cases
pose a threat to human health (Peyraud et al., 2020). Some emerging infectious diseases in humans
have an animal origin and are classified as zoonosis (Blancou et al., 2005 and Peyraud et al., 2020).
Animal diseases threaten economic development, as well as animal and human well-being. Major
12 https://eur-lex.europa.eu/legal-content/EN/TXT/?uri=CELEX%3A52020DC0381&qid=1624630067243
16Patterns of livestock transport in the EU and to third countries
animal disease threats have a negative impact both on the livestock production and on worldwide
trade.
Intensive farming systems, exposure to high densities and increased levels of stress during transport
are some underlying causes of disease outbreaks in livestock production (Peyraud et al., 2020).
Conditions of transport, health, and stress levels of livestock destined for transport have to be
controlled and considered as threat factors.
Water Shortage
Global warming can be a challenge to the increase in demand for meat and dairy products. Water-
stressed nations are avoiding rearing animals from birth and are evading water-demanding options( 13).
Dairy cows, for example, can drink between 110 and 180 litres of water per day and this amount can
double when exposed to a lot of heat.
Libya and Jordan, the main importers of sheep from the EU, have been facing water scarcity. Population
growth, improved living standards and the loss of certain resources due to mismanagement and
environmental degradation are some of the main reasons for water shortage in Jordan (Haddadin et
al., 2006). Water shortage, both for domestic and agricultural use, is also registered in North Cyprus
(Katircioglu, 2006). Egypt imports 12-months old cows and raises them the final six months before
slaughter. This allows the reduction of the cost of water and nutrient-rich feed that the animals need
in their early life stages. In addition, the meat is sold as produced in Egypt, raising market price (13).
2.7. Specific local patterns
Religious slaughter methods are often cited as one of the main reasons why livestock imports are
preferred by certain countries ( 14). Turkey’s beef production system for instance relies largely on
fattening imported live cattle. The import of live animals helps them to protect local producers, while
ensuring consumers have access to fresh meat, processed in accordance with Muslim religious
practices. The EU provides 25 % of Turkey’s imports of live animals (DG Health and Food Safety, 2019).
The export is also driven by the consumers’ preference of purchasing freshly slaughtered and non-
refrigerated meat, even if modern meat preservation techniques involving controlled refrigeration in a
protective atmosphere mean that it is increasingly difficult to distinguish between fresh and
refrigerated meat (9).
Lebanon claims that the availability of refrigerated trucks and warehouses is not always ensured,
making live animal transport more convenient as a continuous cold chain is necessary for safe imports.
However, Lebanon already imports some meat and carcasses, indicating that facilities are in place in
some areas. Investments in infrastructure would be required in more urban areas to allow the
replacement of live animal imports with carcasses or meat imports (9).
Since 2000, there has also been an increase in demand in Europe for meat slaughtered following
religious practices. This period of growth and development has continued in the past decade (Lever
and Miele, 2012). Data regarding ritual slaughter is lacking for different MSs making it hard to assess
how much it contributes to the EU economy and of animal slaughter and transport.
13 https://www.theguardian.com/environment/2020/jan/23/how-the-middle-easts-water-shortage-drives-demand-for-live-animal-
imports
14 http://live1.ciwf.org.uk/media/3817826/stop-the-bull-ship-report.pdf
17IPOL | Policy Department for Structural and Cohesion Policies
3. LIVESTOCK TRANSPORT IN THE EU AND TO THIRD
COUNTRIES: KEY FEATURES
KEY FINDINGS
• The EU has an important population of livestock, the majority of which experiences
transport during their life.
• Almost all livestock transport occurs within the EU, with extra-EU trade being just a small
fraction. Extra-EU trade is nevertheless an important component of livestock transport.
• In 2019, about 1.4 billion bovines, swine, poultry, ovine and equines were traded across
the EU Member States while roughly 230 million bovines, pigs, poultry and ovine were
exported from EU to non-EU countries.
• Intra-EU livestock trade accounted for EUR 8.6 billion in 2018 while extra-EU trade
accounted for EUR 3 billion.
• The number of animals transported within the EU has increased by 19 % from 2009 to
2015.
• By and large, the number of consignments increased in line with the increase in the
number of transported animals. The number of animals transported per consignment
decreased for all animal categories except swine, which has increased by 56 % from 2005
to 2015.
• Exports to third countries have increased between 2005 and 2015, driven mainly by a
threefold increase in cattle exports.
• The duration of journeys for extra-EU consignments are generally longer given the
transport routes, border procedures, waiting times and the fact that a large number of
exports is carried out by sea.
The EU has an important population of livestock. In 2018, EU herds counted 87 million bovine animals,
147 million pigs, some 100 million sheep and goats, 290 million laying hens as well as countless chicks
and other types of animals such as rabbits and horses (EPRS 2020). The majority of this livestock is kept
in few MSs with Spain, France, Germany, Italy, Romania and Poland leading the market 15.
Data from TRACES (TRAde Control and Expert System) indicates that the total number of animals
transported within the EU increased by 19 % between 2009 and 2015. The increase of transported
animals caused an upwards trend in the number of consignments within the same years. Nevertheless,
different trends were observed for the different animal categories. The number of transported cattle,
sheep and goats decreased as well as their number of consignments. The number of heads of horses,
pigs and poultry increased together with the number of consignments for said animals. During the
same time, the consignments for pigs, sheep and goats remained relatively stable (EPRS, 2018).
15 https://ec.europa.eu/eurostat/web/products-eurostat-news/-/ddn-20200923-1
18Patterns of livestock transport in the EU and to third countries
Almost all the livestock transport is intra-EU. Extra-EU trade in live animals represents a small part of
all EU trade, summing up to between 10 and 15 % of total trade (EPRS, 2020; EFA, 2021). Horses
dominate extra-EU consignments, while cattle represents the next largest group. (EPRS, 2018).
Proportion of live animal trade within and outside of the EU differs for the different animal species.
Cattle is mostly destined for exports to third countries while live pigs trade is much higher within the
EU than to third countries. The number of sheep exported is almost as high as the number of sheep
traded within the EU (Figure 1) (EPRS, 2020).
3.1. Intra-EU trade
In 2019, about 1.4 billion bovines, swine, poultry, ovine, caprine and equines were traded across the
EU Member States. The trade of live animals between MSs has been increasing over the past decades.
Between 2005 and 2015, the intra-EU trade flow of pigs has increased while the transport of cattle has
been relatively stable. The transport of sheep and goats has decreased for the same period (EFA, 2019).
The increase in traded animals can be linked to some extent to the enlargement of the EU from 25 MSs
in 2005 to 28 MSs in 2013. The withdrawal of the United Kingdom in 2020 will have effects on the intra-
EU trade. All animal categories have nevertheless seen a trade flow increase between 2014 and 2017,
with the number of live cattle transport increasing by +8.3 %, live pig trade by +15.3 % and sheep/goats
by +10.8 % (EFA, 2019).
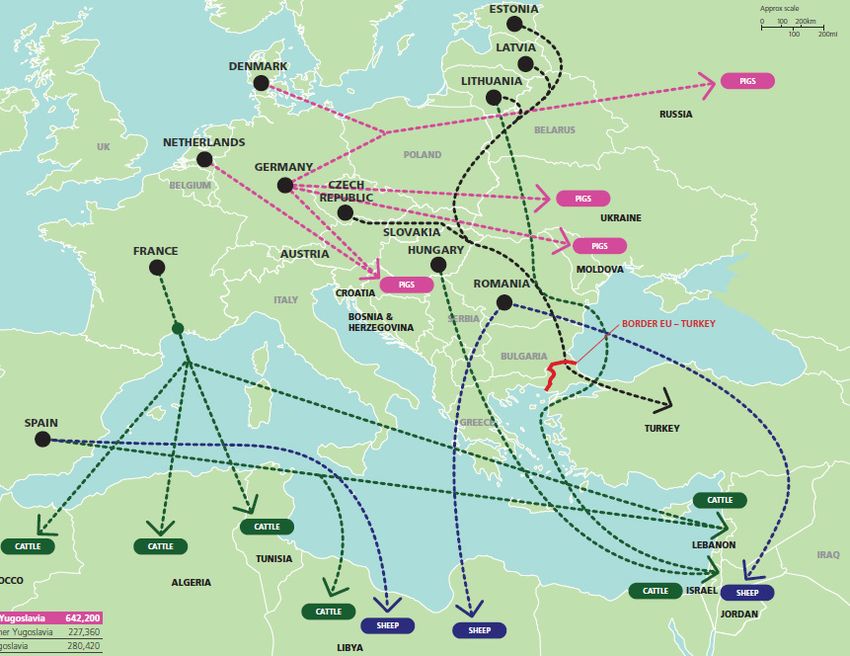
In 2019, 4.3 million bovines, 3.3 million ovine and caprine, 36.9 million pigs, 1 300 million poultry and
55 692 equines were traded between EU Member States (EFA, 2021). Poultry was the most traded group
of animals, representing at least 57 % of the total number of traded live animals for all MSs. The
proportion of the different animal species traded in 2019 by MSs is available in Figure 2 while Figure
3 shows proportions excluding poultry (EFA, 2021).
19IPOL | Policy Department for Structural and Cohesion Policies
Figure 2: Proportion of animal category sales from Member States in 2019
Note: * UK data on equines is missing.
Data source EFA, 2021; Comtext, Eurostat. Graphic: own elaboration.
20Patterns of livestock transport in the EU and to third countries
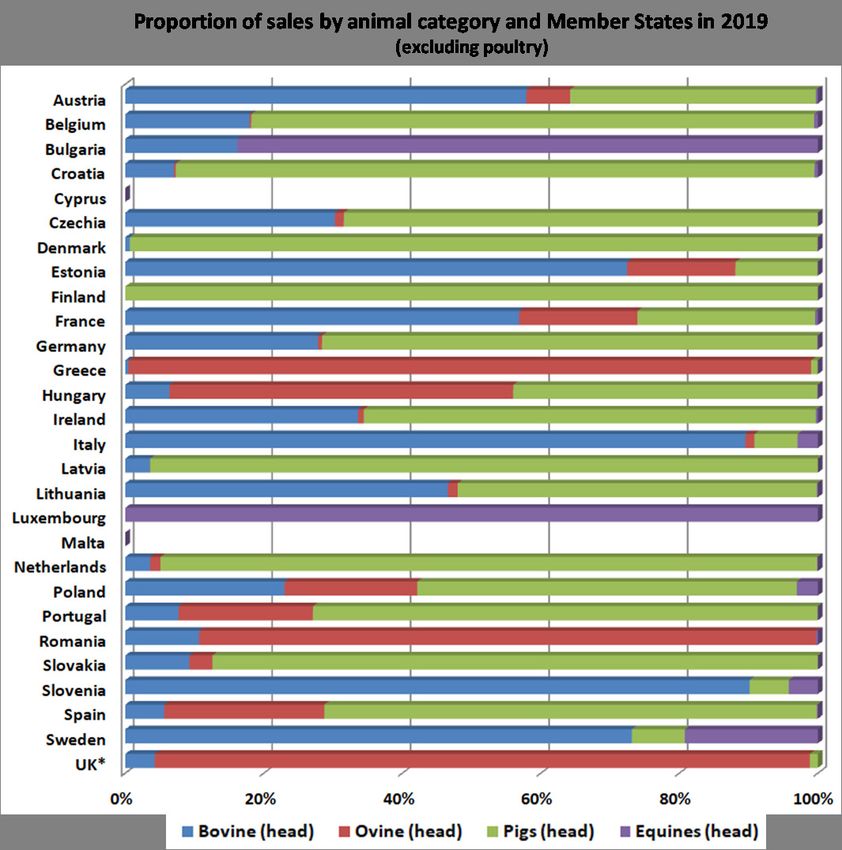
Figure 3: Proportion of animal categories sold by one Member State to the rest of EU MSs in 2019
Note: * UK data on equines is missing (excluding poultry).
Data source EFA, 2021; Comtext, Eurostat. Graphic: own elaboration.
3.1.1. Number of consignments
95 % of the livestock raised in a MS is transported and slaughtered in the same MS (EPRS, 2018).
Following the increase in transport of animals between 2005 and 2015, there has been a raise in
consignments. This was not proportional to the increase in number of transported animals for all
categories (Table 3). A slight rise in average number of animals per consignment was observed for
cattle, while the number of transported pigs per consignment doubled between 2005 and 2015. Sheep
and goats had a reduction of animals per consignments (Figure 4) (EPRS, 2018).
21IPOL | Policy Department for Structural and Cohesion Policies
Table 3: Number of transported animals (in millions), number of consignments within the EU
and mean number of animals transported per consignment for 2005, 2009 and 2015
Mean number of animals
Transported animals (in
Number of consignments transported per
millions)
consignment
2005 2009 2015 2005 2009 2015 2005 2009 2015
Cattle 4.1 4.5 4.4 115632 127710 117095 35.5 35.2 37.6
Pigs 16.8 29.6 33.7 11824 14878 13293 1420.8 1989.5 2535.2
Poultry 848.5 1213.4 1451.2 85092 125850 123136 41697 39230 23092
Ovines 4.5 4.5 3.3 67285 92489 120745 52.9 35.8 26.8
Horses 0.2 0.1 0.2 20349 30930 62844 2.9 1.1 1.7
Total 874.1 1252.1 1492.8 300182 391857 437113 - - -
Source: EPRS, 2018
Figure 4: Number of transported animals (in millions) and number of consignments for the
intra-EU trade in 2005, 2009 and 2015
Source: EPRS, 2018.
22Patterns of livestock transport in the EU and to third countries
3.1.2. Main trading countries
The main players in intra-EU trade vary depending on the animal category. France dominates bovine
trade with more than double the amount of Germany, the second country with highest bovine trade
(EFA, 2021) (Table 4). Italy, the Netherlands and Spain are the main buyers, accounting for 70 % of total
intra-EU destinations on average for 2016-2017 (EFA, 2019). Romania is the top trader of ovine within
the EU, followed by Spain and Hungary. Pigs are mainly transported by Denmark and the Netherlands,
which together represent 73 % of the entire trade within the EU. Germany is the first in poultry trade,
closely followed by the Netherlands. Lastly, equine trade is dominated by the Netherlands, France and
Belgium.
Table 4: Top intra-EU traders of live animals in 2019 (total of intra-EU trade) in million head of
animals
France 1.5 Romania 1.5 Denmark 15.7 Germany 312 Netherlands 12.9
Germany 0.7 Spain 0.6 Netherlands 11.3 Netherlands 282 France 9.85
Equines*
Bovines
Poultry
Ovines
Pigs
Netherlands 0.4 Hungary 0.5 Spain 2.0 Belgium 136 Belgium 7.8
Belgium 0.2 France 0.4 Germany 1.9 France 112 Poland 5.2
Ireland 0.2 UK 0.2 Latvia 1.4 Czechia 105 Denmark 3.9
Note: *Equines are in thousands of heads.
Data Source: Eurogroup for animals, 2021.
3.1.3. Duration of journeys
The duration of intra-EU journeys has increased for all time categories from 2005 to 2015 (Figure 5).
Short journeys, lasting less than 8 hours, have relatively steadily increased from 227 thousand journeys
in 2005 to 260 thousand journeys in 2015. Long journeys (between 8 and 24 hours) and very long
journeys (more than 24 hours) have almost doubled in the same period of time, going from 72
thousand journeys to 125 thousand journeys. The eastward expansion of the EU resulted in increased
transport times. The biggest increase in long-distance journeys (+80 %) occurred between 2005 and
2009, after the accession of Bulgaria and Romania to the EU (EFA, 2019).
For around 1% of the journeys, there was no time registered (EPRS, 2018). Almost all of the transports
of livestock occur within EU MSs with two thirds being short journeys. The increase of long and very
long journeys can be attributed to a certain extent to the geographical expansion of the EU, from 2005
to 2013 (EFA, 2019). Livestock is also traded by sea between EU MSs, increasing the journey duration.
According to DG SANTE, 2.8 million sheep and cattle were transported by sea to Croatia, France, Ireland,
Portugal, Romania, Slovenia and Spain in 2018 (Boada-Saña et al., 2021).
23IPOL | Policy Department for Structural and Cohesion Policies
Figure 5: Annual number of consignments per journey of duration for intra-EU trade from 2005
until 2015
Note: 24/29 hour: a stop at a control is needed for pigs/poultry and horses after a journey of 24 hours; for cattle, sheep and
goats a stop is needed if the journey last more than 29 hours. 2005 – 2006: EU 25, 2007-2012: EU 27 (including Bulgaria and
Romania), 2013-2015 (including Croatia).
Source EPRS, 2018.
3.1.4. Trade Value
The value of intra-EU trade in live animals was EUR 8.6 billion in 2018 (EPRS, 2020). Bovines, pigs and
poultry accounted for the highest values. Bovines accounted for EUR 2.7 billion, followed by swine (EUR
2.47 billion) while poultry contributed to the intra-EU trade with EUR 1.7 billion. Equidae had a trade
value of EUR 825 million, while sheep and goats accounted for EUR 215 million. Other animals had a
trade value of EUR 6.2 million ( 16).
3.1.5. Reasons for transport
Cattle for slaughter constituted just over half of the total number of cattle sold among EU countries
between 2014 and 2017. The key destinations of cattle for slaughter during this period of time were
the Netherlands (48%), Spain (24 %) and Belgium (13 %). The transport for other reasons such as
replacement for dairy herd or animals for further fattening represented the other half and has risen by
21 % between 2014 and 2017. Main buyers for other purposes were Italy (73 %) and Spain (19 %) (EFA,
2019).
Denmark and the Netherlands are the most prominent sellers of swine accounting for 74% of total
intra-EU trade in 2015-2016, and 73 % in 2019 (EFA, 2019; EPRS, 2020). Most of the intra-EU trade are
young pigs sent for further fattening while a smaller proportion is sent for slaughter (EFA, 2019).
Romania, Hungary, France and Spain were the main sellers of sheep and goats in the EU between 2014
and 2017, as well as in 2019 (EFA, 2019; EPRS, 2020). Key buyers within the EU are Italy, Greece and
Spain, followed by France, Ireland and Germany. The trade routes for intra-EU live sheep and goat
appear to be stabilized in a continuous flow. Some of the main routes are Romania-Greece; Romania-
Italy; France-Italy; Hungary-Italy; Spain-France. It is interesting to note here that some of the main
sellers are also main buyers. Most sheep and goats are transported for slaughter (EFA, 2019).
16
https://epthinktank.eu/2020/02/10/eu-trade-and-transport-of-live-animals/value-of-eu-trade-in-live-animals-in-e-and-shares-of-animal-
categories/
24Patterns of livestock transport in the EU and to third countries
Horses for slaughter (43 %) and pure-breeding horses (30 %) dominated the intra-EU trade of horses in
2019. More than half of selling of pure-breeding horses come from Belgium (46 %) and Denmark (21
%). Horses for slaughter come predominately from the Netherlands (23 %), Poland (22 %), France (20
%) and Romania (13 %). Live horses, excluding those destined for slaughter and breeding, are mainly
sold by France (48 %) and Spain (23 %). Live asses, mules and hinnies are exported almost exclusively
by the Netherlands, which accounts for 87 % of live asses selling and 99 % of mules and hinnies (EFA,
2021).
3.2. Extra-EU trade
The demand for live animals in third countries has been growing in recent years for different reasons
such as breeding, fattening or immediate slaughter. The movement between the EU and third
countries in 2019 was dominated by exports, which represented two-thirds of trade, whereas imports
accounted for the remaining third (EPRS, 2018). This in-depth analysis will focus on exports while some
data on imports is also provided.
Exports to third countries have increased between 2005 and 2015, driven mainly by a threefold
increase in cattle exports. Cattle exports have further nearly doubled between 2015 and 2017 (EFA,
2019). The trade of pigs and ovine was low, with the transport of pigs decreasing between 2005 and
2015 from 22 % of total exported animals to 5%. (EFA, 2019). Export of live horses is typically related to
non-food purposes. 44 % of the transport is for purposes other than slaughter and pure-breeding, while
pure–breeding horses account for 28% (EFA, 2021).
About 239 thousand breeding cattle, 78 thousand cattle for slaughter, 416 thousand pigs, 2.4 million
sheep and 14 thousand goats, were exported from the EU to third countries for breeding or slaughter
in 2018 (Marahrens and Kernberger-Fischer, 2021). In 2019, about 230 million bovines, pigs, poultry
and ovine were exported from EU to third countries. Poultry was the most traded farmed species
accounting for 98% of the exports. Lastly, 32 thousand horses, asses, mules and hinnies were exported
in the same year (EFA, 2021). Exports of ovine also increased nearly threefold between 2005 and 2015
even if they started from a relatively low initial value (EFA, 2019).
The number of traded animals with third countries is not consistent between different databases. For
instance, discrepancies between TRACES and Eurostat have been observed for several years. These
differences may be attributed to the fact that databases group the animal categories differently; this
would nevertheless lead to a similar total number, which is not the case (Marahrens and Kernberger-
Fischer, 2021). It could be concluded that there is still a lack of coherent data collection and reporting
from third countries, which prevents an accurate view of live animal trade outside of the EU.
3.2.1. Number of consignments
The export of live animals to third countries represents a small fraction of the total EU transports. The
number of exported animals has been increasing in the past decades, which was followed by an
increase in consignments. More than half of the extra-EU consignments are for horses, with less than
two horses per journey (EFA, 2021). The number of consignments for cattle is the second highest and
has increased threefold from 2005 to 2015 (EFA, 2019). This contributed to the increase in total extra-
EU transports in the past years. The increase of consignments of poultry has been relatively steady from
2005 to 2015, while consignments for pigs fluctuated significantly between years (Figure 6).
The trade of pigs, ovine and caprine with third countries was low and fluctuated between the years.
According to data of the Eurogroup for animals (2019), consignments of ovine increased by 2 %
between 2005 and 2015, representing a small portion of the total extra-EU transports. The EPRS
25You can also read