Payables and Receivables: Managing Post-COVID Trade Finance Risk - May 2021 - Credit Benchmark
←
→
Page content transcription
If your browser does not render page correctly, please read the page content below

Payables and
Receivables:
Managing Post-COVID
Trade Finance Risk
May 2021

Whitepaper | Payables & Receivables: Managing Post-COVID Trade Finance Risk

 Table of Contents
 1.          Introduction .......................................................................................................................................... 4
 2.          Corporate Terms of Trade: Managing Payables and Receivables ................................................... 5
 3.          Receivables / Customers Case Study: Rio Tinto ............................................................................... 7
 4.          Payables / Suppliers Case Study: General Motors ............................................................................ 9
 5.          Inflation: Supply Chain Disruption and Pent-Up Demand May Fuel Post-COVID Price Hikes ...... 11
 6.          Conclusion.......................................................................................................................................... 13
             Appendix ............................................................................................................................................. 14

                                                                                         2
Collective Intelligence for Global Finance                                                                                                        creditbenchmark.com
Whitepaper | Payables & Receivables: Managing Post-COVID Trade Finance Risk
Executive Summary
Trade finance services are used in trillions of dollars’ worth of economic transactions
(BIS estimate a third of all trade), and users of this type of service are collectively
estimated to pay about $60bn pa in fees. Trade Credit Insurance covers $3trn+ of
exposure, with insurance costs running at $6bn pa.
The CDS market is a proxy for the cost of trade credit insurance. In general, corporates
must accept the going rate, but knowledge of current pricing vs. current risk may be
critical to some marginal trade credit insurance decisions. In recent months, US 5Y
CDS prices look low compared with consensus credit data from Credit Benchmark.
This suggests that the current cost of trade credit insurance may also be below normal
and hence possibly undervalued.
Receivables Case Study - Rio Tinto: The majority of the largest Rio Tinto customers
are Investment Grade; none of them are in the c category, although a sizeable minority
are in the bb and b categories. 45% of the total Rio Tinto customer base is unrated.
The credit distribution of the main Rio Tinto customers shows significantly lower
credit risk than for the sector overall.
Payables Case Study - General Motors: The majority of the top suppliers to General
Motors are Non-Investment Grade, including some in the b and c categories. Across
more than 800 suppliers, 140 are covered by rating agencies, whereas 280 are covered
by consensus data. The credit distribution of the main General Motors suppliers
shows slightly higher credit risk than for the sector overall.
Inflation: If supply chain disruption and a consumer boom is inflationary, then COVID
winners are likely to also be inflation winners. Examples include Real Estate, Food
Producers, Food Retailers and General Industrials. But success in an inflationary
environment hinges on pricing power, optimal inventories and correct identification of
industry turning points and shrewd trade finance management.
The COVID-19 pandemic has pushed global About Credit Benchmark
personal savings to record levels, estimated by
Moody’s to represent 6% of Global GDP ($5trn). Credit Benchmark produces a comprehensive view of credit risk by
creating Credit Consensus Ratings (“CCRs”) and analytics on the credit
This brings the prospect of a major consumer quality of companies, financial institutions, sovereigns, and funds.
spending spree and general economic boom as
the world emerges from lockdown. The data is sourced from more than 40 global financial institutions,
representing the work of over 20,000 analysts and is also used by
But chronic material shortages and general regulators to monitor Basel rules on capital adequacy.
supply bottlenecks have raised the ancient
Credit Benchmark collects a specific measure of credit risk: a one-year,
spectres of cost-push and demand-pull inflation, forward-looking Probability of Default (PD) and forward-looking senior
while the recent Greensill failure has focused unsecured Loss Given Default (LGD).
attention on supply chains, trade finance and
trade credit insurance. The underlying inputs are subject to a rigorous data quality approval
process and derived from models that are approved by regulatory
This paper presents some single company case authorities. The resultant accuracy of each PD and LGD leads to a
credible market view of credit risk for each given entity.
studies using Bloomberg supply chain data. For
CFOs, Group Treasurers, Procurement Managers, After being anonymized and aggregated, the contributed risk estimates
and participants in the trade finance sector, it are mapped to the appropriate credit category on the Credit Benchmark
highlights the value of credit consensus data in Consensus scale, which is calibrated periodically and can be used as a
assessing current and future counterpart credit comparison to the scales published by the rating agencies.
risks.
Credit Benchmark produces regular data updates with history going
back to 2015.
3
Collective Intelligence for Global Finance creditbenchmark.com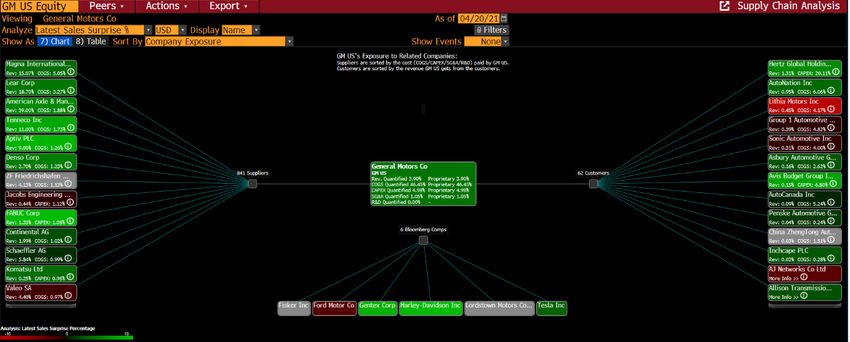
Whitepaper | Payables & Receivables: Managing Post-COVID Trade Finance Risk

1. Introduction
Even before the pandemic, global supply chains were showing signs of strain. Now that the world economy is in the
process of a full-scale restructuring, the credit implications are wide-ranging and long-term. COVID has been a catalyst,
but globalisation was already in retreat, and tackling climate change is now a political and corporate priority.

Factors reshaping supply chains and processes include:

    •    Move from “Just-in-Time” to “Just-in-Case” – companies are holding more inventory and use multiple suppliers
         to diversify risk of shortages
    •    Trade wars and environmental concerns driving deglobalisation and sustainable sourcing
    •    Post-COVID norms, including staycations, working from home and persistent physical bottlenecks
    •    The costs of restructuring: as COVID support programs are tapered, a (delayed) spike in corporate failures will
         increase financial and operational risks

Credit changes in 2020 are described in detail here, and many of these trends anticipate the medium-term credit impact
of the post COVID world. Oil & Gas, Chemicals, Autos, Travel & Leisure and Retail have seen sharp declines in credit
quality - recovery will likely be slow and difficult in these sectors.

But the impact of COVID on already fragile supply chains may bring a second wave of casualties scattered across a
range of industries. The semiconductor shortage has hit car manufacturers, consumer electronics, and
telecommunications. Raw materials shortages – including aluminium and glass – are hampering the post-COVID
construction boom. The recent Suez Canal blockage highlighted the vulnerability of the global economy to single points
of failure.

A previous 2018 analysis of supply chain credit reviewed some of the largest firms and their hundreds of suppliers; many
of those suppliers were relied on by more than one of the large multinationals. A small percentage of those suppliers
were non-investment grade, highlighting some of the weak links in long and complex supply chains where problems can
lead to operational and financial disruption.

This report has four sections:

    1.   Managing payables and receivables (Greensill)
    2.   Receivables Case Study: Rio Tinto (Aluminium)
    3.   Payables Case Study: General Motors (Aluminium, Semiconductors etc.)
    4.   Inflation hedges: avoiding the impact of supply chain bottlenecks in credit portfolios

                                                                 4
Collective Intelligence for Global Finance                                                              creditbenchmark.com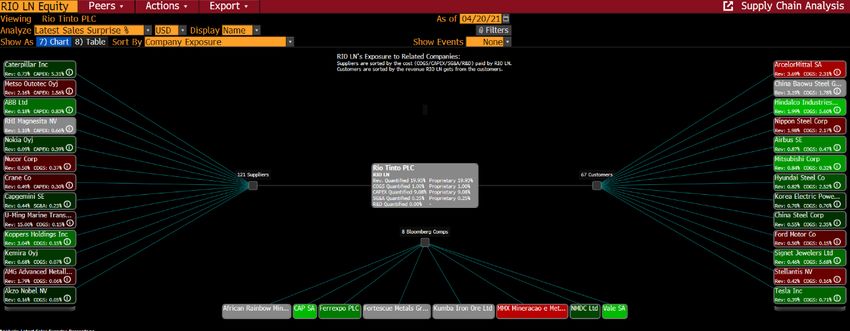
Whitepaper | Payables & Receivables: Managing Post-COVID Trade Finance Risk

2. Corporate Terms of Trade: Managing Payables
  and Receivables
Trade finance covers a broad range of short-term treasury management functions and includes letters of credit,
receivables and invoice financing, credit agency services, export financing and bank guarantees. The BIS have estimated
that this form of cash management accounts is used in about one third of international trade flows. The combined cost
of using these types of services is estimated to be $60bn pa. Trade credit insurance alone costs global corporates about
$6bn in annual insurance premiums. Value for money is clearly critical in this area.

The recent Greensill collapse has put a spotlight on one specific trade finance element: supply chain lending. Greensill
aimed to specialise in arranging loans for small suppliers owed money by multinationals; these loans were then
securitised. However, the Greensill business profile contained some hidden risks:

        1. Loans to an entire supply chain – by definition, mainly SMEs – could be backed by pending payments from one
           large multinational

        2. Greensill had no leverage (collateral/security or pricing power) if multinationals changed their payment terms or
           chose to suspend individual payments for any reason

        3. Investors in the securitised loans had no transparency into underlying borrowers, pushing up the required yield
           and indirectly pushing up loan costs for the SME borrowers

        4. Large multinationals who thought that their suppliers represented a diverse operational risk were unaware that
           one firm – Greensill – was the ultimate lender; any problems in the flow of credit to suppliers can become an
           operational issue for a manufacturer

        5. Although their business model was aimed at a large number of small borrowers, Greensill’s credit portfolio had
           some very concentrated exposures to a few borrowers, meaning that the effective credit portfolio diversification
           was much lower than it initially appeared.1

Figure 2.1 shows the typical context and challenges for any firm in a multi-stage supply chain.

    Figure 2.1 Multi-Stage Supply Chain Links

                     Minimise overhead costs by holding minimal goods and parts inventory unless supplier risks are rising

                                                 Goods                                                             Goods

               Supplier                                                    Manufacturer                                                         Customer
                                                 Cash                                                               Cash

             Maximise "Terms of Trade" to optimise cash: push customers to pay early, but pay suppliers late, especially if interest
                                           rates are high or rising; opposite when inflation is high

Managing payables and receivables is a balancing act – when to stockpile inventory; when to stockpile cash; any
leverage for a manufacturer to dictate terms to customers and suppliers; the advantages and disadvantages of using
trade finance services including trade credit insurance and factoring.

In the post-COVID world, corporate success may hinge on successful timing of stockpiling inventory or stockpiling cash.
To optimise this, companies will need to track sector trends and finance costs more closely than ever, and consensus
data aggregates can help to identify potential turning points. Figure 2.2 shows two recent examples.

1 It is worth noting that the Herfindahl index can be used to measure concentration across customers or borrowers. It is the sum of squared % revenues from each
customer; the reciprocal shows the number of effective customers, adjusted for concentration. Supplier risk is more nuanced, but the same approach can be applied to
the % of costs attributed to each supplier, or the % of each supplier revenues that the manufacturer represents. The first of these shows the diversity across suppliers;
the second shows the extent to which the overall set of suppliers is dependent on the manufacturer.

                                                                                           5
    Collective Intelligence for Global Finance                                                                                                      creditbenchmark.com
Whitepaper | Payables & Receivables: Managing Post-COVID Trade Finance Risk
Figure 2.2 Recent Industry Turning Points
Credit Trend Credit Level
Global Forestry & Paper saw a modest deterioration in credit but reached a clear turning point in August 2020, improving
in most months since then. Global Industrial Metals and Mining suffered a severe deterioration of 40% over the course
of 2020 but has shown a modest and consistent improvement in the first few months of 2021.
Another key decision is trade credit insurance. Figure 2.3 plots a proxy for the relative cost of trade credit insurance,
comparing the US Corporate 5Y CDS Index with the US Corporate credit consensus aggregate.2
Figure 2.3 Comparison of US Corporate 5Y CDS Index with US Corporate Credit Consensus
When the market is below the zero line (green bars), it can be inferred that credit insurance is undervalued compared
with the start date of March 2019. These periods appear in clusters of up to nine months in this short sample. The
monthly standard deviation of all differences (positive and negative) is about 25% of the initial value. There are three
months – at the start of the pandemic – when the difference was significantly above one standard deviation, and five
months (including the most recent) when it is below.
2This approach assumes that the CDS index and the consensus aggregate are aligned in March 2019. If in practice the CDS market was overstating credit risk at that
point, then the bars in Figure 1.3 would be shifted up or down, but the pattern would be unchanged.
6
Collective Intelligence for Global Finance creditbenchmark.comWhitepaper | Payables & Receivables: Managing Post-COVID Trade Finance Risk
3. Receivables / Customers Case Study: Rio Tinto
Aluminium users currently face acute supply shortages. Good news for those producers who are still able to run at close
to normal output, but bad news for a range of heavy industries – with knock on supply chain effects. It is also bad news
for the auto industry which is already grappling with the EV transition and pent-up demand as lockdown eases.
Figure 3.1 shows Bloomberg data on the Rio Tinto customer set.
Figure 3.1 Bloomberg SPLC Screen for Rio Tinto
Figure 3.2 shows the credit status and trends for some of the main Rio Tinto customers (out of 67 noted in Figure 3.1)
Figure 3.2 Rio Tinto Customers
6M Downgrade Deteriorating No Change Improving Upgrade
IG1 Korea Elec Power Tenaris BMW
Mitsubishi Corp
Norsk Hydro
IG2 Anheuser Busch Marubeni Hyundai Steel
Daimler
Airbus
Crossover Luxfer Hindalco Nippon Steel
Arcelor Mittal
HY1 Ford Motor Tata Motors Univar Solutions
HY2 Constellium Tesla
7
Collective Intelligence for Global Finance creditbenchmark.comWhitepaper | Payables & Receivables: Managing Post-COVID Trade Finance Risk
Figure 3.3 shows the credit distribution for the 19 customers listed in Figure 3.2.
Figure 3.3 Credit Distribution of Main Rio Tinto Customers
The majority of these 19 are Investment Grade, mainly in the a and bbb categories. There are none in the c category.
Figure 3.4 shows the credit trends and distribution for the Mining sector (which includes Rio Tinto) as well as the
Industrial Metals and Mining Sector (which includes a number of their customers).
Figure 3.4 Industrial Metals and Mining: Credit Trends and Distribution, Global and NA
Credit Trend Credit Level
COVID resulted in a 40% increase in credit risk for the Global Industrial Metals & Mining aggregate, compared with 15%
for Global Mining. Credit distributions are similar in each sector; they are all dominated by the bb category, although
Global Mining has a higher proportion in bbb and fewer in bb.
The majority of the largest Rio Tinto customers are Investment Grade; none of them are in the c category, although a
sizeable minority are in the bb and b categories. Across more than 65 customers, 26 are covered by rating agencies,
whereas 34 are covered by consensus data. The credit distribution of the main Rio Tinto customers shows significantly
lower credit risk than for the Metals and Mining sector constituents overall.
8
Collective Intelligence for Global Finance creditbenchmark.comWhitepaper | Payables & Receivables: Managing Post-COVID Trade Finance Risk
4. Payables / Suppliers Case Study: General Motors
General Motors is in the unenviable position of being squeezed by two of the highest profile current shortages –
aluminium and semiconductors. According to Bloomberg, they have more than 800 suppliers, some of whom are heavily
dependent on GM for revenue. If GM has to mothball factories and delay rollouts, some of their suppliers may not survive.
Figure 4.1 shows Bloomberg data on the General Motors supplier set.
Figure 4.1 Bloomberg SPLC Screen for General Motors
Figure 4.2 shows the credit status and trends for some main General Motors suppliers (out of 842 shown in Figure 4.1)
Figure 4.2 Main General Motors Suppliers
6M Downgrade Deteriorating No Change Improving Upgrade
IG1 Denso
IBM
IG2 Continental Magna Intl Kilroy Realty Aptiv
Friedrichshafen Autoliv
Crossover Linamar Nemak Lear Visteon
Sensata Faurecia
Schaeffler Mando
HY1 Valeo Dana Hanon
Gestamp
HY2 Tenneco US Steel American Axle
Cleveland Cliffs Superior
9
Collective Intelligence for Global Finance creditbenchmark.comWhitepaper | Payables & Receivables: Managing Post-COVID Trade Finance Risk
Nine of these firms are non-investment grade, and five of those show a deterioration (less than a full credit notch) or a
downgrade (at least one credit notch) over the past 6 months. Of the investment grade companies, Continental has been
deteriorating and Kilroy Realty is improving, with Aptiv upgraded. Most of these firms have agency ratings but a few –
significant suppliers to GM – do not.
Of the 847 GM suppliers, 140 are covered by rating agencies and 280 are covered by consensus data. This shows the
challenge of managing supply chain credit risk – many firms are too small to be customers of major banks, let alone
able to afford a credit rating.
Figure 4.3 shows the credit distribution for the 23 customers listed in Figure 4.2.
Figure 4.3 Credit Distribution of Main General Motors Suppliers
The majority of these 23 are Non-Investment Grade, mainly in the bb category. The b and c categories make up just under
20% of the main suppliers.
Figure 4.4 shows the credit trends and distribution for the Automobiles and Parts sectors by geography. This sector
includes General Motors as well as a number of their suppliers.
Figure 4.4 Automobiles and Parts: Credit Trends and Distribution, by Geography
Credit Trend Credit Level
COVID resulted in a 40% increase in credit risk for the Global aggregate, but US companies in this sector saw an increase
of more than 50% over the same period. Credit distributions vary by region, with Asia dominated by the bbb category,
Europe by the bb category, and the US split evenly between both.
The majority of the top suppliers to General Motors are Non-Investment Grade, including some in the b and c categories.
Across more than 800 suppliers, 140 are covered by rating agencies, whereas 280 are covered by consensus data. The
credit distribution of the main General Motors suppliers shows slightly higher credit risk than for the sector overall.
10
Collective Intelligence for Global Finance creditbenchmark.comWhitepaper | Payables & Receivables: Managing Post-COVID Trade Finance Risk
5. Inflation: Supply Chain Disruption and Pent-Up
Demand May Fuel Post-COVID Price Hikes
The current risk of inflation is a hotly debated topic; if it does accelerate it will have a major impact on the management
of payables and receivables.
Inflation hawks point to record low and even negative interest rates, unprecedented levels of monetary QE and
Government debt, pent up consumer demand in the form of historically high savings rates, supply disruptions, and
growing scarcity of key resources. The stratospheric rise in the Bitcoin price is also cited as an inflation leading
indicator.3
Inflation doves argue that while there are labour shortages in some key areas, automation is generally pushing wages
lower; consumer savings are not going to stay high for long after lockdown ends, and economic restructuring may reduce
some costs rather than increase them. Longer term interest rates are already rising and will drag the rest of the yield
curve in the same direction; Governments are aiming to increase tax revenues wherever possible which will dampen
demand. Doves also assume that freely floating exchange rates will swiftly adjust to penalise countries which do not
keep inflation in check. The moribund gold price may imply that markets are unconcerned by inflation risk.
Even modest inflation (e.g., less than 5%) erodes savings (and effectively writes off debts) but the short-term economic
damage from moderate inflation rates is manageable. As inflation approaches double digits, the supply chain “terms of
trade” become much more important – successful companies are those that charge customers early and pay suppliers
late. This approach also mitigates payables/receivables credit risk.
Real Estate is the classic inflation hedge, while other typical inflation winners include large food retailers (late payments
for suppliers) and any firms that typically hold inventory (e.g., parts suppliers, some raw materials producers and traders
– provided they also have some pricing power and do not suffer from late payments from customers).
If interest rates rise significantly in response to inflation, then banks achieve a loan vs. deposit rate positive carry;
insurance companies may also benefit from positive carry (depending on the insurance cycle) because they collect
premiums up front and only pay out when losses are crystallized – but that advantage is neutralised if inflation is
significant.
Figures 5.1 and 5.2 show the trends and credit distribution for two typical inflation hedge sectors – REITs and Food
Retail.
Figure 5.1 REITs, by Sub-Sector
Credit Trend Credit Level
3La Monica, P. R. (2021, March 2). Bitcoin is surging as an inflation hedge, but don't count out gold either. CNN. Retrieved from
https://edition.cnn.com/2021/03/02/investing/gold-bitcoin-inflation/index.html
11
Collective Intelligence for Global Finance creditbenchmark.comWhitepaper | Payables & Receivables: Managing Post-COVID Trade Finance Risk
Figure 5.2 Food & Drug Retailers, by Geography
Credit Trend Credit Level
REITs are typically low risk in credit terms, with a large proportion in the a category. Retail REITs have been badly hit by
COVID, but Industrial and Office REITs show limited impact. Food & Drug Retailers show limited declines, except for Asia.
It is not yet clear that inflation is a genuine risk, but the detailed, sector-level credit impact of the pandemic since Q1
2020 gives some clues about the economic environment that bank credit analysts expect in the near future.
Figure 5.3 shows the balance of downgrades net of upgrades for many global sectors in the 12 months to March 2021.
Figure 5.3 Balance of Downgrades Net of Upgrades, Global Sectors, 12 Months to March 2021
12
Collective Intelligence for Global Finance creditbenchmark.comWhitepaper | Payables & Receivables: Managing Post-COVID Trade Finance Risk
Unsurprisingly, this shows that the essential sectors – Technology, Electricity, Telecoms, Food, Pharmaceuticals,
General Industrials and Household Goods – had the smallest downgrade net balance.
If inflation accelerates, these industries are likely to continue to do well in revenue and credit terms, although the size
and position of each firm in the supply chain may be critical. For example, a food retailer needs to have pricing power
with its end customers to avoid margins being squeezed; pharmaceutical firms may face increased chemical input prices
with incomplete scope to pass those on.
Discretionary, leisure and personal transport spending – captured by Travel & Leisure, Oil & Gas, Aerospace, Autos and
Media – had some of the highest net downgrades. These industries are unlikely to be drivers4 of, or beneficiaries of,
inflation. Inflationary erosion of purchasing power is especially negative for discretionary spending sectors, putting
further strain on already stretched balance sheets.
Most economic commentary expects that any return to normal will be slow, and pent-up demand will bump up against
supply constraints. But the inflationary impact of this depends on how scarcity is reflected; do delivery times lengthen
(as has happened during COVID) or do prices rise?
Currently, the volume adjustment seems to dominate; price adjustments will depend on where the bottlenecks arise
(where corporates have failed to build inventory ahead of time or have failed to establish “Just in Case” supply options.)
The inflationary impact also depends on how much consumers are willing or able to bid those prices up; and whether
suppliers are willing to be seen to do so.
As the post-COVID path of inflation becomes clearer, consensus data can be used to track the cumulative credit impact
on industries, sectors and individual companies.
6. Conclusion
As parts of the global economy begin to recover from the COVID pandemic, it is becoming clear that supply chains have
suffered considerable disruption. Many of the pre-COVID links between manufacturers, their suppliers, and their
customers have been weakened or broken. Chains are beginning to re-assemble, with more emphasis on risk control
through diversification (i.e., multiple suppliers to mitigate credit risk) and local sources (to reduce delays and maximize
flexibility). “Just-in-Case” now trumps “Just-in-Time”.
Using case studies, this paper shows how CFOs, corporate treasurers and procurement heads can manage payables
and receivables risks in this new environment. With more than 30,000 Credit Consensus Ratings now available on
Bloomberg, it is possible to monitor credit risk across a much larger set of otherwise unrated customers and suppliers.
This data can also be used in aggregate form to detect sector turning points in credit cycles, and to finesse terms of
trade during periods of inflation uncertainty.
4 Unlike 1973 and 1979 when oil shocks were a major cause of inflation, in part because the global economy was much more oil dependent in that decade.
13
Collective Intelligence for Global Finance creditbenchmark.comWhitepaper | Payables & Receivables: Managing Post-COVID Trade Finance Risk
Appendix
It would be possible – with appropriate data and analytical resource – to extend the metrics used in both of these case
studies to cover full lists of suppliers and customers for all the major manufacturers. Herfindahl indices and
comparisons of credit distributions would show which firms were on the right or wrong side of credit risk compared
with their customers AND suppliers.
With supply chain details and consensus credit data both now available on Bloomberg, there is the intriguing possibility
for regulators of calculating full input-output analysis for sectors and economies, with the overlay of credit risk to
identify vulnerabilities throughout the various inter-linked supply chains of the main economies.
This approach has already been used to assess the impact of Covid on various sectors of individual economies 5.
More from Credit Benchmark
Credit Benchmark brings together internal credit risk views from 40+ of the world’s leading financial institutions to
provide credit consensus ratings and analytics on 57,000 corporates, financials, funds, and sovereigns, over 75% of
which are unrated. The contributions are anonymized, aggregated, and published twice monthly to provide an
independent, real-world measure of risk.
The data is available via the Credit Benchmark Web App, Excel add-in, flat file download, and third-party platforms
including Bloomberg. High level credit assessments on the single name constituents of the sectors mentioned in this
report can be accessed on CRPR or via CRDT .
Get in touch with us to request your free trial for Credit Benchmark Premium Data and Analytics on Bloomberg.
More of our original research and regular credit risk surveillance reports can be found on our website, including the
following monthly reports:
The Financial Counterpart Monitor provides a unique analysis of the changing creditworthiness of financial
institutions. The report, which covers banks, intermediaries, buy-side managers, and buy-side owners, summarizes
the changes in credit consensus of each group as well as their current credit distribution and count of entities that
have migrated from Investment Grade to High Yield.
The Industry Monitor shows the changing creditworthiness of a selection of industries and sectors. The report
shows the number of entities per category with a Credit Consensus Rating, their month-on-month changes in credit
distribution, and their transitioning credit quality.
Credit Consensus Indicators (CCIs). The CCI is an index of forward-looking credit opinions for US, UK and EU
Industrials. The CCI tracks the total number of upgrades and downgrades made each month by credit analysts to
chart the long-term trend in analyst sentiment for Industrials.
5Bonadio, B., Huo, Z., Levchenko, A. A., & Pandalai-Nayar, N. (2020). Global supply chains in the pandemic (No. w27224). National Bureau of Economic Research,
Giammetti, R., Papi, L., Teobaldelli, D., & Ticchi, D. (2020). The Italian value chain in the pandemic: the input–output impact of Covid-19 lockdown. Journal of Industrial and
Business Economics, 47(3), 483-497.
Fan, X. M., & Liu, H. G. (2021). Global supply chain shifting: A macro sense of production relocation based on multi-regional input-output table. Economic Modelling, 94,
672-680.
Haddad, E. A., Perobelli, F. S., & de Araújo, I. F. (2020). Input-output analysis of COVID-19: methodology for assessing the impacts of lockdown measures. FEA/USP.
Santos, J. (2020). Using input-output analysis to model the impact of pandemic mitigation and suppression measures on the workforce. Sustainable Production and
Consumption, 23, 249-255.
14
Collective Intelligence for Global Finance creditbenchmark.comDavid Carruthers Head of Research david.carruthers@creditbenchmark.com Barbora Stepankova Research Director barbora.stepankova@creditbenchmark.com Phoebe Farrer Research Analyst phoebe.farrer@creditbenchmark.com www.creditbenchmark.com info@creditbenchmark.com twitter: @CreditBenchmark UK Office (London): 131 Finsbury Pavement London, EC2A 1NT +44 (0)20 7099 4322 US Office (New York): 12 East 49th Street, 11th Floor New York, NY 10017 +1 646 661 3383 RESTRICTED DISTRIBUTION: Credit Benchmark does not solicit any action based upon this report, which is not to be construed as an invitation to buy or sell any security or financial instrument. This report is not intended to provide personal investment advice and it does not take into account the investment objectives, financial situation and the particular needs of a particular person who may read this report.
You can also read