Penn National Gaming, Inc - Fourth Quarter 2021 Earnings Presentation February 3, 2022
←
→
Page content transcription
If your browser does not render page correctly, please read the page content below
.
Penn National Gaming, Inc
Fourth Quarter 2021
Earnings Presentation

February 3, 2022

                            1
Forward-Looking Statements
This presentation contains “forward-looking statements” within the meaning of the Private Securities Litigation Reform Act of 1995. These statements can be identified by the use of forward-looking
terminology such as “expects,” “believes,” “estimates,” “projects,” “intends,” “plans,” “goal,” “seeks,” “may,” “will,” “should,” or “anticipates” or the negative or other variations of these or similar
words, or by discussions of future events, strategies or risks and uncertainties. Specifically, forward-looking statements include, but are not limited to, statements regarding: 2022 net revenues and
Adjusted EBITDAR guidance ranges and the assumptions provided regarding the guidance, including the scale and timing of investments in technology; the Company's anticipated share
repurchases; the Company’s expectations of future results of operations and financial condition, including the anticipated strategic plan, growth and profitability of the Interactive segment and the
benefits gained by executing on the Company’s omni-channel and media strategy; the Company’s expectations with regard to the impact of competition in online sports betting, iGaming and
retail/mobile sportsbooks; the Company’s launch of its Interactive segment’s products in new jurisdictions and enhancements to existing Interactive segment products, including the transition to
theScore’s proprietary risk and trading platform in Ontario, the integration of the Barstool Sportsbook into theScore mobile app in the U.S. and the migration of the Barstool Sportsbook to theScore’s
player account management trading platforms; the Company’s expectations with regard to its future investments in Barstool Sports and the future success of its products; the Company's
expectations with respect to the integration and synergies related to the Company’s integration of theScore and Barstool Sports; the Company’s expectations for its properties and the potential
benefits of the cashless, cardless and contactless (“3Cs”) technology; the Company’s development projects; and the timing, cost and expected impact of planned capital expenditures on the
Company’s results of operations; the actions of regulatory, legislative, executive or judicial decisions at the federal, state or local level with regard to our business and the impact of any such actions.
Such statements are all subject to risks, uncertainties and changes in circumstances that could significantly affect the Company’s future financial results and business.

Accordingly, the Company cautions that the forward-looking statements contained herein are qualified by important factors that could cause actual results to differ materially from those reflected
by such statements. Such factors include, but are not limited to: (a) the ongoing impact of the COVID-19 pandemic on general economic conditions, capital markets, unemployment, consumer
spending and the Company’s liquidity, financial condition, supply chain, operations and personnel; (b) industry, market, economic, political, regulatory and health conditions; (c) disruptions in
operations from data protection breaches, cyberattacks, extreme weather conditions, medical epidemics or pandemics such as the COVID-19, and other natural or man-made disasters or
catastrophic events; (d) the Company’s ability to access additional capital on favorable terms or at all; (e) the availability of capital for the payment of debt service obligations or the repurchase of
shares; (f) the Company’s ability to remain in compliance with the financial covenants of its debt obligations; (g) the outcome of any legal proceedings that may be instituted against the Company
or its directors, officers or employees; (h) the impact of new or changes in current laws, regulations, rules or other industry standards; (i) the ability of the Company’s operating teams to drive revenue
and margins; (j) the impact of significant competition from other gaming and entertainment operations; (k) the Company’s ability to obtain timely regulatory approvals required to own, develop
and/or operate its properties, or other delays, approvals or impediments to completing its planned acquisitions or projects, construction factors, including delays, and increased costs; (l) the passage
of state, federal or local legislation that would expand, restrict, further tax, prevent or negatively impact operations in or adjacent to the jurisdictions in which the Company does or seek to do
business; (m) the effects of local and national economic, credit, capital market, housing, inflationary, and energy conditions on the economy in general and on the gaming, entertainment and
lodging industries in particular; (n) our ability to identify attractive acquisition and development opportunities (especially in new business lines) and to agree to terms with, and maintain good
relationships with partners and municipalities for such transactions; (o) the costs and risks involved in the pursuit of such opportunities and our ability to complete the acquisition or development of,
and achieve the expected returns from, such opportunities; (p) the risk of failing to maintain the integrity of our information technology infrastructure and safeguard our business, employee and
customer data (particularly as our Interactive segment grows); (q) with respect to new casinos, risks relating to its ability to achieve its expected budgets, timelines and investment returns; (r) the
Company may not be able to achieve the anticipated financial returns from the acquisition of “theScore”, including due to fees, costs and taxes in connection with the integration of theScore and
expansion of its betting and content platform; (s) there is significant competition in the interactive gaming market; (t) potential adverse reactions or changes to business or regulatory relationships
resulting from the acquisition of theScore or the investment in Barstool; (u) the ability of the Company to retain and hire key personnel; and (v) other factors as discussed in the Company’s Annual
Report on Form10-K for the year ended December 31, 2020, subsequent Quarterly Reports on Form 10-Q and Current Reports on Form 8-K, each as filed with the U.S. Securities and Exchange
Commission. The Company does not intend to update publicly any forward-looking statements except as required by law. In light of these risks, uncertainties and assumptions, the forward-looking
events discussed in this presentation may not occur.
                                                                                                                                                                                                                2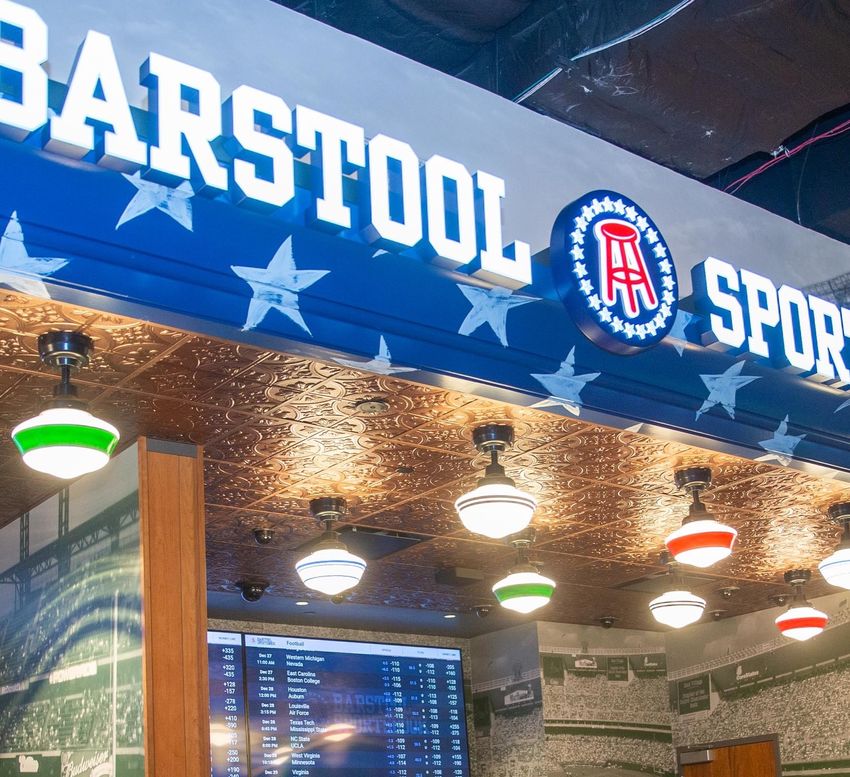
Non-GAAP Financial Measures
In addition to GAAP financial measures, management uses Adjusted EBITDA, Adjusted EBITDAR, Adjusted EBITDAR margin, Combined Revenues, Combined Adjusted EBITDA, Combined Adjusted EBITDAR and Combined Net Income as non-
GAAP financial measures. These non-GAAP financial measures should not be considered a substitute for, nor superior to, financial results and measures determined or calculated in accordance with GAAP. Each of these non-GAAP financial
measures is not calculated in the same manner by all companies and, accordingly, may not be an appropriate measure of comparing performance among different companies. We define Adjusted EBITDA as earnings before interest
expense, net; income taxes; depreciation and amortization; stock-based compensation; debt extinguishment and financing charges; impairment losses; insurance recoveries, net of deductible charges; changes in the estimated fair value
of our contingent purchase price obligations; gain or loss on disposal of assets, the difference between budget and actual expense for cash-settled stock-based awards; pre-opening expenses; and other. Adjusted EBITDA is inclusive of
income or loss from unconsolidated affiliates, with our share of non-operating items (such as interest expense, net; income taxes; depreciation and amortization; and stock-based compensation expense) added back for Barstool Sports, Inc.
(“Barstool Sports”) and our Kansas Entertainment, LLC joint venture. Adjusted EBITDA is inclusive of rent expense associated with our triple net operating leases (the operating lease components contained within our triple net master lease
dated November 1, 2013 with Gaming and Leisure Properties, Inc. (“GLPI”) and the triple net master lease assumed in connection with our acquisition of Pinnacle Entertainment, Inc. (primarily land), our individual triple net leases with GLPI for
the real estate assets used in the Operation of Tropicana Las Vegas Hotel and Casino, Inc. and Hollywood Casino at Meadows Racetrack, and our individual triple net leases with VICI Properties Inc. (“VICI”) for the real estate assets used in
the operations of Margaritaville Casino Resort and Greektown Casino-Hotel. Although Adjusted EBITDA includes rent expense associated with our triple net operating leases, we believe Adjusted EBITDA is useful as a supplemental measure in
evaluating the performance of our consolidated results of operations. Adjusted EBITDA has economic substance because it is used by management as a performance measure to analyze the performance of our business, and is especially
relevant in evaluating large, long-lived casino-hotel projects because it provides a perspective on the current effects of operating decisions separated from the substantial nonoperational depreciation charges and financing costs of such
projects. We present Adjusted EBITDA because it is used by some investors and creditors as an indicator of the strength and performance of ongoing business operations, including our ability to service debt, and to fund capital expenditures,
acquisitions and operations. These calculations are commonly used as a basis for investors, analysts and credit rating agencies to evaluate and compare operating performance and value companies within our industry. In order to view the
operations of their casinos on a more stand-alone basis, gaming companies, including us, have historically excluded from their Adjusted EBITDA calculations of certain corporate expenses that do not relate to the management of specific
casino properties. However, Adjusted EBITDA is not a measure of performance or liquidity calculated in accordance with GAAP. Adjusted EBITDA information is presented as a supplemental disclosure, as management believes that it is a
commonly-used measure of performance in the gaming industry and that it is considered by many to be a key indicator of the Company’s operating results.

We define Adjusted EBITDAR as Adjusted EBITDA (as defined above) plus rent expense associated with triple net operating leases (which is a normal, recurring cash operating expense necessary to operate our business). Adjusted EBITDAR is
presented on a consolidated basis outside the financial statements solely as a valuation metric. Management believes that Adjusted EBITDAR is an additional metric traditionally used by analysts in valuing gaming companies subject to
triple net leases since it eliminates the effects of variability in leasing methods and capital structures. This metric is included as supplemental disclosure because (i) we believe Adjusted EBITDAR is traditionally used by gaming operator
analysts and investors to determine the equity value of gaming operators and (ii) Adjusted EBITDAR is one of the metrics used by other financial analysts in valuing our business. We believe Adjusted EBITDAR is useful for equity valuation
purposes because (i) its calculation isolates the effects of financing real estate; and (ii) using a multiple of Adjusted EBITDAR to calculate enterprise value allows for an adjustment to the balance sheet to recognize estimated liabilities arising
from operating leases related to real estate. However, Adjusted EBITDAR, when presented on a consolidated basis, is not a financial measure in accordance with GAAP and should not be viewed as a measure of overall operating
performance or considered in isolation or as an alternative to net income because it excludes the rent expense associated with our triple net operating leases and is provided for the limited purposes referenced herein. Adjusted EBITDAR
margin is defined as Adjusted EBITDAR on a consolidated basis (as defined above) divided by revenues on a consolidated basis. Adjusted EBITDAR margin is presented on a consolidated basis outside the financial statements solely as a
valuation metric.

The Company defines Combined Revenues, as revenues of Penn National, Greektown Casino-Hotel (“Greektown”), Hollywood Casino Perryville (“Perryville”), and Sam Houston Race Park and Valley Race Park (“Sam Houston”), assuming
that Greektown, Perryville, and Sam Houston (collectively, the “Acquired Properties”) were a part of Penn National during the historical periods beginning on January 1, 2019, but excluding revenues of Resorts Casino Tunica (“Tunica”),
Hollywood Casino York (“York”), Hollywood Casino Morgantown (“Morgantown”) and theScore as if not a part of Penn National during the historical periods beginning on January 1, 2019. The Company defines Combined Adjusted EBITDA
as Adjusted EBITDA (as defined above) of Penn National and the Acquired Properties, assuming that the Acquired Properties were a part of Penn National during the historical periods beginning on January 1, 2019, but excluding Adjusted
EBITDA of Tunica, York, Morgantown and theScore as if not a part of Penn National during the historical periods beginning on January 1, 2019. The Company defines Combined Adjusted EBITDAR as Adjusted EBITDAR (as defined above) of
Penn National and the Acquired Properties, assuming that the Acquired Properties were a part of Penn National during the historical periods beginning on January 1, 2019, but excluding Adjusted EBITDAR of Tunica, York, Morgantown and
theScore as if not a part of Penn National during the historical periods beginning on January 1, 2019. The Company defines Combined Net Income as net income of Penn National the Acquired Properties, assuming that the Acquired
Properties were a part of Penn National during the historical periods beginning on January 1, 2019, but excluding net income of Tunica, York, Morgantown and theScore as if net income was not a part of Penn National during the historical
periods beginning on January 1, 2019. Management believes that presenting Combined Revenues, Combined Adjusted EBITDA, Combined Adjusted EBITDAR and Combined Net Income for the three and twelve month period ended
December 31, 2019 is useful for investors to evaluate the Company’s performance for the three and twelve month period ended December 31, 2021. These results do not reflect any cost savings from potential operating efficiencies or
associated costs to achieve such savings or synergies that are expected to result from these transactions. The Company does not provide a reconciliation of forward-looking Adjusted EBITDAR because it is unable to predict with reasonable
accuracy the value of certain adjustments that may significantly impact the Company’s results, including adjustments that can be impacted by rent expense and interest expense associated with our triple net leases, re-measurement of
cash-settled stock-based awards, and income tax benefit (expense), which are dependent on future events that are out of the Company’s control or that may not be reasonably predicted.

                                                                                                                                                                                                                                                           3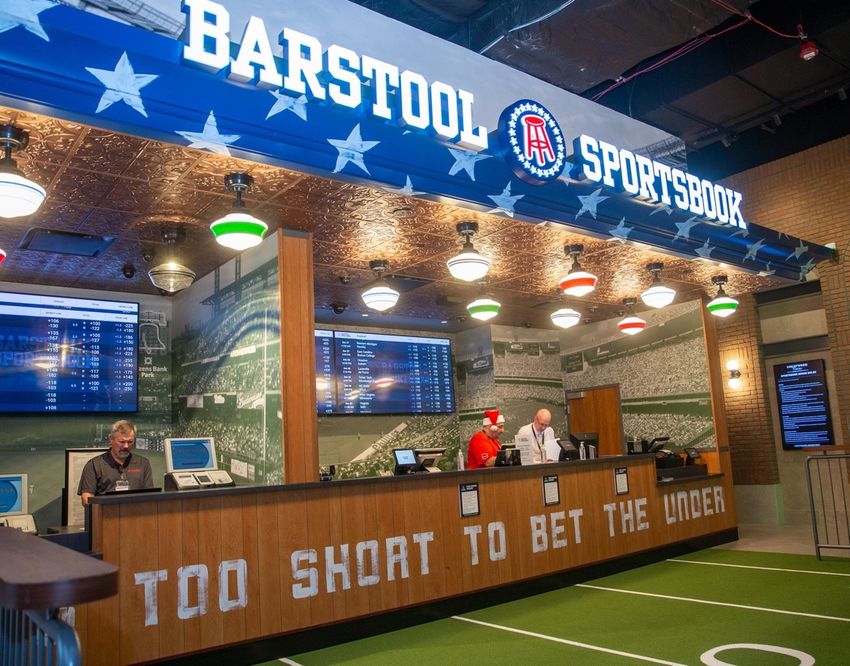
Positioned for Growth
       PENN’s highly differentiated omni-channel strategy presents multiple growth opportunities.

   Strong Free                Interactive             Dynamic Media                   Financial
   Cash Flow                    Growth                  Businesses                    Flexibility

Our leading portfolio         Our interactive            Our new media
                                                                                  Our strong balance
 of regional casinos         business is growing      businesses, anchored
                                                                                  sheet positions us to
   are generating           rapidly, with a near       by theScore and our
                                                                                     pursue growth
significant free cash           term path to          investment in Barstool
                                                                                   opportunities and
 flow to fund future      profitability and sizable    Sports, provide new
                                                                                    return capital to
growth opportunities        long-term potential        channels for growth
                                                                                      shareholders
                                                           and cross-sell

                                                                                                          4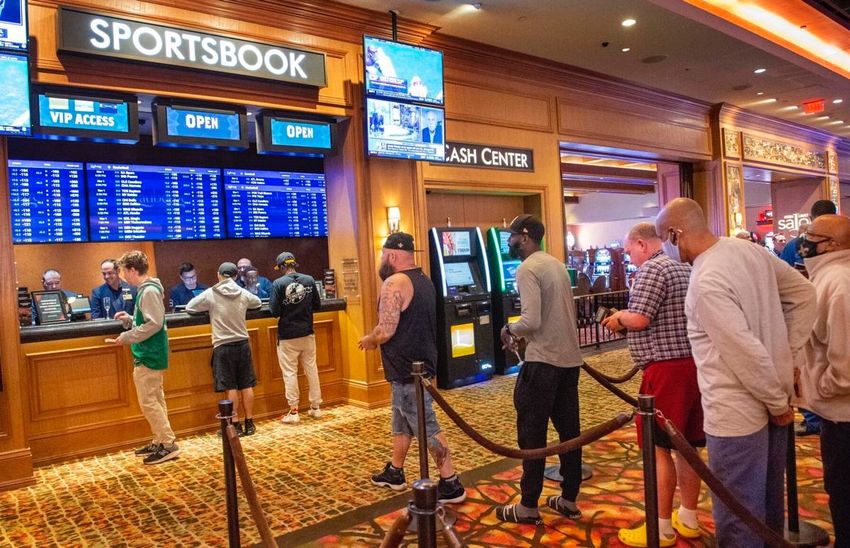
4Q Summary Results and Outlook
Our fourth quarter revenues and Adjusted EBITDAR exceeded both 2020 and 2019 levels, as our best-in-class
           operating teams continue to deliver impressive results despite the ongoing pandemic.

             Revenues                        Net Income                   Net Income Margin

               $1.6                           $44.8
              billion                         million
                                                                                 2.8%

           Adj. EBITDAR                      Adj. EBITDA                  Adj. EBITDAR Margin

              $480.5                           $369.0
              million                          million
                                                                                30.6%

           We have reinstated guidance with a range of 2022 net revenues of $6.07 billion to
                  $6.39 billion and Adjusted EBITDAR of $1.85 billion to $1.95 billion
                                                                                                        5
Q4 2021 Same Store Highlights
Same Store Revenues and Adjusted EBITDAR grew 13% and 20%, respectively, over 2019 levels.

   Revenues                                                                                       Net Income                                                                                   Adjusted EBITDAR1
   ($ in millions)                                                                                ($ in millions)                                                                              ($ in millions)

                                              $1,540                                                                                        $66
                                                                                                                                                                                                                                          $486
                 $1,365

                                              +13%                                                                                                                                                              $403                   +20%

                                                                                                              $(91)
             Q4 2019                      Q4 2021                                                         Q4 2019                      Q4 2021                                                          Q4 2019                      Q4 2021

1. 4Q 2021 Adjusted EBITDA was $374.3 million compared to 4Q 2019 Adjusted EBITDA of $307.8 million.
Note: Q4 2019 Revenues, Net Income, Adjusted EBITDA, and Adjusted EBITDAR include proforma adjustments for Hollywood Casino Perryville (“Perryville”) and Sam Houston Race Park and Valley Race Park (“Sam Houston”). The operating results of Perryville and Sam Houston
were derived from historical financial information. The operating results were adjusted to conform to Penn’s methodology of allocating certain corporate expenses to properties. Q4 2019 metrics are referred to as “Combined Revenues,” “Combined Net Income,” “Combined
Adjusted EBITDA,” and “Combined Adjusted EBITDAR.” Q4 2021 results reflect a gross-up of licensing revenue and expenses with respect to reimbursement revenue derived from market access skin arrangements, of which $51.0 million was related to gaming taxes. There is no
P&L impact as a result of the aforementioned gross-up related to gaming taxes. Q4 2021 Net Revenues, Adjusted EBITDAR and Adjusted EBITDA are net of Hollywood Casino York, Hollywood Casino Morgantown, and the Score.                                                       6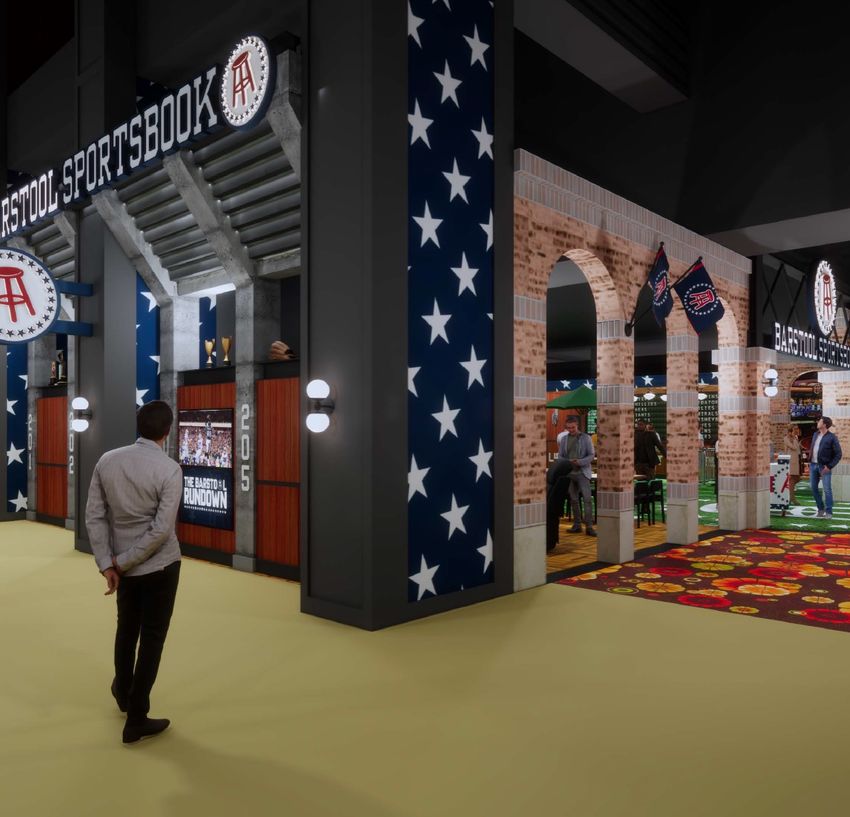
Share Repurchase Plan
We generated record free cash flow in 2021 and ended the year with our strongest balance sheet
    in history, which positions us to be opportunistic in an extremely dynamic marketplace.

                Share Repurchase Plan                      Lease Adj. Net Leverage
                                                           ($ in millions)

                                                                             7.0x
      On February 1, 2022, the Company’s Board
     approved a share repurchase authorization of                 5.5x
        up to $750 million over three years. This                                   4.1x
        program reflects our confidence in the
     Company’s long-term prospects and provides
     a tool for both opportunistic repurchases and
           to offset dilution from stock-based
        compensation and other equity grants.
                                                                 2019        2020   2021

                                                                                             7
Interactive Segment Results
 In the fourth quarter of 2021, we created a new operating segment for Interactive, which
               delivered impressive results in highly competitive environment.

                                                     Interactive Segment Notes
                                           • Our Interactive segment includes the operating results of
                                             Penn Interactive (including the Barstool Sportsbook and
                                             Casino), theScore and our proportionate share of earnings
                                             attributable on our investment in Barstool Sports, Inc.
                                           • In 4Q21, the segment delivered a lower-than-expected
  Revenues           Adjusted EBITDA         EBITDA loss despite a frenzied competitive environment
                                           • We anticipate an EBITDA loss of approximately $50 million
                                             from this segment in 2022 as we continue to scale
  $157.6                 $(5.9)              operations and infrastructure in anticipation of bringing
                                             our technology in-house and launching in new
  million                million             jurisdictions, with meaningful positive contributions
                                             expected in 2023 as we begin to realize the benefits of our
                                             wholly-owned tech stack

                                                                                                           8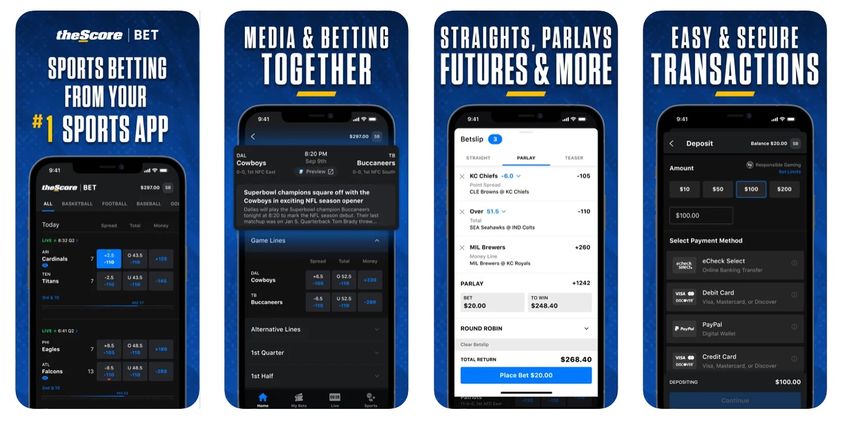
Interactive Roadmap
    Recent and         Transition to                                                          Barstool
                                             theScore Media         Barstool Put/Call
    Anticipated         theScore’s                                                        Sportsbook Tech
                                                Integration           Trigger Date
     Launches        Trading Platform                                                        Migration

•   Louisiana (OSB                                                                           Migration of the
                       The transition to      Integration of the     Acquisition of the
    launched on                                                                            Barstool Sportsbook
                          theScore’s         Barstool Sportsbook       remainder of
    Jan. 28)                                                                              to theScore’s player
                     proprietary risk and   into theScore mobile      Barstool Sports
                                                                                                 account
•   Ontario (OSB     trading platform in    media app in the U.S.   would unlock value
                                                                                           management and
    and iCasino)         Ontario will        will drive increased     of high growth
                                                                                          trading platforms will
                          complete              engagement,           media, sports,
•   Maryland (OSB)                                                                        provide the benefits
                     theScore’s vertical         revenue and        entertainment and
                                                                                           of a fully integrated
                       tech integration            retention          lifestyle brand
•   Ohio (OSB)                                                                                 tech solution

       2022              Q3 2022                 2H 2022                Q1 2023               Q3 2023

                                                                                                                   9
Technology Investments
We are making meaningful investments in technology that will enhance the customer experience
     and improve efficiencies at our land-based properties and in our interactive products.

             Technology Highlights

  •   Cutting edge “3Cs” technology that is
      changing how our customers interact at our
      properties
  •   Deep pool of talented product and
      engineering teams to support our fully
      integrated media, betting and iCasino
      products
  •   Creative in-house content studio that is
      developing customized and highly engaging
      entertainment

                                                                                          10
Hollywood Casino Morgantown
On December 22, 2021, we officially opened Hollywood Casino Morgantown, a state-of-the art
facility featuring our cutting edge cardless, cashless and contactless technology.
Key Features
• 750 of the latest slot machines
• 30 table games, including
blackjack, craps, roulette and
baccarat
• Asian gaming and dining area
• Modern Barstool Sportsbook
with fully integrated food and
beverage experience with
indoor/outdoor seating
• Tony Luke’s cheesesteaks and
entertainment lounge and bar
11Growing Ecosystem
Our ecosystem has continued to expand with the acquisition of theScore as well as continued
growth of Barstool Sports and our mychoice database.
25m
Total Members
+7%
144m
Total Followers
Year-over-Year
Across Social Media*
+25%
Year-over-Year
4.2m
Monthly Average Users
+7%
Year-over-Year
* Total followers across all accounts and platforms as of December 15, 2021, including Instagram (64.0m), Twitter (33.2m),
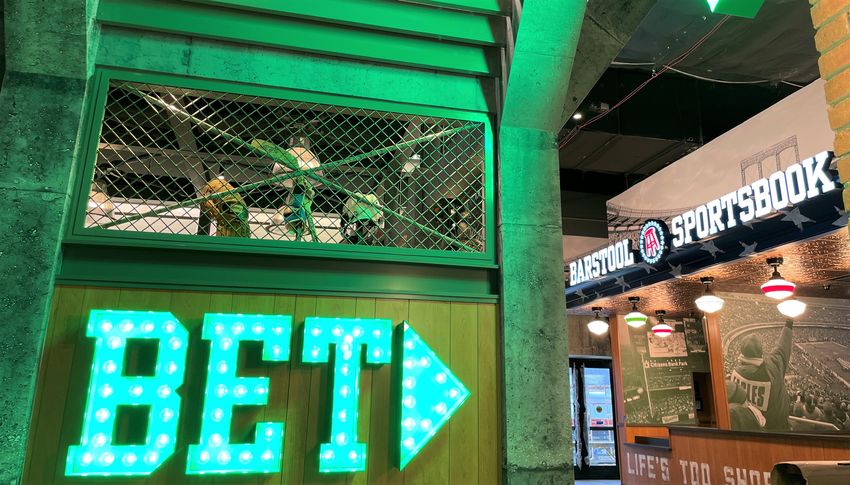
TikTok (31.9m), Facebook (9.2m) and Snapchat(6.7m). 12Leading Retail Sportsbooks
Our growing retail sportsbook operations are highly profitable, while providing significant
opportunities for cross-sell at our casinos and to our online products.
2021 Total Handle 2021 GGR
$775M (+98% y/y)
$85M
(11% Hold Rate)
Total Properties Total Market Share
24 12%
(+8 Properties in 2021) Est. 2021 National GGR
Market Share (Ex. Nevada)
13Louisiana Retail Sportsbook Launch
Retail sportsbook operations at our five casinos in Louisiana have generated a significant share of
the state’s handle and revenue, with a Barstool re-branding in process at our signature locations.
Handle Market Share
58%
Nov – Dec 21
GGR Market Share
53%
Nov – Dec 21
14Barstool Sportsbook Mobile Growth
The Barstool Sportsbook’s mobile handle and revenue increased significantly in the fourth quarter,
aided by new state launches and the reactivation of football customers.
Handle Gross Gaming Revenue
($ in millions) ($ in millions)
$1,059 $69
$29 $30
$409
$349 $331 $22
Q1 Q2 Q3 Q4 Q1 Q2 Q3 Q4
*Revenue results cash basis 15Barstool Sportsbook Market Share
Our profit focused approach has led to sizable gains in net gaming revenue market share in
Pennsylvania and Michigan, two states that publicly report promotional expense.
Handle Market Share NGR Market Share
Pennsylvania Michigan Pennsylvania Michigan
18.4%
15.2%
10.0% 10.6%
8.9% 9.5% 12.5%
8.6% 8.7%
7.2%
6.0%
Oct21 Nov21 Dec21 Oct21 Nov21 Dec21 Oct21 Nov21 Dec21 Oct21 Nov21 Dec21
-6.7%
16Disciplined Marketing Approach
Penn Interactive has achieved impressive growth in a highly competitive environment despite
spending a fraction of our competitors on marketing.
Marketing as % of GGR Marketing as % of NGR
104.7%
63.7%
29.9%
17.6%
Barstool Sportsbook Available
Competitor Average Barstool Sportsbook Available
Competitor Average
Competitor Competitor
Average Average
* Marketing spend for competitors is based on publicly available information for Rush Street Interactive, DraftKings and PointsBet through Q3 2021. The Barstool Sportsbook marketing
spend includes Q4 across all states and the percentage calculated excludes retail and skin revenue. 17Sports Betting Customer Profitability
Our low customer acquisition costs and high retention rates provide a highly favorable return on
investment from online sports betting that positions us for long-term success.
Cumulative Net Contribution Margin Payback
2.2x
1.4x
2.2x
One Year Return on
0.5x Investment on Sports
Betting Only
Our return on investment
is even higher in states
with iCasino
Average Customer Q1 Q2 Q3 Q4
Contribution margin reflects net revenue less variable costs
Acquisition Cost including taxes, third party expenses and marketing. 18Our OSB Structural Advantages
Our integrated media approach to marketing and our leading casino footprint for market access
provide a path to outsized long-term profitability in online sports betting.
Illustrative Contribution Margin
Other Sportsbook Operators
Net Gaming Market ing Spend Taxes & Volumetric Net Market Access Contribution Net Gaming Market ing Spend Taxes & Volumetric Net Market Access Contribution
Revenue Costs Fees Margin Revenue Costs Fees Margin
Lower marketing spend Market access savings Long-Term
Structural
Advantages
due to organic customer acquisition
and recurring promotion from
Barstool Sports and theScore
+ from casino footprint, while excess
skins provide recurring and high
margin revenue streams
= Margin
Advantages
19Barstool iCasino Growth
Our Barstool iCasino has shown strong growth in revenue and MAUs since the beginning
of football season as we have continued to add new games and product features.
Gross Gaming Revenue
($ in millions) $11.6
$10.7
$9.2 $9.5
$5.8
$5.1
Jul-21 Aug-21 Sep-21 Oct-21 Nov-21 Dec-21
*Revenue results accrual basis
GGR MAUs 20In-House Game Studio Update
Our Penn Game Studios division successfully launched its first two in-house developed games,
Barstool Blackjack and Barstool Slots, which have been extremely well received.
Future Game Roadmap
• Barstool Blackjack is live in
NJ, MI and WV
• Barstool Slots is live in NJ
and WV, with MI planned
for later this quarter
• These games have
generated over 20% of
our iCasino handle since
launch, while helping to
facilitate cross-sell and
reduce third party costs
21theScore’s Media Growth
theScore’s media business produced significant revenue growth and
increased user engagement in the quarter.
Media Revenue Growth
Record media revenue driven by advertisers across North
America eager to reach our broad and active audience:
+32%
Q4 Y/Y Growth
+76%
2021 Y/Y Growth
User Growth and Engagement
Strong media app performance as engagement continues to
grow across our large and loyal user base
• 1.8 billion user sessions, up 30% vs. 2020
• Users opened the app an average of 143 times each
month, up 22% year-over-year
• 4.2 million average monthly active users on the media
app, up 7% vs. 2020
Results include revenue earned and media metrics prior to theScore being acquired by Penn National on Oct. 19, 2021 22Barstool Sports Bars
The first Barstool-branded sports bar opened on January 8, 2022 in the River North area of
Chicago, representing a further extension of our unique omni-channel strategy.
23ESG Update
Diversity, Equity and Inclusion
• We committed more than $4 million to fund STEM
scholarships and internship opportunities at
Historically Black Colleges and Universities
• We committed another $1 million to our Diversity
Scholarship Program for the children of team
members and are now accepting applications
for the 2021-2022 school year
• Our Diversity Committee created an emerging
leaders development program to focus on hourly
and early career team members wanting to
grow into a leadership position
Environment
We reduced annual Kwh consumption by 10%,
equaling 42k tons of greenhouse gas elimination,
while also prioritizing sustainable food production
and supply chains through fair trade, hormone-
free and reduced antibiotic procurement
24ESG Update (cont.)
Community
• Barstool Sportsbook’s Army Navy Game promo, “Viva la
Troops,” raised $200k for Semper Fi Fund and Fisher
House to support veterans
• We are approaching 100,000 customers enrolled in our
myheroes special loyalty program for veterans, active
duty and first responders
• We raised $100,000 during the test nights for Hollywood
Casino Morgantown with the proceeds supporting the
United Way of Berks County, the Jared Yoder
Foundation, which runs a homeless veteran's shelter,
and a local food pantry
Responsible Gaming
• We joined American Gaming Association’s “Have A
Game Plan” initiative, a nationwide consumer
education campaign on the fundamentals of
responsible sports betting
25Appendices
26GAAP to Non-GAAP Reconciliation
For the three months ended For the year ended
December 31, December 31,
($ in millions, unaudited) 2021 2020 2019 2021 2020 2019
Net income (loss) $44.8 $12.7 ($92.9) $420.5 ($669.1) $43.1
I ncome tax expense (benefit) 8.5 7.1 (10.0) 118.6 (165.1) 43.0
Loss on early extinguishment of debt - 1.2 - - 1.2 -
I ncome from unconsolidated affiliates (10.9) (6.4) (6.7) (38.7) (13.8) (28.4)
I nterest expense, net 143.1 136.1 133.7 561.7 543.2 534.2
Other expenses (income) 40.6 (31.1) (12.8) (2.5) (106.6) (20.0)
Operating income (loss) $226.1 $119.6 $11.3 $1,059.6 ($410.2) $571.9
Stock-based compensation 13.2 2.8 4.5 35.1 14.5 14.9
Cash-settled stock-based awards v ariance (13.1) 20.5 7.2 1.2 67.2 0.8
Loss (gain) on disposal of assets 1.0 4.7 (2.8) 1.1 (29.2) 5.5
Contingent purchase price - 0.3 - 1.9 (1.1) 7.0
Pre-opening expenses (1) 2.6 0.3 6.8 5.4 11.8 22.3
Depreciation and amortization 97.6 91.4 97.8 344.5 366.7 414.2
I mpairment losses - 7.3 173.1 - 623.4 173.1
I nsurance recov eries, net of deductible charges - - (1.5) - (0.1) (3.0)
I ncome from unconsolidated affiliates 10.9 6.4 6.7 38.7 13.8 28.4
(2)
Non-operating items of equity method inv estments 1.7 1.5 0.9 7.7 4.7 3.7
(1)(3)
Other expenses 29.0 1.1 - 44.8 13.5 -
Adjusted EBITDA $369.0 $255.9 $304.0 $1,540.0 $675.0 $1,238.8
Rent expense associated with triple net operating leases 111.5 109.5 95.4 454.4 419.8 366.4
Adjusted EBITDAR $480.5 $365.4 $399.4 $1,994.4 $1,094.8 $1,605.2
Net income (loss) margin 2.8% 1.2% (6.9)% 7.1% (18.7)% 0.8%
Adjusted EBI TDAR margin 30.6% 35.6% 29.8% 33.8% 30.6% 30.3%
(1) During 2019, 2020 and during the first quarter of 2021, acquisition costs were included within pre-opening and acquisition costs. Beginning with the quarter ended June 30, 2021, acquisition costs are presented as part of other expenses.
(2) Consists principally of interest expense, net; income taxes; depreciation and amortization; and stock-based compensation expense associated with Barstool Sports, Inc. and our Kansas Entertainment, LLC joint venture. We record our portion of
Barstool Sports, Inc.'s net income or loss, including adjustments to arrive at Adjusted EBITDAR, one quarter in arrears.
(3) Consists of non-recurring acquisition and transaction costs, finance transformation costs associated with the implementation of our new Enterprise Resource Management system and non-recurring restructuring charges (primarily severance)
associated with a company-wide initiative, triggered by the COVID-19 pandemic, designed to (i) improve the operational effectiveness across our property portfolio; (ii) improve the effectiveness and efficiency of our Corporate functional support area. 27GAAP to Non-GAAP Reconciliation
For the three months ended For the year ended
December 31, December 31,
($ in millions, unaudited) 2021 2019 2021 2019
Net income (loss) $44.8 ($92.9) $420.5 $43.1
I ncome tax expense (benefit) 8.5 (10.0) 118.6 43.0
I ncome from unconsolidated affiliates (10.9) (6.7) (38.7) (28.4)
I nterest expense, net 143.1 133.7 561.7 534.2
Other expenses (income) 40.6 (12.8) (2.5) (20.0)
Operating income $226.1 $11.3 $1,059.6 $571.9
Pro-forma EBI TDAR Adjustments (1) 5.3 3.8 14.5 40.8
Stock-based compensation 13.2 4.5 35.1 14.9
Cash-settled stock-based awards v ariance (13.1) 7.2 1.2 0.8
Loss (gain) on disposal of assets 1.0 (2.8) 1.1 5.5
Contingent purchase price - - 1.9 7.0
Pre-opening expenses (2) 2.6 6.8 5.4 22.3
Depreciation and amortization 97.6 97.8 344.5 414.2
I mpairment losses - 173.1 - 173.1
I nsurance recov eries, net of deductible charges - (1.5) - (3.0)
I ncome from unconsolidated affiliates 10.9 6.7 38.7 28.4
(3)
Non-operating items of equity method inv estments 1.7 0.9 7.7 3.7
(2)(4)
Other expenses 29.0 - 44.8 -
(5)
Combined Adjusted EBITDA $374.3 $307.8 $1,554.5 $1,279.6
Rent expense associated with triple net operating leases 111.5 95.4 454.4 387.5
(5)
Combined Adjusted EBITDAR $485.8 $403.2 $2,008.9 $1,667.1
(1) Pro-forma EBITDAR Adjustments include (i)the operating results of Perryville, Sam Houston, and Greektown which were derived from historical financial information and were adjusted to conform to Penn National’s methodology of allocating certain corporate
expenses to properties; (ii) adjustments to assume that Resorts Casino Tunica was not a part of Penn National during the historical periods beginning on January 1, 2019, as Resorts Casino Tunica ceased operations on June 30, 2019; (iii) adjustments to exclude the
operating results of theScore, which was acquired on October 19, 2021 and to exclude York and Morgantown, which opened August 12, 2021 and December, 22, 2021 respectively.
(2) During 2019 and during the first quarter of 2021, acquisition costs were included within pre-opening and acquisition costs. Beginning with the quarter ended June 30, 2021, acquisition costs are presented as part of other expenses.
(3) Consists principally of interest expense, net; income taxes; depreciation and amortization; and stock-based compensation expense associated with Barstool Sports, Inc. and our Kansas Entertainment, LLC joint venture. We record our portion of Barstool Sports,
Inc.'s net income or loss, including adjustments to arrive at Adjusted EBITDAR, one quarter in arrears.
(4) Consists of non-recurring acquisition and transaction costs, finance transformation costs associated with the implementation of our new Enterprise Resource Management system and non-recurring restructuring charges (primarily severance) associated with a
company-wide initiative, triggered by the COVID-19 pandemic, designed to (i) improve the operational effectiveness across our property portfolio; (ii) improve the effectiveness and efficiency of our Corporate functional support area.
(5) See the “Non-GAAP Financial Measures” section above for more information, including the definition of Combined Adjusted EBITDA and Combined Adjusted EBITDAR.
28GAAP to Non-GAAP Reconciliation
(1)
Penn National, as Reported Pro-forma Adjustments Combined
(in millions, unaudited) For the three months ended December 31, 2019
Rev enues $1,341.2 23.4 $1,364.6
Net I ncome ($92.9) 1.7 ($91.2)
(1)
Penn National, as Reported Pro-forma Adjustments Combined
(in millions, unaudited) For the year ended December 31, 2019
Rev enues $5,301.4 226.7 $5,528.1
Net I ncome $43.1 26.7 $69.8
(1)
Penn National, as Reported Pro-forma Adjustments Combined
(in millions, unaudited) For the three months ended December 31, 2021
Rev enues $1,572.5 (32.5) $1,540.0
Net I ncome $44.8 21.6 $66.4
(1)
Penn National, as Reported Pro-forma Adjustments Combined
(in millions, unaudited) For the year ended December 31, 2021
Rev enues $5,905.0 12.8 $5,917.8
Net I ncome $420.5 33.1 $453.6
(1) Pro-forma Adjustments include (i)the operating results of Perryville, Sam Houston, and Greektown which were derived from historical financial information and were adjusted to conform to Penn National’s methodology of allocating certain
corporate expenses to properties; (ii) adjustments to assume that Resorts Casino Tunica was not a part of Penn National during the historical periods beginning on January 1, 2019, as Resorts Casino Tunica ceased operations on June 30, 2019; (iii)
adjustments to exclude the operating results of theScore, which was acquired on October 19, 2021 and to exclude York and Morgantown, which opened August 12, 2021 and December, 22, 2021 respectively. 29You can also read