Pheasant News and Notes - January 2021 - The National Pheasant Plan
←
→
Page content transcription
If your browser does not render page correctly, please read the page content below
Pheasant News and Notes
January 2021

Trivia Question
Of the states with at least 100,000 acres currently enrolled in CRP, which has lost the highest percentage
of its peak enrollment in “traditional” CRP (that is, excluding CRP Grasslands enrollments)?

Farm Bill and USDA News
The 2021 general CRP signup is now underway through February 12th, although the state and county
offices still need training and software before they can start officially entering offers. USDA also
sweetened the pot for continuous CRP offers by upping some incentive payments, which is welcomed.
However, as we have said before, signups are going to have to be spectacularly successful if we are
going to climb out of the hole we are currently in, and large acreage expirations in 2021 and 2022 are
looming (see the table at the end of this document).

Jim Inglis and Bethany Erb did a great job summarizing some recent conservation discussions in pre-riot
D.C.; you can take a look here.

Notes from Around the Pheasant Range
The Technical Committee and I have been steadily working on the second edition of the National
Pheasant Plan. For me, part of that work has included thinking about the economic aspects of pheasant
management from the perspective of an agency or organization hoping to maximize their return-on-
investment. Two key questions in this area are 1) how do we maximize the pheasants produced per
dollar spent (or acre of habitat created), and 2) how do we maximize the hunters retained per pheasant
produced?

Working through these issues has been interesting in terms of challenging what I thought I knew about
pheasant-habitat relationships. The Plan will go into more detail, but I thought I would share a few
graphics related to those questions.

First, we know that more habitat equals more pheasants, but how populations rise and fall as habitat
increases and decreases can have a big impact on ROI. I assumed that agencies can easily figure out
how much different options cost, so it is the “birds produced per acre” and “hunters retained per
pheasant produced” variables that are of primary concern.

Figure 1 shows three hypothetical relations (models) depicting population size and proportion of habitat
in the landscape. All adhere to the “more habitat equals more pheasants” rule, but differences in
abundance per increment of habitat vary. They are all configured to hit a maximum abundance at 50%
habitat, with a fifty-fold difference in abundance from 1 to 50%.
Figure 1.
                               500
   Predicted Population Size

                               400

                               300

                               200

                               100

                                 0
                                      1   5   10       15    20      25     30     35      40   45   50
                                                      Percent of Landscape in Grassland

                                                   Linear      Quadratic        Logistic

If we convert these curves into birds per acre of habitat (not just birds per acre), the curves diverge
considerably (Figure 2). I used an initial density of 0.1 birds per acre of habitat at 1% habitat in the
landscape. You will notice that the linear model predicts the same birds per acre of habitat regardless of
baseline habitat percentage, suggesting ROI is constant regardless of baseline landscape condition
(assuming costs are flat). But the other models predict big differences in ROI, particularly at lower
percentages of habitat in the landscape.

Figure 2.
                               0.20
                               0.18
                               0.16
   Birds / Grassland Acre

                               0.14
                               0.12
                               0.10
                               0.08
                               0.06
                               0.04
                               0.02
                               0.00
                                      1   5   10        15     20     25     30     35     40   45   50
                                                       Percent of Landscape in Grassland

                                                   Linear      Quadratic        Logistic
So which curve best reflects reality? Given that all could be wrong or right to some degree depending
on the landscape, I looked at four different habitat models in the literature to see what emerged.
Figures 3 and 4 show model predictions when the percentages of habitat (in this case, CRP) increase at
the expense of cropland. Models used in predictions were from Riley 1995 (“IA”), Haroldson et al. 2006
(“MN”), Nielson et al. 2008 (“West”), and Jorgensen et al. 2014 (“NE”). Results for “MN” are the
average of two reported seasonal models, and those for “NE” and “West” models largely overlap at the
scale shown so the lines are hard to see. Predictions assume an initial population of 10 pheasants (0.1
per acre of CRP) at 1% CRP in the landscape. I limited the predictions to landscapes up to 15% CRP
because that is where most of the data in the studies came from.
Figure 3.
200
Predicted Abundance
150
100
50
0
1 5 10 15
Percent CRP in Landscape
IA NE MN West
Figure 4.
0.12
Predicted Birds/CRP ac
0.10
0.08
0.06
0.04
0.02
0.00
1 5 10 15
Percent CRP in Landscape
IA NE MN West
The Iowa model is the only one that comes close to conforming to expectations; it has a quadratic shape
(though it looks linear at this range of x-values) and predicts about a 15-fold change in populations
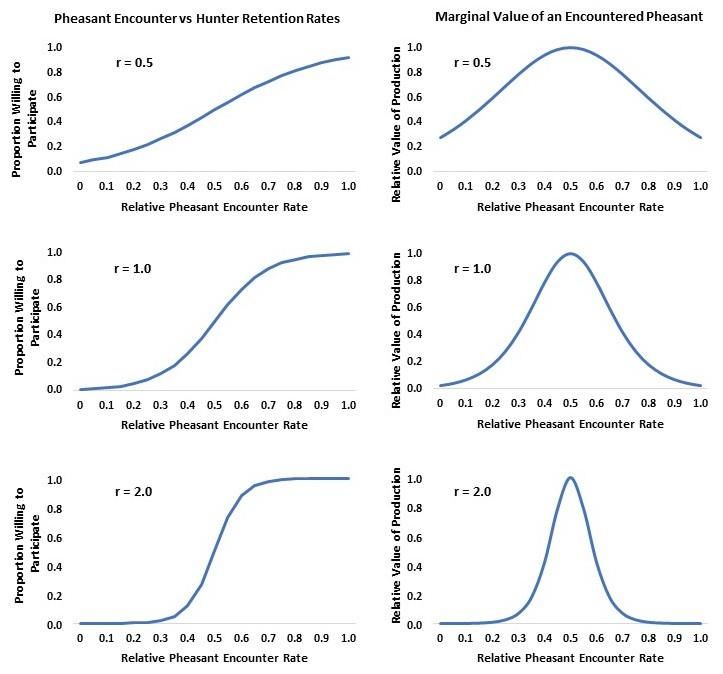
between 1 and 15% CRP in the landscape. By comparison, the other models predict miniscule changesin abundance as percent CRP increases over that range, with birds per CRP acre declining as percent CRP increases. These three models left me scratching my head, and I am pretty sure I got the model math right. USDA- FSA funded the Nielson et al. paper and said their results suggested “a 4% increase in CRP was associated with a 22% increase in pheasant counts,” which sounds great, and my math reproduced these results. The paper uses land cover compositional data as its model inputs, so a “4% increase in CRP” means increasing the percentage of the landscape that is CRP by four points, i.e., from, say, 5 to 9%. Such a change would increase the CRP acres in the landscape by ((9-5)/5)*100 = 80%, but only yield a 22% increase in populations. The model therefore predicts a decline in birds per CRP acre as the proportion of CRP in the landscape increases (assuming habitat selection behavior remains stable), and several other models share this prediction. This is not how I expected the world to work. Either my preconceptions are wrong (I thought birds per acre of habitat should increase, or at worst remain stable, with increasing habitat in the landscape), my math is wrong, or most of these models are misleading. The answer to these questions could have a big impact on the efficiency with which we can do our work. If anyone has any insights about this, please let me know. One last bit about maximizing hunters retained per pheasant produced. We know some hunters are going to drop out regardless of pheasant abundance, but for those that might continue, imagine asking each one how many pheasants they would have to encounter per day to keep participating. We could then compile their collective answers and estimate the proportion of hunters who were willing to participate at any given pheasant encounter rate. The shape of that “cumulative proportion” distribution can then be used to find the maximum value of additional pheasants added across the range of encounter rates. Figure 5 shows three such possible shapes (the r-value describes the growth rate of the cumulative proportions) and how they affect where that maximum value lies, as well as how sharp the distinction is between the maximum and other nearby values. Two messages emerge from this hypothetical exercise: 1) the less agreement there is among hunters regarding the number of birds they need to see to keep participating, the less it matters exactly where you add additional pheasants, and 2) adding pheasants into landscapes offering very low and very high encounter rates is of little retention value compared to more moderate encounter situations. These ideas are obviously in great need of real data to test their validity and see where these high-yield encounter rate values might actually occur. The Technical Committee and I will be sorting through these ideas before deciding which belong in the revised Plan. If anyone has comments, feel free to send me a note.
Figure 5.

Literature Cited
Haroldson, K. J., R. O. Kimmel, M. R. Riggs, and A. H. Berner. 2006. Association of ring-necked pheasant,
        gray partridge, and meadowlark abundance to CRP grasslands. Journal of Wildlife Management
        70: 1276-1284.

Jorgensen, C. J., A. A. Bishop, J. J. Lusk, L. A. Powell, and J. J. Fontaine. 2014. Assessing landscape
       constraints on species abundance: does the neighborhood limit species response to local habitat
       conservation programs? PLoS ONE 9:e99339.

Nielson, R. M., L. L. McDonald, J. P. Sullivan, C. Burgess, D. S. Johnson, D. H. Johnson, S. Bucholtz, S.
        Hyberg, and S. Howlin. 2008. Estimating the response of ring-necked pheasants (Phasianus
        colchicus) to the Conservation Reserve Program. Auk 125: 434-444.
Riley, T. Z. 1995. Association of the Conservation Reserve Program with ring-necked pheasant survey
counts in Iowa. Wildlife Society Bulletin 23:386-390.
Pheasant-relevant Media
Research looks into different farmer types regarding soil, water conservation
Sioux Falls loses a few million dollars with cancellation of Pheasant Fest
(Sorry, it was slim pickings on Google this month.)
Recent Literature
Runia, T. J., and A. J. Solem. 2020. Captive ring-necked pheasant response to very high experimental
doses of lead. Prairie Naturalist 52:70-77. (For those without a PN subscription, contact Travis
Runia for an electronic copy)
Hinrichs, M. P., M. P. Vrtiska, M. A. Pegg, and C. J. Chizinski. 2020. Motivations to participate in hunting
and angling: a comparison among preferred activities and state of residence. Human
Dimensions of Wildlife (early online version).
Upadhaya, S., G. Arbuckle, and L. A. Schulte. 2020. Developing farmer typologies to inform
conservation outreach in agricultural landscapes. Land Use Policy (early online version).
Nemeth, N. M., L. M. Williams, A. M. Bosco-Lauth, P. T. Oesterle, M. Helwig, R. A. Bowen, and J. D.
Brown. 2020. West Nile Virus infection in ruffed grouse (Bonasa umbellus) in Pennsylvania: a
multi-year comparison of statewide serosurveys and vector indices. Journal of Wildlife Diseases
(early online version).
Tallamy, D. W., and W. G. Shriver. 2021. Are declines in insects and insectivorous birds related?
Ornithological Applications (early online version).
Smith, A. C., and B. P. M. Edwards. 2020. North American Breeding Bird Survey status and trend
estimates to inform a wide range of conservation needs, using a flexible Bayesian hierarchical
generalized additive model. The Condor (early online version).Trivia Answer
Montana has lost 79.4% of its maximum “traditional” CRP acres as per USDA’s November 2020 CRP
report, the most of any state with a current enrollment of more than 100,000 acres. The table below
defines “traditional” CRP acres as all enrollments excluding CRP Grasslands contracts, which began in
2015. CRP Grasslands enrolls land currently in grassland and allows annual haying and grazing if certain
conditions are met, so likely has less value to pheasants than traditional CRP.
"Traditional" CRP Acres Acres Expiring
% Change
State Maximum Nov 2020 from max 2021 2022
Alabama 555,523 163,008 -70.7 45,124 49,125
Alaska 29,984 8,184 -72.7 33 134
Arizona 33 0 -100.0 0 0
Arkansas 251,166 207,378 -17.4 21,946 19,625
California 182,185 38,479 -78.9 8,596 16,470
Colorado 2,472,094 1,433,918 -42.0 298,852 463,968
Connecticut 318 0 -100.0 1 0
Delaware 7,906 3,342 -57.7 337 148
Florida 128,584 14,367 -88.8 4,550 7,109
Georgia 616,501 191,751 -68.9 26,672 54,974
Hawaii 4,887 1,280 -73.8 0 0
Idaho 848,591 432,317 -49.1 116,543 143,309
Illinois 1,086,580 832,923 -23.3 68,756 68,415
Indiana 453,481 204,236 -55.0 18,938 21,495
Iowa 2,203,794 1,670,340 -24.2 90,227 120,112
Kansas 3,258,989 1,722,419 -47.1 369,500 298,644
Kentucky 437,554 188,890 -56.8 13,435 58,338
Louisiana 327,367 257,821 -21.2 26,604 13,238
Maine 35,790 4,427 -87.6 1,087 1,145
Maryland 85,734 45,551 -46.9 3,338 4,962
Massachusetts 121 10 -91.7 0 0
Michigan 334,605 98,102 -70.7 9,677 10,908
Minnesota 1,836,818 992,306 -46.0 63,155 107,581
Mississippi 955,119 552,672 -42.1 79,343 102,092
Missouri 1,701,712 794,525 -53.3 133,824 236,060
Montana 3,481,533 715,722 -79.4 138,264 193,556
Nebraska 1,379,741 673,870 -51.2 96,893 81,823
Nevada 2,828 0 -100.0 146 0
New Hampshire 197 0 -100.0 0 0
New Jersey 2,639 1,694 -35.8 170 328
New Mexico 597,492 318,791 -46.6 114,769 126,122
New York 66,544 15,720 -76.4 2,410 2,787
North Carolina 143,723 35,028 -75.6 9,821 8,657North Dakota 3,388,553 1,178,447 -65.2 134,443 381,099 Ohio 365,983 221,473 -39.5 26,956 24,031 Oklahoma 1,170,355 491,210 -58.0 153,562 157,908 Oregon 567,565 468,289 -17.5 85,468 83,354 Pennsylvania 230,219 100,582 -56.3 12,866 20,159 Puerto Rico 2,223 495 -77.7 0 0 Rhode Island 28 0 -100.0 0 0 South Carolina 267,738 42,934 -84.0 7,155 13,210 South Dakota 1,772,538 916,530 -48.3 112,639 140,929 Tennessee 455,022 109,673 -75.9 21,185 16,017 Texas 4,074,070 2,335,255 -42.7 553,329 734,350 Utah 227,481 101,751 -55.3 27,620 24,910 Vermont 2,884 2,257 -21.7 284 325 Virginia 75,508 29,602 -60.8 4,069 5,193 Washington 1,557,247 1,004,588 -35.5 95,414 218,700 West Virginia 7,885 5,115 -35.1 836 695 Wisconsin 713,022 193,668 -72.8 18,506 17,980 Wyoming 285,172 114,630 -59.8 33,180 43,194 Total 36,770,984 18,935,570 -48.5 3,050,522 4,093,179 This update is brought to you by the National Wild Pheasant Conservation Plan and Partnerships. Our mission is to foster science-based, socially-supported policies and programs that enhance wild pheasant populations, provide recreational opportunities to pheasant hunters, and support the economics and social values of communities. You can find us on the web at http://nationalpheasantplan.org.
You can also read