Physical and mechanical rock properties of a heterogeneous volcano: the case of Mount Unzen, Japan
←
→
Page content transcription
If your browser does not render page correctly, please read the page content below
Solid Earth, 12, 633–664, 2021
https://doi.org/10.5194/se-12-633-2021
© Author(s) 2021. This work is distributed under
the Creative Commons Attribution 4.0 License.

Physical and mechanical rock properties of a heterogeneous
volcano: the case of Mount Unzen, Japan
Jackie E. Kendrick1,2 , Lauren N. Schaefer3,a , Jenny Schauroth1 , Andrew F. Bell2 , Oliver D. Lamb1,4 ,
Anthony Lamur1 , Takahiro Miwa5 , Rebecca Coats1 , Yan Lavallée1 , and Ben M. Kennedy3
1 Department of Earth, Ocean and Ecological Sciences, University of Liverpool, Liverpool, L69 3GP, UK
2 School of GeoSciences, University of Edinburgh, Edinburgh, EH9 3FE, UK
3 Department of Geological Science, University of Canterbury, Christchurch, 8140, New Zealand
4 Department of Geological Sciences, University of North Carolina at Chapel Hill, Chapel Hill, NC 27514, USA
5 National Research Institute for Earth Science and Disaster Resilience (NIED), Ibaraki, 305 0006, Japan
a now at: US Geological Survey, Golden, CO 80401, USA

Correspondence: Jackie E. Kendrick (jackie.kendrick@ed.ac.uk)

Received: 24 September 2020 – Discussion started: 9 October 2020
Revised: 14 January 2021 – Accepted: 27 January 2021 – Published: 16 March 2021

Abstract. Volcanoes represent one of the most critical geo-       scopically anisotropic samples than for isotropic samples of
logical settings for hazard modelling due to their propensity     similar porosity. An additional 379 permeability measure-
to both unpredictably erupt and collapse, even in times of        ments on planar surfaces of both an isotropic and anisotropic
quiescence. Volcanoes are heterogeneous at multiple scales,       sample block showed consistent minimum, maximum, and
from porosity, which is variably distributed and frequently       average permeabilities, and comparable standard deviations
anisotropic, to strata, which are laterally discontinuous and     to measurements on core and disc samples; this indicated a
commonly pierced by fractures and faults. Due to variable         negligible impact of sample size on recorded permeability
and, at times, intense stress and strain conditions during and    across the range of sample sizes and absolute permeabili-
following emplacement, volcanic rocks span an exception-          ties tested. Permeability measured under confined conditions
ally wide range of physical and mechanical properties. Un-        showed that the lowest permeability samples, whose porosity
derstanding the constituent materials’ attributes is key to im-   largely comprises microfractures, are most sensitive to effec-
proving the interpretation of the hazards posed by the diverse    tive pressure and that anisotropy of permeability is enhanced
array of volcanic complexes. Here, we examine the spectrum        by confinement. The permeability measurements highlight
of physical and mechanical properties presented by a sin-         the importance of the measurement approach, scale, and
gle dome-forming eruption at a dacitic volcano, Mount Un-         confinement conditions in the description of permeability.
zen (Japan), by testing a number of isotropic and anisotropic     The uniaxial compressive strength (UCS) ranges from 13.48
lavas in tension and compression with acoustic emission           to 47.80 MPa, and tensile strength (UTS) using the Brazil-
(AE) monitoring. The lava dome erupted as a series of 13          ian disc method ranges from 1.30 to 3.70 MPa, with crack-
lobes between 1991 and 1995, and its ongoing instability          dominated lavas being weaker than vesicle-dominated mate-
means that much of the volcano and its surroundings remain        rials of equivalent porosity. UCS is lower in saturated condi-
within an exclusion zone today. During a field campaign in        tions, whereas the impact of saturation on UTS is variable.
2015, we selected four representative blocks as the focus of      UCS is between 6.8 and 17.3 times higher than UTS, with
this study. The core samples from each block span a range in      anisotropic samples forming each endmember. The Young’s
total porosity from 9.14 % to 42.81 % and a range in perme-       modulus of dry samples ranges from 4.49 to 21.59 GPa and
ability from 1.65×10⁻¹⁵ to 1.88×10⁻⁹ m2 (from 1065 mea-           is systematically reduced in water-saturated tests. The inter-
surements). For a given porosity, sample permeability varies      relation of porosity, UCS, UTS, and Young’s modulus was
by > 2 orders of magnitude and is typically lower for macro-      modelled with good replication of the data, and empirical re-

Published by Copernicus Publications on behalf of the European Geosciences Union.
634 J. E. Kendrick et al.: Physical and mechanical rock properties of a heterogeneous volcano: Mount Unzen, Japan
lationships are provided. Acceleration of monitored acoustic hance gravitational spreading (Borgia et al., 1992; van Wyk
emission (AE) rates during deformation was assessed by fit- de Vries and Francis, 1997) which also increases instabil-
ting Poisson point process models in a Bayesian framework. ity. Large-scale heterogeneities such as lithological contacts,
An exponential acceleration model closely replicated the ten- unconsolidated layers, laterally discontinuous beds, as well
sile strength tests, whilst compressive tests tended to have as faults, including previous edifice collapse scars, also con-
relatively high early rates of AEs, suggesting failure forecast tribute to the propensity for volcanic edifices to collapse dur-
may be more accurate in tensile regimes, though with shorter ing active periods or quiescence (e.g. Williams et al., 2019;
warning times. The Gutenberg–Richter b value has a nega- Tibaldi, 2001; Carrasco-Núñez et al., 2006; Schaefer et al.,
tive correlation with connected porosity for both UCS and 2019).
UTS tests which we attribute to different stress intensities Lava domes may be particularly susceptible to collapse
caused by differing pore networks. The b value is higher for events. During emplacement, the development of gas over-
UTS than UCS, and it typically decreases (positive 1b) dur- pressure, gravitational loading, uneven underlying topogra-
ing tests, with the exception of cataclastic samples in com- phy, variations in extrusion direction, and intense rainfall can
pression. 1b correlates positively with connected porosity all trigger partial to complete dome collapse (Harnett et al.,
in compression and correlates negatively in tension. 1b us- 2019b; Calder et al., 2002; Elsworth et al., 2004; Voight and
ing a fixed sampling length may be a more useful metric for Elsworth, 2000). Once activity subsides lava domes are still
monitoring changes in activity at volcanoes than the b value prone to collapse due to fracturing induced by contraction
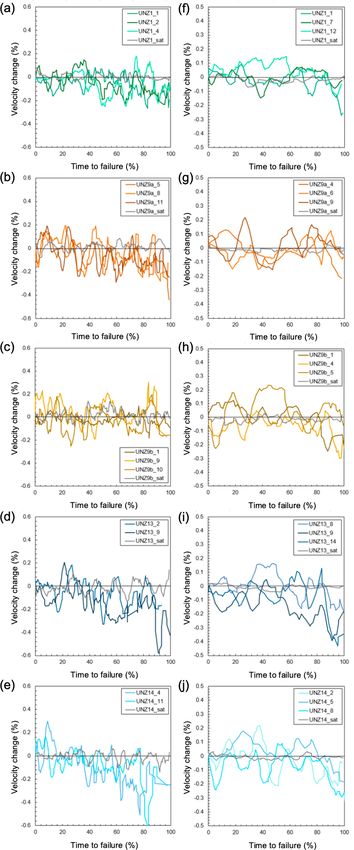
with an arbitrary starting point. Using coda wave interfer- of cooling magma bodies (Lamur et al., 2018; Fink and An-
ometry (CWI), we identify velocity reductions during me- derson, 2000), fault systems (Walter et al., 2015), redistribu-
chanical testing in compression and tension, the magnitude tion of mass post-emplacement (Elsworth and Voight, 1996),
of which is greater in more porous samples in UTS but inde- and hydrothermal alteration (Ball et al., 2015; Horwell et al.,
pendent of porosity in UCS and which scales to both b value 2013).
and 1b. Yet, saturation obscures velocity changes caused by The physical and mechanical properties of the constituent
evolving material properties, which could mask damage ac- materials are a primary control on volcano and lava dome
crual or source migration in water-rich seismogenic environ- stability. Volcanic rocks host void space that ranges from
ments such as volcanoes. The results of this study highlight vesicles with complex geometries to networks of elongate
that heterogeneity and anisotropy within a single system not cracks or fractures (e.g. Schaefer et al., 2015; Shields et al.,
only add variability but also have a defining role in the chan- 2016; Colombier et al., 2017; Herd and Pinkerton, 1997), and
nelling of fluid flow and localisation of strain that dictate a dome lavas in particular frequently have anisotropic pore net-
volcano’s hazards and the geophysical indicators we use to works (Heap et al., 2014b; Lavallée and Kendrick, 2020). As
interpret them. porosity is the major control on the strength and geophysi-
cal characteristics of geomaterials, such diversity of poros-
ity translates to a broad spectrum of mechanical behaviour
of dome rocks and lavas (e.g. Harnett et al., 2019a; Heap et
1 Introduction al., 2016a; Coats et al., 2018; Lavallée and Kendrick, 2020),
and a universal predictor of material strength eludes us. A
1.1 Rock failure and volcano stability key parameter in the description of lavas and volcanic rock
properties is permeability, which defines materials’ ability
Volcanoes are constructed over relatively short geological to build and alleviate pore pressure; this parameter is im-
timescales via the accrual of diverse eruptive products that portant during eruptive activity and quiescence alike (Day,
span a porosity range from 0 % to 97 %, making them in- 1996; Saar and Manga, 1999; Mueller et al., 2005; Collinson
herently unstable structures prone to collapse (Reid et al., and Neuberg, 2012; Farquharson et al., 2015; Scheu et al.,
2000; McGuire, 1996; Delaney, 1992). Volcanoes experi- 2006b). Permeability of volcanic rocks has been shown to
ence deformation due to ongoing magmatic activity (Don- span some 10 orders of magnitude, including as many as 5
nadieu et al., 2001; Voight et al., 1983), pore-fluid pres- orders of magnitude for materials of a given porosity (e.g.
surisation thanks to active hydrothermal systems and re- Saar and Manga, 1999; Mueller et al., 2005; Farquharson
gional tectonics including stress rotation (Reid et al., 2010; et al., 2015; Klug and Cashman, 1996). Permeability, con-
Patanè et al., 1994), and alteration due to percolation of flu- trolled by porosity and connectivity of the porosity, acts in
ids (Rosas-Carbajal et al., 2016) and contact with intrusive competition with material strength to define the fragmenta-
bodies (Saubin et al., 2019; Weaver et al., 2020). In particu- tion threshold, which is the limit over which pore pressure
lar, volcanoes are often located in seismically active regions exceeds the material’s strength and triggers wholesale fail-
and may be susceptible to earthquake triggering (Walter et ure for a spectrum of porous geomaterials (Mueller et al.,
al., 2007; Surono et al., 2012). The presence of thermally li- 2008; Spieler et al., 2004; Kremers et al., 2010; Alatorre-
able subvolcanic basement rocks (e.g. Mollo et al., 2011) or Ibargüengoitia et al., 2010; Scheu et al., 2006b). This inter-
the presence of volcaniclastics (Cecchi et al., 2004) may en- play influences both pressurised magmas and fluid-saturated
Solid Earth, 12, 633–664, 2021 https://doi.org/10.5194/se-12-633-2021
J. E. Kendrick et al.: Physical and mechanical rock properties of a heterogeneous volcano: Mount Unzen, Japan                   635

volcanic rocks, shifting the stress fields that may trigger fail-   hancing the range of mechanical properties of materials that
ure (e.g. Voight and Elsworth, 2000); this is a consideration       construct volcanic edifices and lava domes.
that is pertinent to the interpretation of secondary hazards in        During laboratory deformation, acoustic emissions (AEs)
scenarios of rapid pressurisation during magma ascent (e.g.         can be recorded; AEs are produced by the creation, propa-
Mueller et al., 2008), tectonic earthquakes (e.g. Walter et al.,    gation, and coalescence of fractures which accelerate in the
2007), and during decompression induced by unloading dur-           approach to failure, forming the basis for various forecast-
ing collapse (e.g. Hunt et al., 2018; Maccaferri et al., 2017;      ing approaches (e.g. Kilburn, 2003; Bell et al., 2011; Bell,
Williams et al., 2019; Brantley and Scott, 1993).                   2018; Voight, 1988). The frequency–amplitude distribution
   Increasingly sophisticated numerical models have been            of AEs are commonly observed to follow an exponential
utilised to interpret the conditions leading to partial or ex-      distribution (e.g. Pollock, 1973; Scholz, 1968). This distri-
tensive collapse of lava domes (e.g. Harnett et al., 2018b;         bution is analogous to the Gutenberg–Richter relation ob-
Sato et al., 1992; Voight and Elsworth, 2000), although such        served for the frequency–magnitude distribution of tectonic
simulations necessarily entail estimates for parameters such        earthquakes (Gutenberg and Richter, 1949). Accordingly, the
as internal dome structure, vent geometry, and slope of sub-        “b value” may be calculated for the distribution of AE ampli-
strata, and are dependent upon accurate characterisation of         tudes, describing the relative proportions of small and large
physical and mechanical properties. Creating homogeneous            events. Previous laboratory work on a broad range of litholo-
zones and assigning fixed values or ranges of parameters            gies showed that the b value is higher during ductile (com-
for the purpose of isolating the influence of variables during      pactant) deformation, as cracking events are pervasively dis-
modelling is commonplace and computationally beneficial,            tributed, than during brittle (dilatant) deformation, which is
yet this remains a great source of uncertainty by failing to        often localised (Scholz, 1968). In their study on porous sin-
account for the spectrum of dome materials’ properties. In          tered glasses, Vasseur et al. (2015) showed that the b value in-
the last few decades, a surge in laboratory testing means that      creases as a function of heterogeneity (∼ porosity) due to the
the characterisation of hot lavas and volcanic rocks has im-        number of nucleation sites in heterogenous materials that al-
proved significantly, and reliable constraints of rheological,      low pervasive damage. Complementary work on three-phase
physical, and mechanical properties are being obtained. Rhe-        magmas (glass, crystals, and pores) showed that the b value
ology of natural lavas including those with suspended vesi-         depended on the applied stress, with higher stresses result-
cles and crystals have been defined across a broad range of         ing in faster deformation, more localised damage zones, and
temperatures and rates using concentric cylinder and paral-         correspondingly lower b values (Lavallée et al., 2008). Sim-
lel plate methods (Cordonnier et al., 2009; Lavallée et al.,        ilarly, during a single episode of deformation, results on var-
2007; Coats et al., 2018; Webb, 1997; Okumura et al., 2010;         ious rocks and glasses have also indicated that the b value
Chevrel et al., 2015; Kolzenburg et al., 2016). Volcanic rock       decreases as damage accrues and strain becomes localised to
strength inversely correlates with porosity and is frequently       a damage zone or failure plane (Vasseur et al., 2015; Lock-
defined in terms of uniaxial compressive strength (UCS) at          ner, 1993; Meredith et al., 1990; Main et al., 1992), whereas
room or high temperature (e.g. Heap et al., 2014b; Schaefer         in double-direct shear, smoother, less heterogenous fault sur-
et al., 2015; Coats et al., 2018; Bubeck et al., 2017; Pap-         faces produced lower b values during slip (Sammonds and
palardo et al., 2017), direct and indirect tensile strength at      Ohnaka, 1998).
room or high temperature (Harnett et al., 2019a; Lamur et al.,         Elastic moduli also elucidate materials’ response to defor-
2018; Hornby et al., 2019; Lamb et al., 2017; Benson et al.,        mation and are measured from mechanical data or from ul-
2012), and triaxial tests at varying pressures, temperatures,       trasonic velocity measured in the laboratory (although pas-
and saturation conditions (Heap et al., 2016a; Smith et al.,        sive and dynamic values do not necessarily correlate; e.g.
2011; Farquharson et al., 2016; Shimada, 1986; Kennedy et           Kendrick et al., 2013; Heap et al., 2020); in particular,
al., 2009; Mordensky et al., 2019). Strength of volcanic rocks      Young’s modulus indicates the stress–strain response to load-
also typically positively correlates with strain rate (Schaefer     ing and correlates negatively with porosity (Heap et al., 2020,
et al., 2015; Coats et al., 2018), which in combination with        and references therein). Ultrasonic velocity is itself an indi-
variability in pore geometry, crystallinity, and other textural     cator of material properties (e.g. Vanorio et al., 2002; Harnett
parameters of volcanic rocks ensures that scatter in volcanic       et al., 2018a); for volcanic rocks and magmas both P- and
rock strength is high (Lavallée and Kendrick, 2020; Heap            S-wave velocity (and their ratio) depend on the mineralogi-
et al., 2016b). This variability is exacerbated by the effects      cal assemblage (Caricchi et al., 2008; Vanorio et al., 2002),
of pore pressure (Farquharson et al., 2016), in situ tempera-       porosity (vesicularity or fracture damage; e.g. Lavallée et al.,
ture (Coats et al., 2018; Lamur et al., 2018), chemical alter-      2013; Lesage et al., 2018), and temperature (e.g. Scheu et al.,
ation (Pola et al., 2014; Wyering et al., 2014; Farquharson et      2006a). During deformation in compression, seismic veloc-
al., 2019), thermal stressing (Kendrick et al., 2013; Heap et       ity has been shown to first increase and then more substan-
al., 2014b), and time-dependent (Heap et al., 2011) or cyclic       tially decrease as damage accrues (Ayling et al., 1995; Har-
(Schaefer et al., 2015; Benson et al., 2012) stressing, whose       nett et al., 2018a), which has been linked via AE monitoring
impact is contrasting in different volcanic rocks, further en-      to the generation of fractures (Benson et al., 2007; Zhang et

https://doi.org/10.5194/se-12-633-2021                                                           Solid Earth, 12, 633–664, 2021
636    J. E. Kendrick et al.: Physical and mechanical rock properties of a heterogeneous volcano: Mount Unzen, Japan

al., 2019). Whilst seismic velocity is a valuable characteri-        November 1993, and dome growth was endogenous until
sation tool, it is sensitive to the degree of saturation (perti-     mid-October 1994 when a lava spine extruded in the cen-
nent to wet volcanic systems) and difficult to measure during        tre of the dome surface (Saito and Shikawa, 2007; Nakada
dynamic testing due to the generation of AEs (Zhang et al.,          and Motomura, 1999). As the dome grew, new lobes were
2019), as well as being both technologically and computa-            extruded into older collapse scars, which formed planes of
tionally challenging (Benson et al., 2007). Coda wave inter-         weakness that facilitated further collapses (Nakada et al.,
ferometry (CWI) has been employed as an alternative, as it           1999). Throughout the eruption numerous collapse events
is sensitive to small fluctuations in material properties (e.g.      caused block-and-ash flows and rock falls (Sato et al., 1992),
Singh et al., 2019; Snieder et al., 2002; Griffiths et al., 2018),   as the lava dome was constructed atop the steep substratum
including crack damage (Lamb et al., 2017) or the degree of          (Brantley and Scott, 1993). Tragically, one such collapse on
saturation (Grêt et al., 2006). The utilisation of CWI at ac-        3 June 1991 led to the death of 43 people. To date, the lava
tive volcanic systems has not only tracked migrating seismic         dome remains unstable (Shi et al., 2018); the frontal portion
sources (e.g. Lamb et al., 2015) but has also indicated veloc-       of lobe 11 continues to move SE–ESE at a rate of 2.45–
ity reduction prior to eruptions on an equivalent scale to that      5.77 cm yr−1 (over the last decade), presenting the risk of
measured in the laboratory (Erdem and Waite, 2013; Lamb et           collapse of a portion of the lava dome up to 107 m3 in size
al., 2017; Haney et al., 2014), validating its implementation        (Hirakawa et al., 2018). As such, the summit and a large pro-
in rock physics to track material evolution.                         portion of the flanks remain an exclusion zone.
   The spectrum of lab-based approaches offers an idealised             The erupted lavas are porphyritic dacites with abun-
picture of material characteristics of a given volcanic system,      dant, large phenocrysts and significant porosity (typically
representing intact-rock values of material coherent enough          > 10 %), which is distributed heterogeneously (Nakada and
to sample. Utilisation of field-based measurements using the         Motomura, 1999; Noguchi et al., 2008; Cordonnier et al.,
Schmidt hammer (e.g. Harnett et al., 2019a) or in situ poros-        2009; Bernard et al., 2015; Coats et al., 2018; Scheu et al.,
ity and permeability measurements (e.g. Mordensky et al.,            2008). Much of the lava exhibits anisotropic textures, and
2018) have been employed in combination with laboratory              shear zones pierce the lava dome carapace, relics of shallow
testing in an attempt to examine the representativeness of           conduit strain localisation in the hot, viscous magmas (Wal-
sample selection at volcanoes (e.g. Bernard et al., 2015;            lace et al., 2019; Miwa et al., 2013; Hornby et al., 2015).
Schaefer et al., 2015). Thomas et al. (2004) used the rock-          Ongoing fumarole activity and prolonged residence at ele-
mass rating (RMR) index and the Hoek–Brown criterion to              vated temperature has resulted in substantial hydrothermal
deduce that edifice strengths likely show a 96 % reduction           alteration in localised areas of the dome (e.g. Almberg et
from intact rock strength measured in the laboratory due to          al., 2008). Numerous experimental investigations have ex-
rock mass discontinuities and surface conditions. Whilst it          amined the porosity distribution, rheology, strength, seis-
is not necessarily the responsibility of those conducting me-        mic velocities, elastic moduli, fragmentation threshold, and
chanical tests to apply such corrections, it is vital that such      frictional coefficients of the 1991–1995 lavas (Scheu et al.,
considerations are made in the modelling and assessment of           2006a, 2008; Cordonnier et al., 2009; Kremers et al., 2010;
hazards posed by partial or complete collapse of volcanic ed-        Hornby et al., 2015; Bernard et al., 2015; Coats et al., 2018;
ifices and lava domes.                                               Lavallée et al., 2007; Kueppers et al., 2005), painting a pic-
                                                                     ture of a highly heterogeneous lava dome. Understanding
1.2   Mount Unzen eruption and lavas                                 this heterogeneity in terms of physical and mechanical vari-
                                                                     ability is vital. Coats et al. (2018) showed that these dacitic
In order to understand how physical and mechanical proper-           rocks weaken as they cool from magmatic to ambient tem-
ties of volcanic rocks vary we can first consider the variabil-      peratures, although the impact of alteration on their strength
ity from a single lava dome eruption at a volcanic system.           was limited. As the deformation of rocks is inherently time-
The 1990–1995 eruption at Mount Unzen, on the Shimabara              dependent (e.g. Dusseault and Fordham, 1993) and the area
Peninsula (Fig. 1a), began on 17 November 1990, and the              is particularly prone to regional earthquakes, the hazards at
extrusion of lava at the Jigoku-ato crater commenced on              Mount Unzen continue to evolve, especially in light of the
20 May 1991 (Nakada and Fujii, 1993). A total of 1.2 ×               potential for renewed volcanic unrest.
108 m3 lava was erupted via endogenic and exogenic growth,              Here, by utilising the range of materials produced during a
with approximately half this volume preserved in the Heisei-         single eruption at Mount Unzen, we demonstrate the impor-
Shinzan lava dome (Nakada et al., 1999). Endogenic ver-              tance of material characterisation. Mount Unzen represents
sus exogenic growth has been modelled to be controlled               an ideal case study, as the eruptive products exhibit mostly
by extrusion rate (Hale and Wadge, 2008): from May 1991              invariable chemical and mineralogical attributes, and they
to November 1993 effusion rates were high (Nakada et al.,            have experienced similar eruptive and cooling history; thus,
1995; Nakada and Motomura, 1999), resulting in the for-              their study allows a robust description of relationships be-
mation of 13 lava lobes (Sato et al., 1992; Nakada and Fu-           tween physical and mechanical characteristics. We assess the
jii, 1993) by exogenous growth. Effusion rates waned after           contribution of rock porosity and anisotropy on rock strength

Solid Earth, 12, 633–664, 2021                                                           https://doi.org/10.5194/se-12-633-2021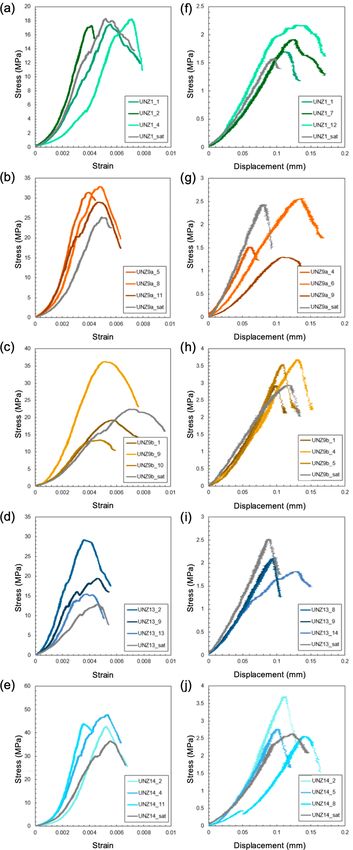
J. E. Kendrick et al.: Physical and mechanical rock properties of a heterogeneous volcano: Mount Unzen, Japan 637
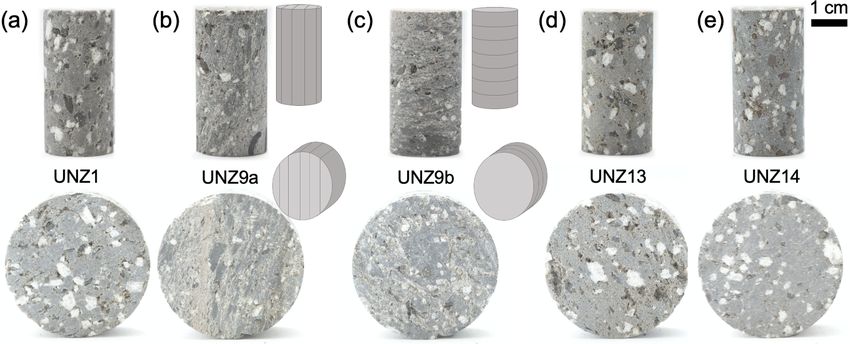
Figure 1. (a) Location of Mt. Unzen on the Shimabara Peninsula of Japan (country boundary data provided by the World Resource Institute).
(b) Location of samples used in the study shown on top of a multispectral PlanetScope scene with 3 m spatial resolution, from 7 June 2020
(Planet, 2017).
under dry and water-saturated conditions, and we examine et al. 2018; Nakada and Motomura, 1999; Wallace et al.,
Young’s modulus as well as the interrelation of these proper- 2019).
ties and rock permeability. We assess the temporal evolution During a field campaign in 2015, a suite of blocks, each
of damage during laboratory compressive and tensile defor- > 15 kg, were collected from block-and-ash flow deposits on
mation using acoustic monitoring of crack damage, examin- the eastern and north-eastern flanks (Fig. 1b). The samples
ing accelerating rates of energy release and tracking progres- were assessed in the field to ensure representative texture and
sion of the seismic b value. We also employ coda wave inter- estimated densities that matched the known range of physi-
ferometry during deformation to further quantify progression cal attributes of Unzen lavas (cf. Kueppers et al., 2005). The
of damage during stressing. Such investigations that consider target was to select four blocks for this study which spanned
damage progression and strength as a function of porosity, low (UNZ14), medium (UNZ1), and high (UNZ13) porosity,
anisotropy, and saturation under different deformation modes plus an additional block that displayed an anisotropic cata-
are important in our interpretation of volcano monitoring clastic fabric (UNZ9), as the summit lava dome is pierced by
data, elucidating the processes responsible for observed char- shear zones (see e.g. Wallace et al., 2019). Blocks UNZ1 and
acteristics and defining their associated hazards. UNZ13 were also used for the study by Coats et al. (2018),
who examined the role of temperature, alteration, and strain
rate on the rheological response to deformation at high tem-
2 Materials and methods perature and defined a failure criterion for porous dome rocks
and lavas.
2.1 Sample selection and characterisation
2.1.1 Sample collection 2.1.2 Sample preparation
Unzen lavas are typically porphyritic dacites with ∼ 63 wt % Samples were cored using a pillar drill at the University of
SiO2 and rhyolitic interstitial glass. Lavas from the col- Liverpool to prepare cylinders of both 20 and 40 mm diam-
lapse deposits of the 1991–1995 lava dome sampled in this eter. In the case of the anisotropic block, cores were pre-
study have been described as having variable porosities of pared both parallel (UNZ9a) and perpendicular (UNZ9b) to
approximately 10 %–35 % (Kueppers et al., 2005; Coats et the plane of the fabric, producing five sample groups: UNZ1,
al., 2018; Hornby et al., 2015) and crystallinity (including UNZ9a, UNZ9b, UNZ13, and UNZ14 (Fig. 2). The 20 mm
microlites) of up to ∼ 75 %, including large (> 3 mm) and cylinders were cut and ground plane-parallel to a nominal
abundant (> 25 vol %) plagioclase phenocrysts, along with length of 40 mm to prepare samples (herewith termed cores)
fewer amphibole (∼ 5 vol %), biotite (∼ 2 vol %), and quartz for porosity determination, unconfined gas permeability esti-
(∼ 2 vol %) phenocrysts and microphenocrysts set in a par- mates, confined water permeability measurements, and both
tially crystalline (30–55 vol %) groundmass of plagioclase, dry and water-saturated uniaxial compressive strength (UCS)
pyroxene, quartz, pargasite, and iron-titanium oxides (Coats tests. The 40 mm cylinders were cut to lengths of 20 mm to
https://doi.org/10.5194/se-12-633-2021 Solid Earth, 12, 633–664, 2021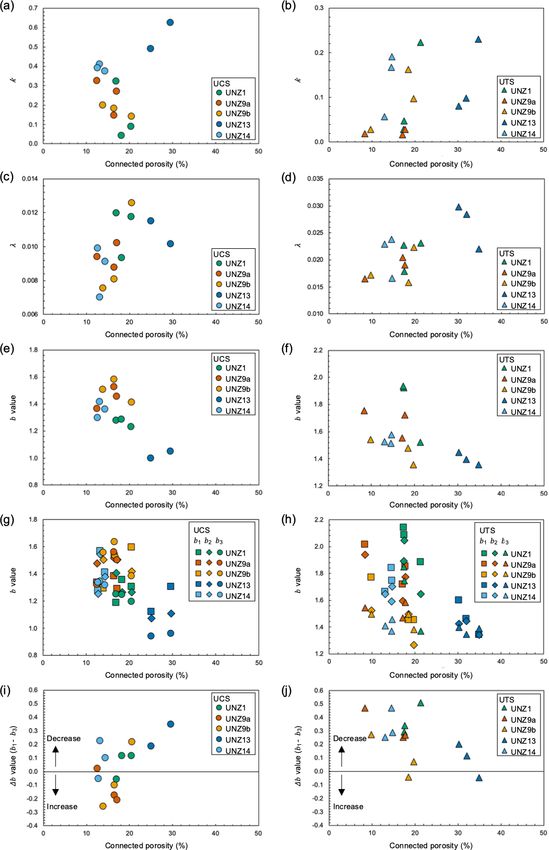
638      J. E. Kendrick et al.: Physical and mechanical rock properties of a heterogeneous volcano: Mount Unzen, Japan

prepare samples (termed discs) for porosity and unconfined        2.1.5   Unconfined gas permeability
gas permeability measurements and indirect tensile strength
testing (UTS) of dry and saturated samples using the Brazil-      Permeability of the cores and discs at ambient atmospheric
ian disc method (Fig. 2). Depending on material availability,     conditions was estimated using a TinyPerm II miniperme-
11 to 13 cores and 7 to 14 discs were produced for each of        ameter from New England Research Inc. The apparatus
the five sample groups (114 total). In addition, sample offcuts   utilises the pulse decay method via an 8 mm circular aperture
of each rock were ground to a fine powder for solid density       in contact with the sample surface, thereby sampling a differ-
measurements (see below).                                         ent volume depending on absolute permeability (Filomena et
                                                                  al., 2014). Previous work has demonstrated a theoretical min-
2.1.3     Microstructural characterisation                        imum sample size that stipulates a sample radius in excess of
                                                                  4 times the aperture radius for the attainment of representa-
Thin sections were prepared with fluorescent dyed epoxy           tive permeability values (Goggin et al., 1988), a relationship
from the offcuts of sample cores in the same orientation          which we will explore herein. TinyPerm II measurements es-
as coring direction. Thin sections were imaged using a            timate permeability with an accuracy of ∼ 0.2 log units at
DM2500P Leica microscope with both reflected light with           low porosities to 0.5–1 log units at higher porosities on lab-
an ultraviolet (UV) filter to examine microstructures and with    oratory specimens (Lamur et al., 2017), and they are partic-
plane-polarised transmitted light to assess mineralogy.           ularly valuable for rapid comparison across sample suites.
                                                                  For each of the samples, five measurements were made at
2.1.4     Porosity determination
                                                                  different positions on each flat face of the rock sample (10
The porosity of all 114 cores and discs was assessed using an     total per sample). In total, 1065 unconfined gas permeabil-
AccuPyc 1340 helium pycnometer from Micromeritics us-             ity measurements were made on the samples, and the values
ing a 35 cm3 cell (to provide volume with an accuracy of          were used to determine the average, standard deviation, and
±0.1 %). Sample length (l; in centimetres), radius (r; in cen-    coefficient of variation for each core or disc and, addition-
timetres), and mass (m; in grams) were recorded, providing        ally, to explore the specimen-to-specimen variability within
sample density (ρs ; in grams per cubic centimetre) via           each sample group (UNZ1, UNZ9a, UNZ9b, UNZ13, and
                                                                  UNZ14).
         m                                                           Additionally, for two of the samples, the macroscopically
ρs =           .                                           (1)
        π r 2l                                                    anisotropic UNZ9 and the densest block UNZ14, the blocks
                                                                  were cut to reveal planar surfaces of approximately 8×40 and
The solid density of the rocks (ρ0 ) was determined in the
                                                                  8 × 18 cm2 respectively. The planar surfaces of the dissected
pycnometer by measuring the volume of ∼ 25 g aliquots of
                                                                  blocks were mapped using the TinyPerm II minipermeameter
the powders from each sample block, and total porosity (∅T )
                                                                  at a grid spacing of 1 cm. An additional 262 measurements
was calculated as follows:
                                                                  were made for sample UNZ9 and 117 for sample UNZ14.
          ρs                                                      The values were used to determine the average, standard de-
∅T = 1 − .                                               (2)
          ρ0                                                      viation, and coefficient of variation for each sample group,
                                                                  and they were further compared to measurements on core
To constrain the fraction of isolated pores in the rocks, the
                                                                  and disc samples to examine the impact of sample size on
material volume was measured (Vm ; in cubic centimetres) for
                                                                  permeability determinations using the TinyPerm II.
each core and disc sample in the pycnometer. The connected
porosity (∅c ) of the samples was then determined via
                                                                  2.1.6   Confined water permeability
               Vm
∅c = 1 −             ,                                     (3)    A subset of three cores from each of the five sample groups
              π r 2l
                                                                  (UNZ1, UNZ9a, UNZ9b, UNZ13, and UNZ14) were chosen
and the isolated porosity (∅i ) was determined via                to determine permeability as a function of confining pres-
                                                                  sure using a hydrostatic pressure cell developed by Sanchez
∅i = ∅T − ∅c .                                             (4)    Technologies. Confining pressure (Pc ) was set to increments
                                                                  of 5.5, 9.5, and 13.5 MPa, and the flow rate was varied at
The connected porosity is the most robustly defined parame-
                                                                  each increment until an outlet pressure of between 1.1 and
ter (as total and isolated porosity rely on powder density de-
                                                                  1.5 MPa was achieved. The pore pressure pumps were then
termined for the bulk sample, not the specific core). As such,
                                                                  locked to set the pore pressure differential (1P ), and the per-
connected porosity was further analysed for average, range,
                                                                  meability was measured once the flow rate (Q) stabilised,
standard deviation, and coefficient of variation for each sam-
                                                                  to ensure permeability measurements captured steady-state
ple group (UNZ1, UNZ9a, UNZ9b, UNZ13, and UNZ14)
                                                                  flow. The pore pressure (average of inlet and outlet pressure)
and was used for presenting all permeability measurements
                                                                  was subtracted from the confining pressure to define the ef-
and mechanical results framed in terms of porosity.
                                                                  fective pressure (Peff ) for the measurements. Permeability (k)

Solid Earth, 12, 633–664, 2021                                                         https://doi.org/10.5194/se-12-633-2021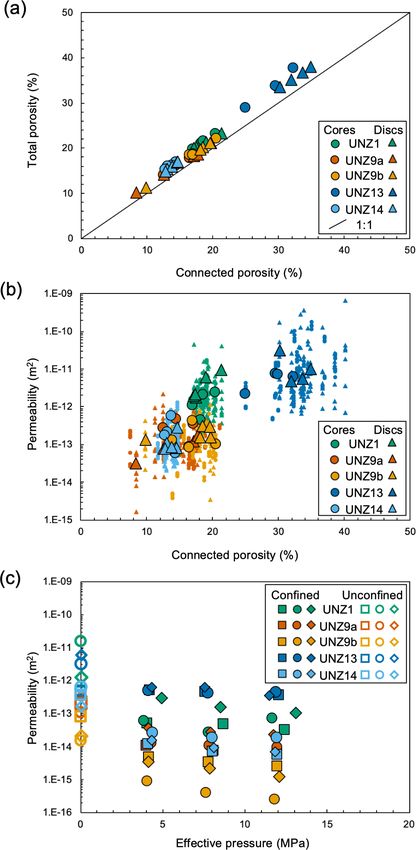
J. E. Kendrick et al.: Physical and mechanical rock properties of a heterogeneous volcano: Mount Unzen, Japan                           639

Figure 2. Photographs of sample cores used for uniaxial compressive strength (UCS) tests and discs used for indirect tensile strength testing
(UTS) using the Brazilian disc method: (a) UNZ1 – an isotropic dacite of medium porosity with large euhedral phenocrysts and pore space
comprising vesicles adjacent to phenocrysts as well as microfractures traversing the groundmass; (b) UNZ9a – a cataclastic dacite with clear
subparallel cataclastic banding comprised of fractured phenocrysts and porous fault gouge cored parallel to the fabric (see inset schematic),
both void spaces and crystals (often fragments) are smaller than in isotropic sample UNZ1; (c) UNZ9b – the same cataclastic sample cored
perpendicular to the fabric (see inset schematic); (d) UNZ13 – the lowest density sample with large phenocrysts, large sub-rounded vesicles,
and varying degrees of coalescence often positioned in close proximity to crystals; (e) UNZ14 – the densest sample selected for the study
also has large euhedral phenocrysts, with typically smaller pores and fine fractures traversing the dense groundmass. For all samples, the
direction of the principal applied stress during mechanical testing is vertical.

was determined at each Peff via Darcy’s law:                             elastic portion of the stress–strain curve picked using an au-
                                                                         tomated script written in MATLAB (Coats, 2018).
      Qµl
k=        ,                                                     (5)
      a1P                                                                2.2.2     Brazilian disc testing
where µ is the water viscosity, l is the sample length, and a is
the sample cross-sectional area. Thus, the impact of increas-            From each suite of samples, four discs were selected at
ing effective pressure on permeability and the sensitivity to            random for mechanical testing. The Brazilian disc method
confinement (cf. burial) of each sample was revealed.                    to determine indirect tensile strength (UTS) was performed
                                                                         on three dry discs and one saturated disc from each sam-
2.2     Sample deformation                                               ple group using the same 100 kN Instron 8862 uniaxial
                                                                         press with FastTrack 8800 tower and Instron Dynacell 2527
2.2.1    Uniaxial compressive testing                                    load cell. Two ceramic piezoelectric transducers (PZTs)
                                                                         were attached on the samples during testing (described in
From each suite of samples, four cores were selected at ran-
                                                                         Sect. 2.2.4). In these tests, the disc-shaped specimens were
dom for mechanical testing, including one core which had
                                                                         loaded diametrically on flat loading platens. Methods and
been measured for water permeability (Sect. 2.1.6). Uniaxial
                                                                         standards utilised for Brazilian disc testing vary in terms
compressive strength (UCS) tests were performed on three
                                                                         of deformation and loading rate as well as time to failure
dry cores and one saturated core from each sample group
                                                                         (ISRM, 1978; ASTM, 2008; Li and Wong, 2013; Hornby et
using a 100 kN Instron 8862 uniaxial press with FastTrack
                                                                         al., 2019); here, we adopt the approach of Lamb et al. (2017),
8800 tower and Instron Dynacell 2527 load cell in the Exper-
                                                                         using an equivalent diametric strain rate of 10−5 s−1 , which
imental Volcanology and Geothermal Research Laboratory at
                                                                         conforms to the ASTM (2008) recommended time to fail-
the University of Liverpool. Two ceramic piezoelectric trans-
                                                                         ure (1–10 min). All mechanical data were corrected for the
ducers (PZTs) were attached on the samples during testing
                                                                         compliance of the set-up at the relevant experimental defor-
(described in Sect. 2.2.4). A constant compressive strain rate
                                                                         mation rate. The Bluehillr 3 software was used to monitor
of 10−5 s−1 was used for testing (after ASTM, 2014), with
                                                                         axial displacement and load (N) at 100 Hz, and the conver-
load and axial displacement recorded at a rate of 100 Hz. The
                                                                         sion to tensile stress (σt ) was made in real time as follows:
Bluehill® 3 software was used to compute compressive stress
and strain (ε) during deformation using sample dimensions.                       2N
The end of each experiment was defined by a stress drop ex-              σt =         ,                                                  (6)
                                                                                 π dl
ceeding 20 % of the monitored normal stress. All mechanical
data were corrected for the compliance of the set-up at the              where d is diameter, and l is thickness (length) of the disc
relevant experimental deformation rate. Following Coats et               (ISRM, 1978). The end of each experiment was defined by a
al. (2018), Young’s modulus was calculated from the linear               stress drop exceeding 20 % of the calculated stress.

https://doi.org/10.5194/se-12-633-2021                                                                  Solid Earth, 12, 633–664, 2021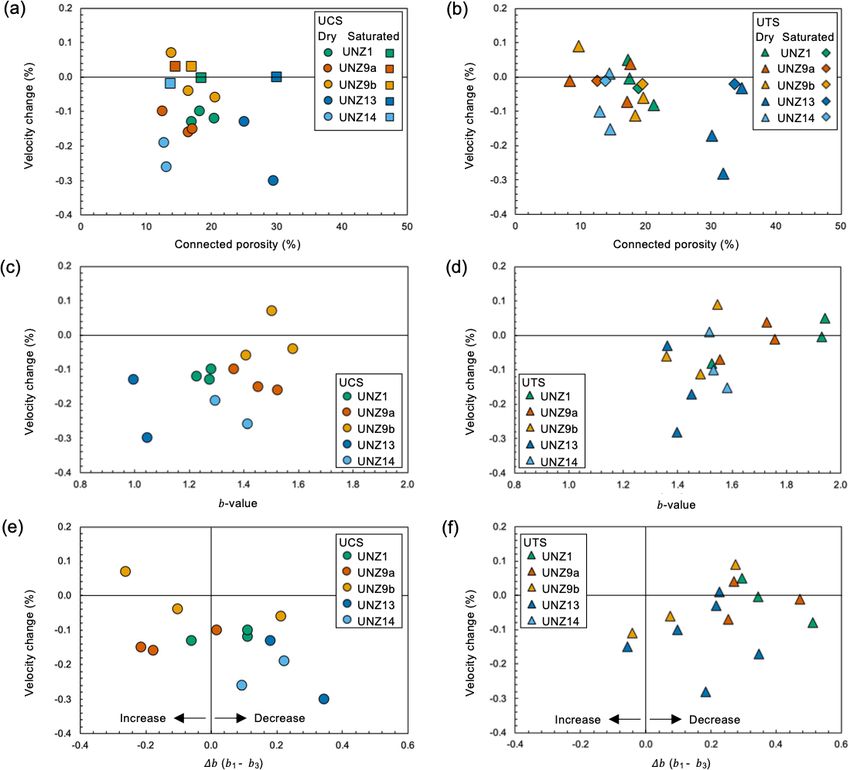
640     J. E. Kendrick et al.: Physical and mechanical rock properties of a heterogeneous volcano: Mount Unzen, Japan

2.2.3   Interrelation of mechanical properties                     isolate only passive AE events for saturated samples. Mod-
                                                                   els were fitted using a Bayesian Markov chain Monte Carlo
As the compressive and tensile strength and Young’s mod-           (MCMC) method (Ignatieva et al., 2018; Bell et al., 2018;
ulus of rocks all show a dependence on porosity (as has            Bell, 2018), and model parameters (k and λ) were reported as
been well-documented in the literature; e.g. Lavallée and          the maximum a posteriori values. The frequency amplitude
Kendrick, 2020; Heap et al., 2020, and references therein),        distribution of the AEs from each test were plotted, and from
we define the interrelation of these parameters to provide         this the b value for each experiment was calculated using the
useful first-order constraints of material properties as a func-   maximum-likelihood method (after Roberts et al., 2015). In
tion of porosity. We do so by employing least squares re-          addition, the b value was determined for each third of the test
gressions to ascribe power law relationships to compressive        to examine evolution (1b) during deformation.
strength, tensile strength, and Young’s modulus as a function
of porosity of the eruptive products. We then combine these        2.2.5    Active surveys
equations to define the interrelation of each parameter and to
express their evolving relationships as a function of porosity.    In addition to passive monitoring of acoustic emissions, ac-
We limit our analysis to the porosity range examined here          tive surveys were conducted, in which one PZT was set to
(between the 1st and 99th percentile), and we add the caveat       produce “pulses” for the entire experiment duration while the
that these relationships are likely to be lithologically depen-    other PZT recorded the pulses after they travelled through
dent due to the textural and microstructural nature of mate-       the sample. The pulses were released in “bursts” of five
rials (Lavallée and Kendrick, 2020), yet they are likely to be     events, spaced 0.5 s apart, and triggered every 5 s. Following
broadly applicable to glassy, porphyritic volcanic rocks.          the method of Lamb et al. (2017), the received bursts were
                                                                   stacked to increase the signal-to-noise ratio, and coda wave
2.2.4   Acoustic emissions – passive                               interferometry (CWI) was applied to the stacks. This method
                                                                   utilises the degree of correlation between stacked waveforms
Two ceramic piezoelectric transducers (PZTs) were attached         at different time intervals compared to the reference (here the
on the samples during both UCS and UTS tests. In the UCS           first stacked pulse) to calculate the variance of the travel time
set-up, PZTs were housed within specially machined spring-         perturbation and, thus, to provide a proxy for relative change
loaded platens that allowed direct contact at the ends of the      in velocity during the experiment (for further details of the
sample cores, whereas in the UTS set-up transducers were           method, see Lamb et al., 2017).
placed on diametrically opposing edges of the Brazil discs,
perpendicular to the direction of axial loading (see Fig. S1
in the Supplement). The sensors monitored acoustic emis-           3     Results
sions (AEs) released during deformation at a sampling rate of
                                                                   3.1     Textures, microstructures, and mineralogy
1 MHz. These signals were first fed through 20 dB amplifiers
before reaching a PAC PCI-2 two-channel recording system           The dacitic samples were deposited by block-and-ash flows
with a bandwidth of 0.001–3 MHz, allowing hit-based col-           during growth and collapse of the lava dome during the
lection and waveform streaming. For each experiment, the           1990–1995 Heisei eruption of Mount Unzen (e.g. Sato et
timing and energy of each event were recorded. AEs gen-            al., 1992). The lavas are porphyritic and partially glassy,
erated by pulsing were excluded (see Sect. 2.2.5), and the         and they show variability in crystallinity, textures, and mi-
energy of each hit was calculated using the root mean square       crostructures (Figs. 2, 3). The porous networks are com-
of the recorded waveform following the method of Lamb et           prised of connected cracks and vesicles frequently concen-
al. (2017).                                                        trated around phenocrysts (Figs. 2, 3a–e). Despite local het-
   The acceleration of acoustic emission rate was assessed         erogeneities, the pore network is relatively isotropic in sam-
by fitting Poisson point process models to the first 75 % of       ples UNZ1, UNZ13, and UNZ14 (Figs. 2 and 3a, b, and
the event time series (after this point, the quick succession of   e respectively), whereas the sample block selected due to
events hinders distinction and can lead to artificial reduction    the presence of cataclastic banding (UNZ9) observable in
of event rate) for each experiment (excluding events below         the hand specimen (Fig. 2) shows strongly anisotropic pore
an amplitude of −3.3). The model assumed an exponential            structures (Fig. 3c, d). Texturally UNZ1 and UNZ13 are sim-
acceleration (after Voight, 1989) in the rate of acoustic emis-    ilar (Fig. 3); both samples show pores up to a few millime-
sions with time:                                                   tres in size either adjacent to or completely bounding crys-
d                                                                 tals, and the groundmass hosts sub-rounded vesicles which
   = keλ(t−t0 ) ,                                           (7)    are slightly more abundant in UNZ13, leading to the UNZ1
dt
                                                                   groundmass appearing denser. The UNZ1 groundmass hosts
where the parameter k relates to the absolute amplitude of the     occasional narrow fractures (from zero to tens of microme-
acceleration, and λ is the exponential rate parameter. For this    tres) that traverse the dense areas, extending up to 5 mm
analysis only dry tests were used, as it proved impossible to      and connecting phenocrysts (Fig. 3). Sample UNZ14 has no-

Solid Earth, 12, 633–664, 2021                                                          https://doi.org/10.5194/se-12-633-2021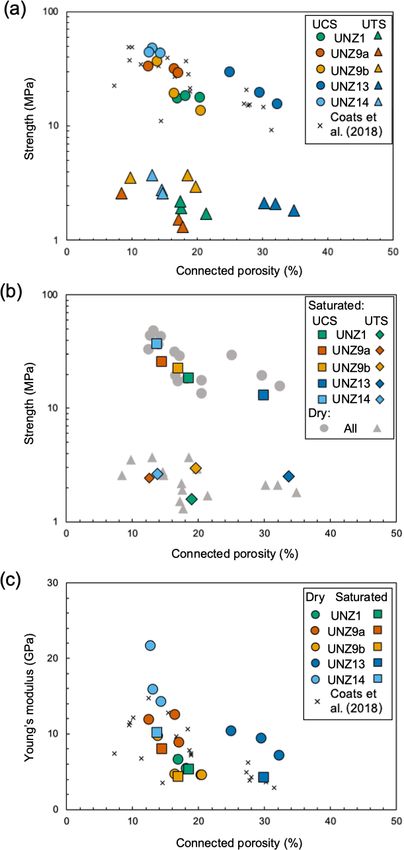
J. E. Kendrick et al.: Physical and mechanical rock properties of a heterogeneous volcano: Mount Unzen, Japan 641
tably fewer vesicles, and again, fine cracks (here finer than and was variable within a single sample group, typically with
in UNZ1, typically < 10 µm) that are more abundant and of a minor increase with increasing total porosity (Fig. 4a, Ta-
greater length-scale (occasionally > 10 mm) than in UNZ1, bles 1 and S1), as has been previously observed for the erup-
which traverse dense areas of groundmass, and pass along tive products at Mount Unzen (Coats et al., 2018). Notably,
crystal margins (Figs. 2, 3). In block UNZ9 the cataclas- the anisotropic samples (UNZ9a and UNZ9b) had higher
tic fabric was cored in two orientations to produce sample connectivity (lower isolated porosity; Table 1) than isotropic
UNZ9a parallel to the fabric and UNZ9b perpendicular to samples with similar porosity (fall closer to the 1 : 1 line in
the fabric (Figs. 2, S1). The thin sections represent a core Fig. 4a). Connected porosity of the 114 samples ranged from
of each cut vertically (UNZ9a in Fig. 3b and g, UNZ9b in 7.47 % to 40.12 %, and averages of each of the five sample
Fig. 3c and h) to highlight the fabric with respect to com- groups ranged from 13.69 % to 33.13 %, ranking the sam-
pression direction in later strength tests (note that the Brazil ples by connected porosity (note the difference to the rank-
discs are diametrically compressed). The UNZ9 samples ing in total porosity) as follows from least to most porous:
comprise variably porous cataclastic bands with fragmen- UNZ14, UNZ9a, UNZ9b, UNZ1, and UNZ13 (Table 1). The
tal phenocrysts (Figs. 2, 3). Thus, porosity is anisotropically standard deviation within a single sample group was gener-
distributed across denser and more porous bands, although ally higher for higher porosity. Variability within each sam-
still typically focused around crystals, here often crystal frag- ple group can be better evaluated by considering the co-
ments, and is similarly distributed to the porosity of UNZ1. efficient of variation; the isotropic samples (from least to
The samples have large (often > 3 mm) phenocrysts most porous; UNZ14, UNZ1, and UNZ13) have lower coeffi-
(Fig. 3f–j) which are easily identifiable in the hand speci- cients of variation (6.62 %, 6.23 %, and 9.97 % respectively),
men (Fig. 2), the largest and most abundant of which are pla- whereas the anisotropic samples (UNZ9a and UNZ9b) have
gioclase (> 25 vol %), followed by amphiboles (∼ 5 vol %) higher coefficients of variation (23.24 % and 16.25 % respec-
and frequently fractured biotites (∼ 5 vol %) with smaller and tively). Porosity constrained here closely matches (and spans
more infrequent quartz and pyroxenes (each < 2 vol %), with the range of) lavas previously measured for the 1990–1995
the same minerals also forming microphenocrysts (Fig. 3), as dome eruption (e.g. Coats et al., 2018; Cordonnier et al.,
has previously been described for Unzen lavas (e.g. Nakada 2009; Hornby et al., 2015; Kueppers et al., 2005; Wallace
and Motomura, 1999). The glassy groundmass hosts micro- et al., 2019).
lites of 10–100 µm of plagioclase, pyroxene, quartz, parga-
site, and iron-titanium oxides that make up approximately 3.3 Permeability
30 vol %, in keeping with previous observations of ground-
mass crystallinity, which slowly increased from ∼ 30 to 3.3.1 Unconfined permeability and permeability
∼ 50 vol % throughout the eruption (Nakada et al., 1995; variability
Nakada and Motomura, 1999). The cataclastic bands of
sample UNZ9 host angular fragments of crystals, some of A handheld minipermeameter was used to estimate the per-
which are retained in fragmental lenses of single minerals meability of cores and discs as well as to assess local varia-
(Fig. 3g, h), the relics of grain size reduction compared with tions using up to 10 measurements on different parts of the
the pristine lavas of UNZ1, UNZ13, and UNZ14 (Figs. 2, 3), sample surface. The range of all 1065 measurements spanned
as has been noted in other conduit fault zone products at 1.65 × 10⁻¹⁵ to 1.88 × 10⁻⁹ m2 with standard deviations of
Mount Unzen (e.g. Wallace et al., 2019). permeability of up to 6.01 × 10⁻¹⁰ m2 within a single core
or disc, corresponding to a coefficient of variation of up to
3.2 Porosity and porosity variability 259 % (see Table S1; note that where the coefficient of vari-
ation was less than 10 % after five measurements, no further
Across the suite of 114 samples, total porosity determined by measurements were made). Considering the 114 samples,
helium pycnometry ranged from 9.14 % to 42.81 %, with a the averaged permeability of cores and discs ranged from
significant range observed within each sample group (see Ta- 1.54 × 10⁻¹⁴ to 2.67 × 10⁻¹⁰ m2 (Fig. 4b shows the 1065
bles 1 and S1 in the Supplement). The average total porosity individual measurements made on 114 samples as well as
for each sample group spanned a narrower range of 16.05 % the averages for each core or disc used for further testing).
to 36.46 %, ranking the samples as follows from least to The permeability shows a positive correlation with porosity.
most porous: UNZ9a, UNZ14, UNZ9b, UNZ1, and UNZ13 The average permeability may span > 2 orders of magnitude
(Table 1). Density ranged from 1.54 to 2.40 g cm−3 (Ta- for a given porosity, yet despite the large scatter of perme-
ble S1), closely matching previously constrained densities of ability, the distinct grouping of the sample suites (i.e. UNZ1,
the eruptive products of 1.6–2.4g cm−3 with bimodal distri- UNZ9a, UNZ9b, UNZ13, and UNZ14) is clearly observable
bution (Kueppers et al., 2005). The solid density of the five (Fig. 4b). Notably, permeability is lower for the macroscop-
sample types spanned a narrow range of 2.64–2.67 g cm−3 , ically anisotropic sample UNZ9b than for the macroscopi-
representing the similarity in constituent phases of the lavas. cally isotropic sample UNZ1 of similar porosity, although no
The degree of isolated porosity ranged from 0.39 % to 5.37 % such discrepancy is noticed with macroscopically isotropic
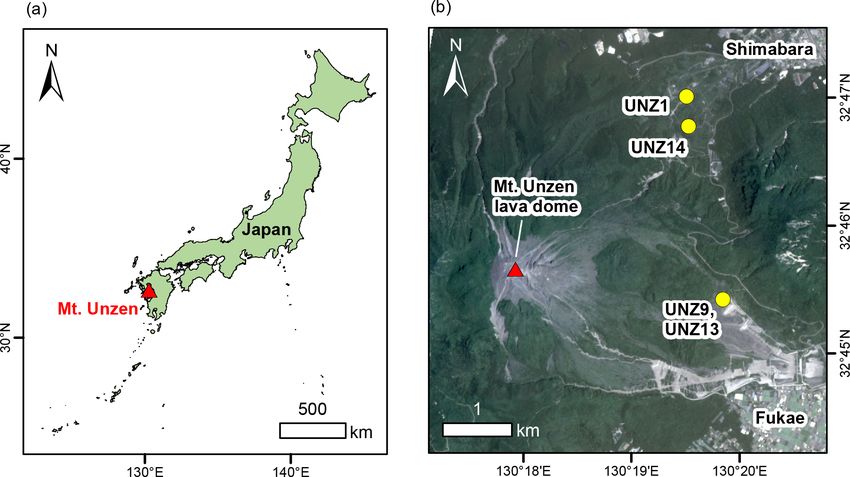
https://doi.org/10.5194/se-12-633-2021 Solid Earth, 12, 633–664, 2021642 J. E. Kendrick et al.: Physical and mechanical rock properties of a heterogeneous volcano: Mount Unzen, Japan Figure 3. Images of thin sections in reflected light with a UV filter (a–e) and plane-polarised light (f–j) showing the range of textures of the tested materials: (a) UNZ1 has pore space concentrated around phenocrysts, occasional sub-rounded vesicles, and a relatively dense groundmass that hosts occasional fractures of 0–20 µm width, up to ∼ 2 mm in length; (b) UNZ9a hosts pore space concentrated in laterally extensive bands in the orientation of cataclastic fabric observable in the hand specimen (vertical), which are interspersed by denser bands, pores border angular fragmental crystals; (c) UNZ9b shows the same textures as in UNZ9a, here orientated horizontally, and fine fractures are additionally visible within the groundmass and broken phenocrysts (note the large rounded black patch in the centre is a poorly impregnated pore, not a sub-rounded phenocryst); (d) UNZ13 has distinguishing sub-rounded vesicles in the groundmass and concentrated around phenocrysts, phenocrysts occasionally host a number of very fine fractures (note the large rounded black patch at the top right is a poorly impregnated pore); (e) UNZ14 shows smaller pores more distributed but still localised adjacent to phenocryst, occasional thin (< 10 µm) fractures of up to ∼ 10 mm propagate through the groundmass connecting phenocrysts, which themselves are highly fractured (with hairline fractures). Transmitted light images (f–j) allow the identification of plagioclase (Pl, > 25 vol %), amphibole (Am, ∼ 5 vol %), biotite (∼ 5 vol %), and pyroxene (Px, < 2 vol %) phenocrysts and microphenocrysts (quartz is present but not shown), and glassy groundmass with microlites of plagioclase, pyroxene, quartz, amphibole, and iron-titanium oxides of 10–100 µm (∼ 30 vol %). Plagioclases show occasional zoning (i) and concentric bubble trails (f and j). The cataclastic samples UNZ9a (g) and UNZ9b (h) additionally have broken crystals, most frequently plagioclase that forms trails parallel to elongate porosity-rich bands, and the groundmass shows heterogeneously distributed light and dark zones. Solid Earth, 12, 633–664, 2021 https://doi.org/10.5194/se-12-633-2021
J. E. Kendrick et al.: Physical and mechanical rock properties of a heterogeneous volcano: Mount Unzen, Japan                           643

Table 1. Sample (core and disc) porosity and unconfined permeability overview.

            Number     Average    Average              Connected porosity                          Unconfined permeability
  Sample    of         total      isolated
                                             Average       Standard       Coefficient    Average          Standard       Coefficient
            samples    porosity   porosity
                                                           deviation      of variation                    deviation      of variation
                       (%)        (%)        (%)                          (%)            (m2 )                           (%)
  UNZ1      24         21.33      2.70       18.64         1.16           6.23           3.05 × 10⁻¹²     3.30 × 10⁻¹²   108.38
  UNZ9a     20         16.05      1.31       14.73         3.42           23.24          1.89 × 10⁻¹³     1.65 × 10⁻¹³   87.24
  UNZ9b     19         18.86      1.64       17.22         2.80           16.25          2.19 × 10⁻¹³     1.44 × 10⁻¹³   65.98
  UNZ13     27         36.46      3.32       33.13         3.30           9.97           2.89 × 10⁻¹¹     5.51 × 10⁻¹¹   190.66
  UNZ14     24         16.08      2.39       13.69         0.91           6.62           1.93 × 10⁻¹³     1.82 × 10⁻¹³   94.15

UNZ14 which spans overlapping ranges of porosity and per-              viations are also comparable across the different sample ge-
meability (Fig. 4b, Table S1).                                         ometries, with only coefficients of variation showing a minor
   We additionally used the permeability of each core and              reduction at the sample as opposed to the block scale.
disc to collate the average permeability, standard deviation,
and coefficient of variation of each sample group (Table 1).           3.3.2     Permeability as a function of effective pressure
Interestingly, the permeability of the anisotropic samples
cut parallel (UNZ9a) and perpendicular (UNZ9b) converge                Permeability was measured for three samples from each
to similar averages despite plotting somewhat distinctly in            group at three increments of confining pressure and, hence,
porosity–permeability space (Fig. 4b). The standard devia-             effective pressure (Fig. 4c; Tables 3, S3). The permeability
tion and coefficient of variation of permeability are notably          at the first increment of ∼ 4 MPa is 1 to 2 orders of magni-
higher for the most porous, permeable sample UNZ13 (Ta-                tude lower than the gas permeability at atmospheric pressure
ble 1), which also has the largest absolute range in con-              conditions for all samples (Sect. 3.3.1) and further decreases
nected porosity of more than 15 % (Fig. 4b, Table S1). The             with increasing effective pressure (Fig. 4c, Table 3). Here, the
anisotropic samples have the lowest coefficients of variation          lowest permeability samples, with porosity comprised pri-
of permeability, despite having the largest coefficient of vari-       marily of microfractures (Fig. 1), are most sensitive to effec-
ation of porosity (Table 1).                                           tive pressure, with the largest reductions in permeability seen
   As a final measure of permeability variation within the             in samples UNZ1 and UNZ9b (Fig. 4c). Similarly to the un-
sample groups and to compare variations across the sam-                confined measurements, the most permeable samples at each
ple to block scale, we additionally performed 379 perme-               effective pressure are isotropic UNZ13, followed by isotropic
ability measurements across the planar surfaces of the dis-            UNZ1, isotropic samples UNZ14 are again very similar to
sected sample blocks UNZ9 and UNZ14. The macroscopi-                   UNZ9a, and the least permeable samples are UNZ9b. Thus,
cally anisotropic block UNZ9 was cut perpendicular to the              the cores cut parallel to the cataclastic fabric (UNZ9a) are
direction of the cataclastic fabric (and, thus, is geometrically       significantly more permeable than those cut perpendicular
equivalent to the sample group UNZ9a), whereas UNZ14 is                (UNZ9b), with a difference of more than an order of mag-
macroscopically isotropic. Despite their textural differences,         nitude which was not noted in the unconfined permeability
the average porosity and permeability of the two sample                values (Table 1) due to the nature of pore pressure dissipa-
groups (Table 1; Fig. 3a, b) described above (determined on            tion during surface measurements with minipermeameters.
cores and discs) are very similar. An additional 262 mea-
surements were made for sample UNZ9 and 117 for sam-                   3.4     Mechanical data
ple UNZ14 (Tables 2, S2; Fig. S2). The averages for block
                                                                       3.4.1     Strength in dry and water-saturated conditions
surface permeability measurements for UNZ9 and UNZ14
were 1.53 × 10⁻¹³ m2 and 1.75 × 10⁻¹³ m2 respectively. The             Stress–strain curves for all uniaxial compressive strength
permeability of UNZ9 spans a slightly broader range, almost            (UCS) tests and Brazilian disc indirect tensile strength (UTS)
3 orders of magnitude, although the higher number of mea-              data are shown in Fig. 5. The UCS of dry samples ranged
surements for UNZ9 ensures a similar standard deviation and            from 13.48 to 47.80 MPa and was dominantly controlled
coefficient of variation for each suite (Table 2). In exploring        by porosity (Fig. 6a), as has been previously observed for
the role of sample size on permeability determination using            Mount Unzen lavas (Coats et al., 2018) and other geomateri-
the TinyPerm II minipermeameter, we also note that the mea-            als. Using the average of three tests, the highest compressive
surements made on the block surfaces produce very similar              strength (44.81 MPa) was the least porous sample UNZ14,
minimum, maximum, and average permeabilities to the mea-               and the lowest compressive strength (17.69 MPa) was the in-
surements made on cores and discs (Table 2). Standard de-              termediate porosity sample UNZ1 (Figs. 5a–e, 6a; Table 4).

https://doi.org/10.5194/se-12-633-2021                                                                  Solid Earth, 12, 633–664, 2021
You can also read