Planning for Climate Impacts on Vineyards and Varieties - Argos Analytics, LLC www.argosanalytics.com
←
→
Page content transcription
If your browser does not render page correctly, please read the page content below
Planning for Climate Impacts on
        Vineyards and Varieties
           Argos Analytics, LLC
          www.argosanalytics.com

ARGOS          (c) 2017 Argos Analytics, LLC   1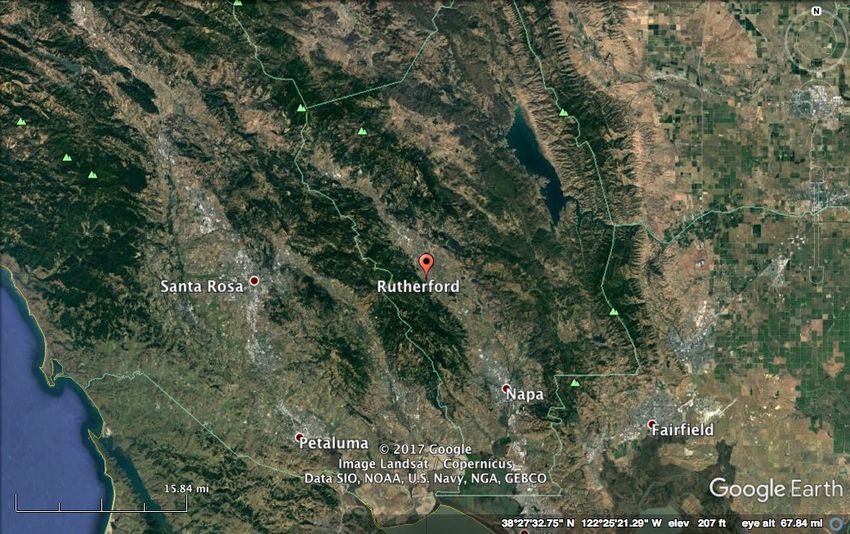
Executive Summary

 •   “…climate is arguably the most critical environmental aspect in
     ripening fruit to its optimum quality to produce a desired wine style.”
     Jones 2014
 •   Wine growing regions all over the world, including Bordeaux,
     Australia and England, are seeing the effects of global warming
     while even greater impacts are in store around the globe
 •   Previous studies have focused on the broad impacts of climate
     change on wine growing regions, offering limited guidance for
     individual vineyards
 •   Now, by combining well established climate metrics for individual
     wine varieties with the latest downscaled climate projections, Argos
     can identify localized climate impacts on specific varieties
 •   This means you can now look ahead and plan for what’s coming,
     rather than waiting to see what happens and trying to react to it

ARGOS                         (c) 2017 Argos Analytics, LLC                    2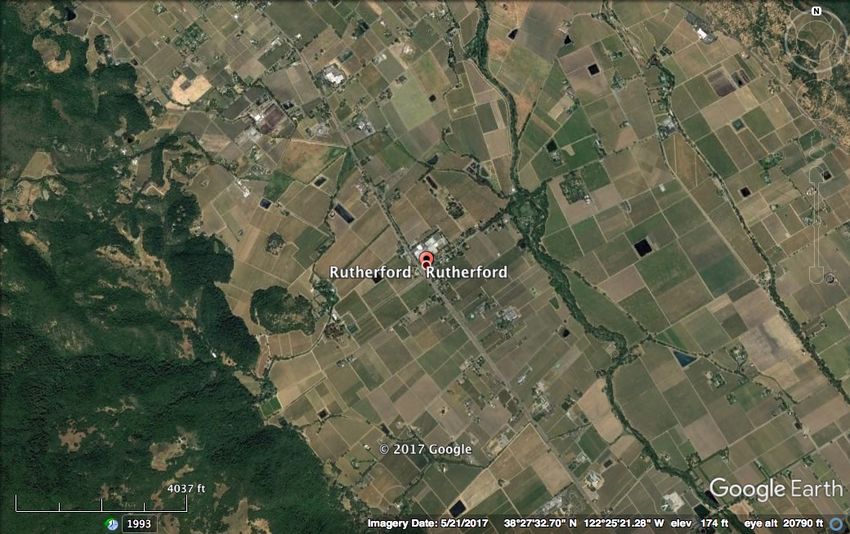
Some Straws in the Wind

 •   France: “From Champagne in the north to the Rhone valley in the
     south, vines are flowering earlier and fruit is maturing more
     quickly than a generation ago,” while the future viability of Merlot in
     Bordeaux is threatened by rising temperatures and researchers are
     looking for varieties to replace it according to Bloomberg
 •   Australia: “…higher temperatures causing earlier ripening and
     reduced grape quality” according to the Climate Council—as a
     result, some wine producers are eyeing Tasmania’s cooler climate
 •   England: Producers of high quality sparkling wines in Southeastern
     England are benefiting from higher temperatures
 •   West Coast: California premium wine producers may become more
     dependent on irrigation, while British Columbia sees a growing
     opportunity in Riesling, Chardonnay and Pinot Noir grapes

ARGOS                        (c) 2017 Argos Analytics, LLC                 3
Northern California 2017

 •   Wettest winter on record
 •   Hail storm in June
 •   Hottest summer on record
 •   Labor Day heat wave
 •   Devastating October wildfires

ARGOS                       (c) 2017 Argos Analytics, LLC   4
Global change in viticulture suitability RCP 8.5. Change in viticulture suitability is shown between current
        (1961–2000) and 2050 (2041–2060) time periods, showing agreement among a 17-GCM ensemble.
        Areas with current suitability that decreases by midcentury are indicated in red (>50% GCM agreement).
        Areas with current suitability that is retained are indicated in light green (>50% GCM agreement) and
        dark green (>90% GCM agreement), whereas areas not suitable in the current time period but suitable
        in the future are shown in light blue (>50% GCM agreement) and dark blue (>90% GCM agreement).
        Insets: Greater detail for major wine-growing regions: California/western North America (A), Chile (B),
        Cape of South Africa (C), New Zealand (D), and Australia (E).

ARGOS                                        Source: Hannah et al 2013                                                 5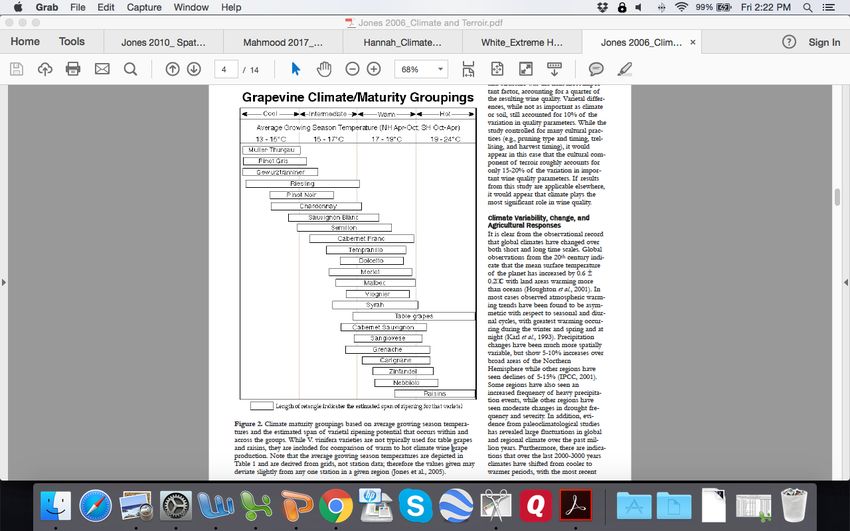
Some Key Climate Metrics
• Growing degree days (GDD)—summation of daily mean
temperatures over 50o F through the growing season
• Biologically effective degree days (BEDD)—modified by an upper
temperature of 66.2o F and corrections for latitude and diurnal
temperature range
• Growing season temperature (GST)—mean daily temperature for
the April-October growing season (Northern Hemisphere)
• Month of maturity temperature (MMT)—mean daily temperature
for the month in which a varietal matures
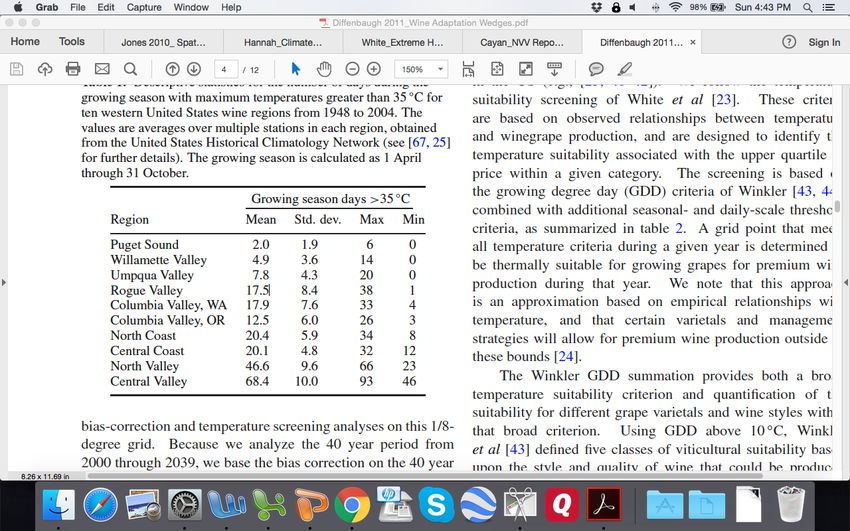
• Extreme hot days (EHD)—number of days with maximum
temperatures of 95o F or higher during the growing season
• Extreme cold days (ECD)—number of Fall days below 20o F plus
Winter days below 10o F plus Spring days below 20o F
ARGOS (c) 2017 Argos Analytics, LLC 6“The combined adjustments give a basis for calculating
“biologically effective” temperature summations for grape
vines. ..it now appears to be possible to predict an
average date of maturity for any grape variety, of known
maturity type, in all existing viticultural environments to
within about a week either way.” Gladstones 1992
“Furthermore, the HI (Huglin Index) and BEDD appear to
better differentiate the within-AVA structure of the climate
indices, with BEDD showing the greatest promise
because of its diurnal temperature range adjustment and its
tie to variety maturity classes.” Jones et al 2010
ARGOS (c) 2017 Argos Analytics, LLC 7Winegrape Maturity Groups
Red Wines White or rose wines
Traminer, Sylvaner, Scheurebe,
Ebling,Morio-Muskat, Kerner,
Group 3 Pinot Noir, Meunier, Gamay,
Green Veltliner, Chardonnay,
Dolcetto, Bastardo, Tinta
2070 day oF Aligote, Melon, Sauvignon Blanc,
Carvalha, Tinta Amarella
Frontignac, Pedro Ximenes,
Verdelho, Sultana
Semillon, Muscadelle, Riesling,
Group 4 Malbec, Durif, Zinfandel, Schiava,
Welschreisling, Furmint, Leanyka,
Tempranillo, Tinta Madeira,
2160 day oF Harslevelu, Sercial, Malvasia
Pinotage
Bianca, Cabernet Franc
Chenin Blanc, Folle Blanche,
Group 5 Merlot, Cabernet Franc, Shiraz,
Crouchen, Rousanne, Marsanne,
Cinsault, Barbera, Sangiovese,
2250 day oF Viognier, Taminga, Cabernet
Touriga
Sauvignon
Cabernet Sauvignon, Ruby
Group 6 Cabernet, Mondeuse, Tannat,
Columbard, Palomino, Dona
Kadarka, Corvina, Nebbiolo,
2340 day oF Branca, Rabigato, Grenache
Ramisco, Alvarelhao, Mourisco
Tinto, Valdigue
ARGOS Adapted from Gladstones 1992 8ARGOS Source: Jones 2006 9
Extreme Hot Days by Region

ARGOS          Source: Diffenbaugh et al 2011   10
Localized Climate Projections

 •   Current global climate models (GCMs) have a spatial resolution of
     about 70 miles, too coarse for evaluating individual vineyards
 •   A number of methods, referred to as downscaling methods, have
     been developed to generate finer resolution climate projections from
     GCM outputs
 •   One of the most advanced is Localized Constructed Analogs
     (LOCA), developed at Scripps and based on the historical
     correlation between local and large scale weather conditions
      – 32 climate models
      – 4 mile resolution
      – Daily maximum and minimum temperature and precipitation (plus other
        variables) through 2100
      – Being used for the California Fourth Climate Assessment now underway

ARGOS                        (c) 2017 Argos Analytics, LLC                11
Rutherford at GCM scale
Rutherford at LOCA scale
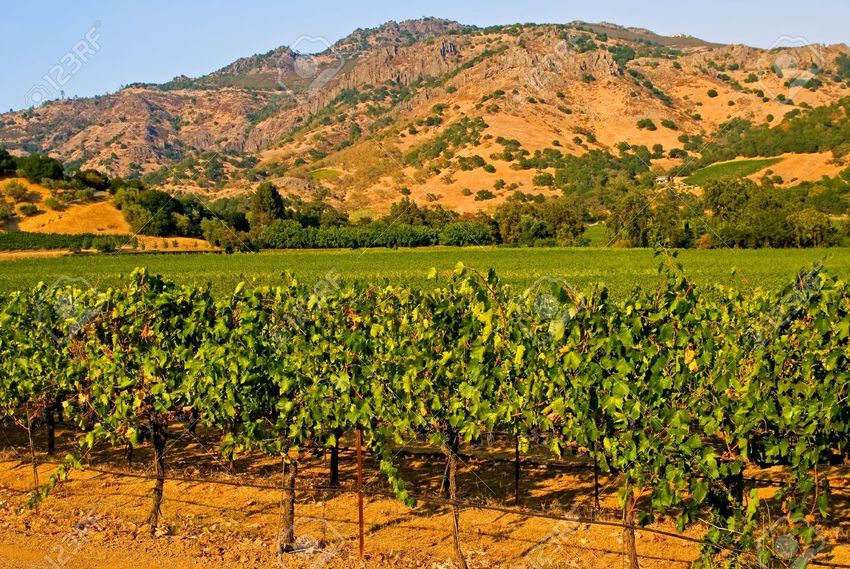
ARGOS (c) 2017 Argos Analytics, LLC 12Case Study: Cabernet Sauvignon in
a Napa Valley Hillside Vineyard
ARGOS (c) 2017 Argos Analytics, LLC 13The objective of the study was to evaluate the
suitability of the vineyard for Cabernet Sauvignon
over the next thirty years by looking at:
• Projected maturity date based on projected
biologically effective degree days
• Viability of Cabernet Sauvignon based on
projected growing season and month of
maturity temperatures
• Projected rainfall in October through April
rainfall
ARGOS (c) 2017 Argos Analytics, LLC 14Maturity Date Trend
Time Period Maturity Date
Percentile
10th 50th 90th
1990s 10/18 10/18 10/18
2010s 10/17 10/11 10/5
2020s 10/10 10/3 9/28
2030s 10/6 9/28 9/26
2040s 9/28 9/23 9/19
ARGOS (c) 2017 Argos Analytics, LLC 15Growing Season Temperature Trend
69#
68#
Growing(Season(Temperature((deg(F)(
67#
66#
65# Lower#Limit#
64# 10th#
63# 50th#
62# 90th#
61# Upper#Limit#
60#
59#
58#
1990s# 2010s# 2020s# 2030s# 2040s#
ARGOS (c) 2017 Argos Analytics, LLC 16Month of Maturity Temperature Trend
76#
74#
Month&of&Maturity&Temperature&(deg&F)&
72#
70# Lower#Limit#
68# 10th#
50th#
66#
90th#
64# Marginal#
Upper#Limit#
62#
60#
58#
1990s# 2010s# 2020s# 2030s# 2040s#
ARGOS (c) 2017 Argos Analytics, LLC 17Rainfall Trend
50#
49#
48#
47#
46#
October(Through(April(Rainfall((in)(
45#
44#
43#
42#
41# 10th#
40#
39# 50th#
38#
90th#
37#
36#
35#
34#
33#
32#
31#
30#
1990s# 2010s# 2020s# 2030s# 2040s#
ARGOS (c) 2017 Argos Analytics, LLC 18Key Takeaways
• Thirty years from now, mean maturity dates for Cabernet Sauvignon
are projected to be about two and a half weeks earlier than today
• By then, GST and MMT are projected to move from the bottom of
their respective ranges for Cabernet Sauvignon to above the
middle of their acceptable ranges
• Projected changes in October-April rainfall range from a modest
downward trend to a significant upward trend, although to year
variability is expected to increase
• Overall, climate conditions in the vineyard are projected to
remain favorable for Cabernet Sauvignon for the next thirty
years
ARGOS (c) 2017 Argos Analytics, LLC 19Some Questions For You to Consider
• How long will the varieties currently planted in the your vineyard
remain viable as temperatures rise?
• Are there opportunities for adaptation that will extend that window?
• Are there other varieties that would be more suitable in the future?
• Will changes in rainfall patterns, including greater year-to-year
variability, require new irrigation practices?
• Are there other locations or regions that will be more attractive in
the future?
• Now is the time to start getting some answers
ARGOS (c) 2017 Argos Analytics, LLC 20Argos Can Help You Find Them
• Our standard climate analysis package includes the following
climate metrics by decade through the 2040s for one vineyard and
one variety
– Projected maturity dates
– Projected growing season temperature
– Projected month of maturity temperature
– Projected extreme hot days
– Projected rainfall annually and during the growing season
– All projections include decadal means and year-to-year variability at the 10th, 50th
and 90th percentiles of the climate projections
• Other options include
– Additional varieties
– Projected wildfire risk
– Projected extreme cold day
– Projections further into the future
– Custom analyses
ARGOS (c) 2017 Argos Analytics, LLC 21References
https://www.bloomberg.com/news/articles/2015-10-15/merlot-faces-the-heat-as-
bordeaux-seeks-climate-proof-vineyards
http://www.burchfamilywines.com.au/news/article/04012017-169/how-climate-change-
is-affecting-the-australian-wine-industry.aspx
https://www.theguardian.com/lifeandstyle/wordofmouth/2013/may/07/climate-change-
transforming-british-wine
http://www.npr.org/sections/thesalt/2016/03/21/470872883/an-upside-to-climate-
change-better-french-wine
https://www.guildsomm.com/public_content/features/features/b/kelli-white/posts/
exploring-british-columbia
Hannah et al, Climate Change, Wine and Conservation, Proceedings of the National
Academy of Sciences, April 23, 2013.
Gladstones, Viticulture and Environment, Winetitles, Adelaide, 1992.
Jones et al, Spatial Analysis of Climate in Wine Grape Growing Regions in the Western
United States, American Journal of Enology and Viticulture, January 2010.
Jones, Climate and Terroir: Impacts of Climate Variability and Change on Wine,
Geological Society of America Annual Meeting, November 2, 2003.
Diffenbaugh et al, Climate adaptation wedges: a case study of premium wine in the
Western United States, Environmental Research Letters, June 30, 2011.
Pierce et al, Statistical Downscaling Using Localized Constructed Analogs (LOCA),
Journal of Hydrometeorology, December, 2014.
ARGOS (c) 2017 Argos Analytics, LLC 22You can also read