Seasonal forecasts presented by: Latest Update
←
→
Page content transcription
If your browser does not render page correctly, please read the page content below
Seasonal forecasts
        presented by:

  Latest Update: 10 November 2020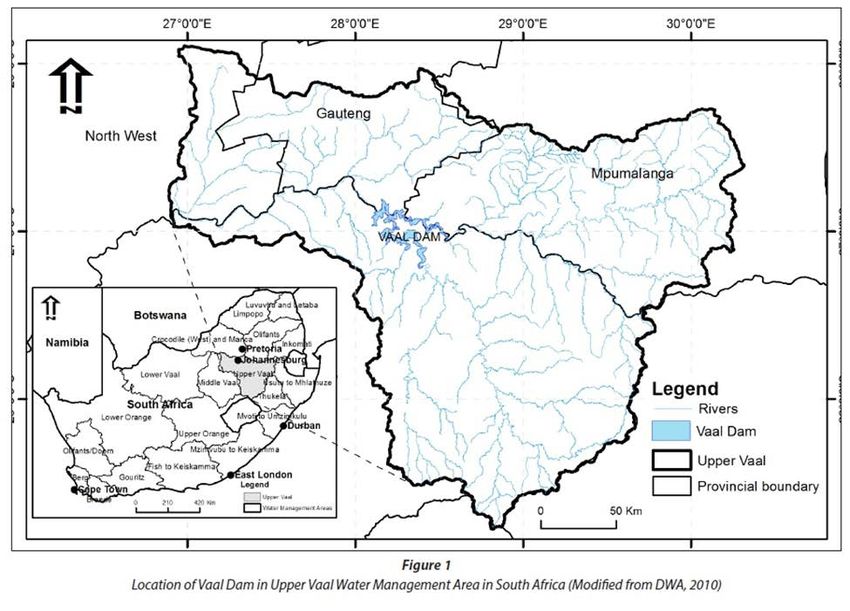
Are you a farmer who wants to make use of science-based seasonal predictions for your farm? If you are interested to be part
of an initiative at the University of Pretoria that involves the development of seasonal forecast systems for farms, specifically
tailored to farmers’ needs, please send an email to WALandman1981@gmail.com
                               Have a look at this example of end-of-season crop yield forecasts for a farm near Bapsfontein.
                               The farmer provided several decades of crop-yield data and these data were subsequently used
                               to create a crop forecast model specific to the farm

                                                                           Above is the crop-yield forecast for the coming
                                                                           season. The forecast is for enhanced probabilities of
                                                                           below-normal (low) crop yield for the farm. The
                                                                           farmer may be able with support to use this
                                                                           forecast information to plan for the coming season
                           On the left are time series of forecast and observed crop yields at the time of
                           harvest for the years indicated. Next to the time series are probabilistic Share your data
                           forecasts over the same 9-years for below- (low yields), near- (about average)
                           and above-normal (high yields). For example, in 2008 the forecast and
                                                                                                            and become part
                           observed index values are high and positive (figure on the left), and the of this initiative
                           highest predicted probability is for above-normal yield (figure in the middle).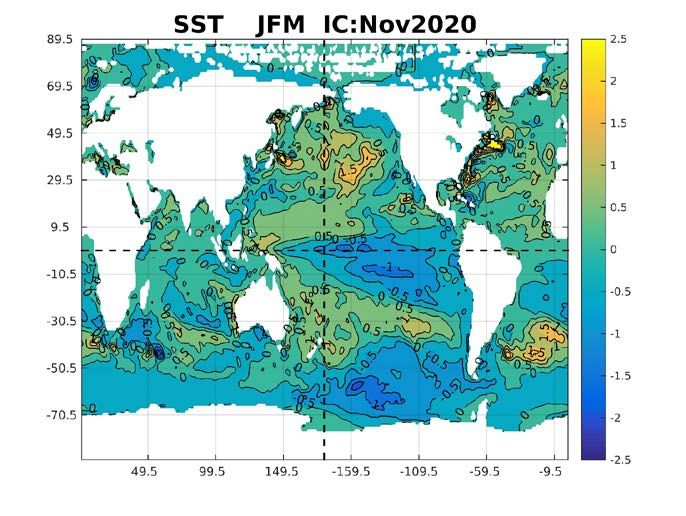
• The seasonal forecasts presented here by Seasonal Forecast Worx are based on forecast output of
  the coupled ocean-atmosphere models administered through the North American Multi-Model
  Ensemble (NMME) prediction experiment (http://www.cpc.ncep.noaa.gov/products/NMME/;
  Kirtman et al. 2014). NMME real-time seasonal forecast and hindcast (re-forecast) data are obtained
  from the data library (http://iridl.ldeo.columbia.edu/) of the International Research Institute for
  Climate and Society (IRI; http://iri.columbia.edu/).
• NMME forecasts are routinely produced and are statistically improved and tailored for southern
  Africa and for global sea-surface temperatures by employees and post-graduate students in the
  Department of Geography, Geoinformatics and Meteorology at the University of Pretoria
  (http://www.up.ac.za/en/geography-geoinformatics-and-meteorology/). Statistical post-processing is
  performed with the CPT software (http://iri.columbia.edu/our-expertise/climate/tools/cpt/).
• Why do we apply statistical methods to climate model forecasts?
• “…statistical correction methods treating individual locations (e.g. multiple regression or principal
  component regression) may be recommended for today’s coupled climate model forecasts”.
  (Barnston and Tippett, 2017).
• Why do we not use just a single model in our forecasts?
• “…multi-model forecasts outperform the single model forecasts…” (Landman and Beraki, 2012).

• For the official seasonal forecast for South Africa, visit the South African Weather Service website at
  http://www.weathersa.co.za/images/data/longrange/gfcsa/scw.pdf
ENSO and Global SST
    Forecasts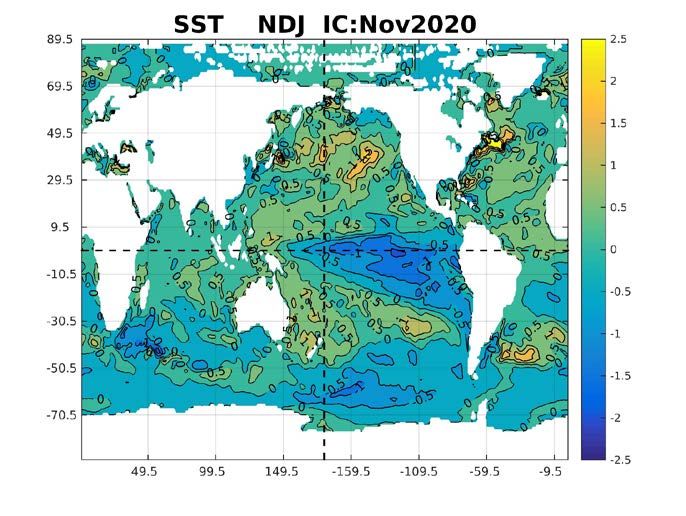
Prediction Method
  • Forecasts for global sea-surface temperature (SST) fields are obtained
    through a combination of NMME models and a linear statistical
    model, that uses antecedent SST as a predictor (Landman et al. 2011).
    Forecasts for the Niño3.4 area (see insert) are derived from the global
    forecasts.
  • SST forecasts from the NMME models are variance and bias
    corrected.
  • Three-month Niño3.4 SST forecasts are produced for three categories:
     • El Niño: SST above the 75th percentile
     • La Niña: SST below the 25th percentile
     • Neutral: Neither El Niño nor La Niña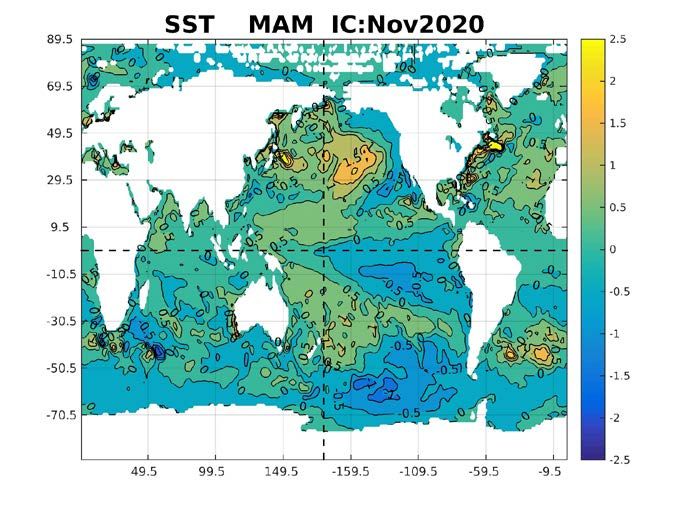
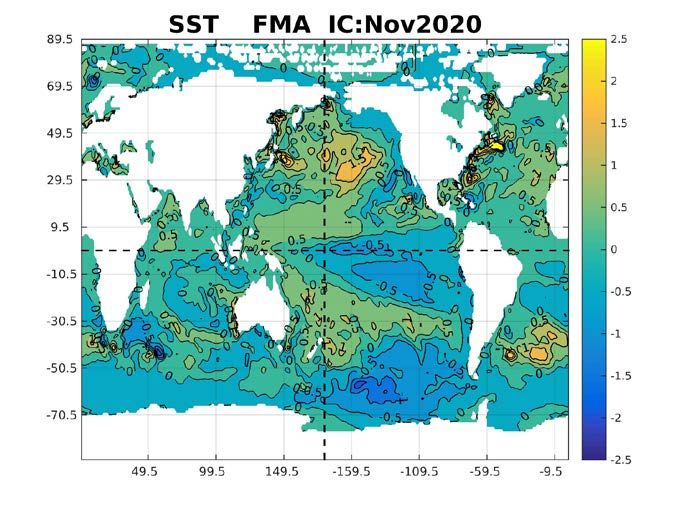
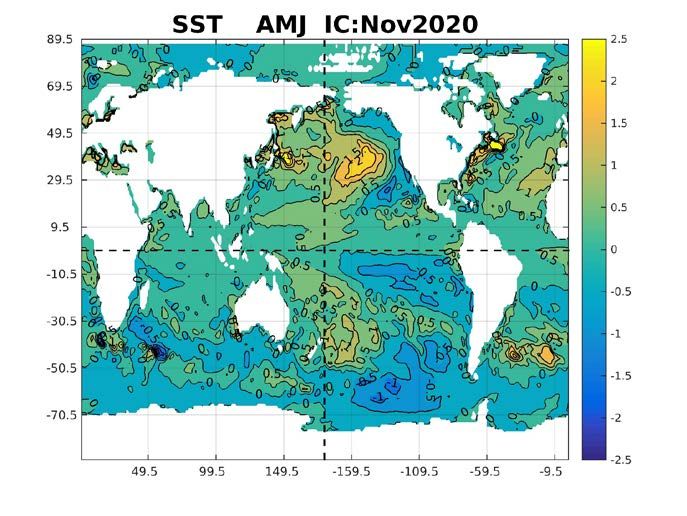
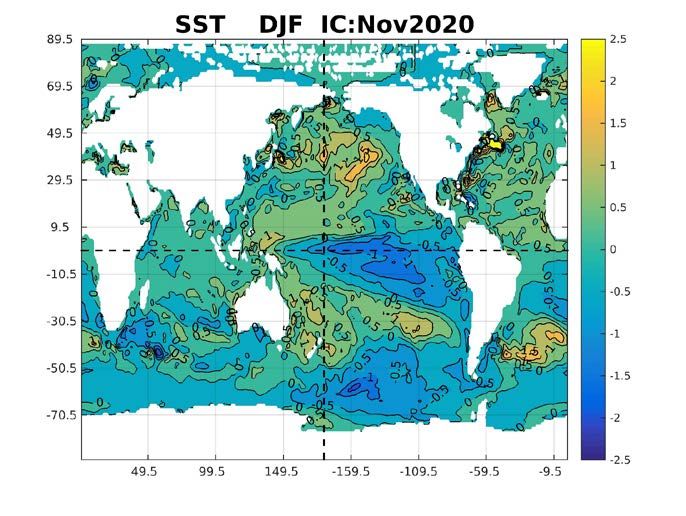
SST anomalies

Round-up: ENSO
• The UP model predicts weak to moderate La Niña
  conditions for mid-summer, but ENSO-neutral
  conditions towards autumn
• Most forecast models continue to be for colder SST,
  with just a few warmer than the UP model (CS-IRI-
  MM)
Southern Africa
   Forecasts
Prediction Method
• Three-month seasons for seasonal rainfall totals and average maximum
temperatures of NMME ensemble mean forecasts are interpolated to Climatic
Research Unit (CRU; Harris et al. 2014) grids (0.5°x0.5°), by correcting the mean
and variance biases of the NMME forecasts. Probabilistic forecasts are
subsequently produced from the error variance obtained from a 5-year-out cross-
validation process (Troccoli et al. 2008). Forecasts cover a 6-month period.
• Forecasts are produced for three categories:
• Above: Above-normal (“wet” / “hot”, rainfall totals / maximum temperatures higher than the
75th percentile of the climatological record)
• Below: Below-normal (“dry” / “cool”, rainfall totals / maximum temperatures lower than the
25th percentile of the climatological record)
• Normal: Near-normal (“average” season)
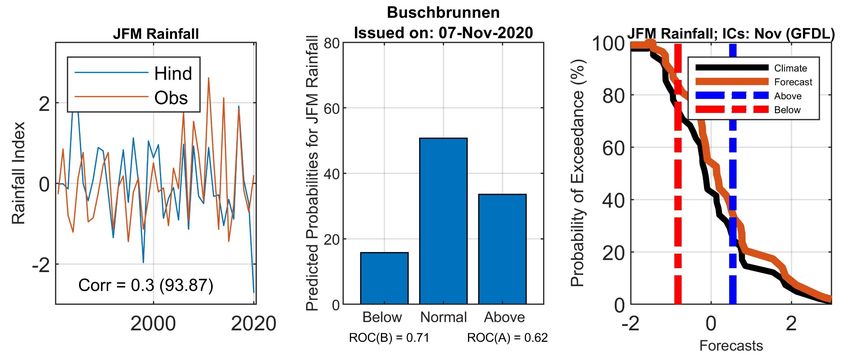
• Verification:
• ROC Area (Below-Normal) – The forecast system’s ability to discriminate dry or cool seasons
from the rest of the seasons over a 32-year test period. ROC values should be higher than 0.5
for a forecast system to be considered skilful.
• ROC Area (Above-Normal) – The forecast system’s ability to discriminate wet or hot seasons
from the rest of the seasons over a 32-year test period. ROC values should be higher than 0.5
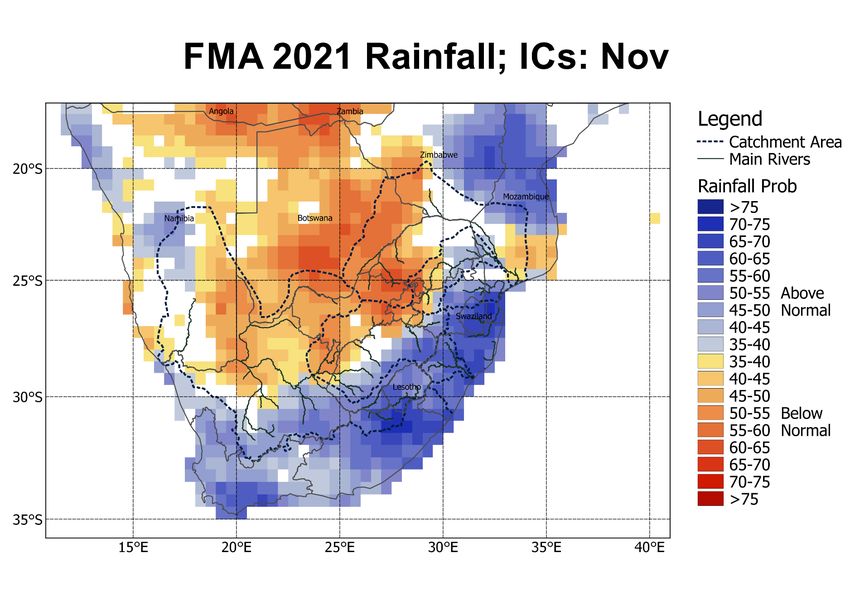
for a forecast system to be considered skilful.Forecasts are probabilistic Probabilistic forecasts can help users understand risks and opportunities (forewarned is forearmed) in order to make more informed decisions. The seasonal rainfall and maximum temperature forecast to follow are probabilities (% chance) of only the most likely outcome for below-, near-, or above-normal (B, N or A). The probabilities shown are always less than 100% - so there is no absolute certainty that the less favoured outcome will not occur. For example, if the forecast claims a 75% of below-normal rainfall totals for a season (i.e. drought), it means that 1 out of 4 times it will not develop into a drought. The nature of a probabilistic forecast implies that the less likely outcomes are always possible. In fact, for the probabilistic forecasts to be considered reliable, the less likely outcomes will and must occasionally occur. Note: Probabilistic forecasts are considered reliable when the forecast probability is an accurate estimation of the relative frequency of the predicted outcome. In other words, forecasts are reliable if the observation falls within the category (B, N or A) as frequently as the forecast implies
FMA Rainfall

FMA Rainfall
Round-up: SADC Rainfall
• Favourable rainfall outcomes are expected over
  the larger part of the forecast region during
  spring and summer, except over some of the
  northern parts
Observed SADC Rainfall

      Maps prepared by Dr. Christien Engelbrecht
FMA Max Temp
Round-up: SADC Max Temp
• Cooler maximum temperatures are likely in
  association with the increased likelihood of a
  wet summer season over parts of the region
Tailored
                                       Forecasts
1. Bapsfontein end-of-season-yield three-category probabilistic forecast for 2021
2. Probabilistic three-category rainfall forecast for the farm of Robbie Kingsley for Dec-Jan-Feb 2020/21
3. Probabilistic rainfall forecast for Jan-Feb-Mar 2021 for the farm Buschbrunnen near Grootfontein,
   Namibia
4. Probabilistic three-category malaria forecast for Limpopo for Dec-Jan-Feb 2020/21
5. Probability of exceedance Dec-Jan-Feb 2020/21 inflow forecast for Lake Kariba, Zambia/Zimbabwe
6. Probability of exceedance Jan-Feb-Mar, Feb-Mar-Apr and Mar-Apr-May 2021 downstream flow
   forecasts for Vaal Dam
Crop-yield data and forecasts for a farm near Bapsfontein, South Africa
Landman et al. (2019)
Re-forecasts for end-of-season crop yieldsDec-Jan-Feb 2020/21 rainfall forecast for farm in the Smithfield district (see map). Rainfall data provided by the farmer, Mr. Robbie Kingsley Landman et al. (2020a)
JFM rainfall forecast for the farm Buschbrunnen near Grootfontein, Namibia
                              Landman et al. (2016)
Malaria forecast
Landman et al. (2020b)
Hindcasts
Retrospective REAL-TIMEInflow forecast for Lake Kariba: onset season of DJF
Muchuru et al. (2016)Current Project, administered by the WRC: RainSolutions
Vaal Dam Downstream Flow Predictions• Barnston, A.G. and Tippett, M.K., 2017: Do statistical pattern corrections improve seasonal climate predictions in the North
American Multimodel Ensemble models? Journal of Climate, 30: 8335-8355. doi: 10.1175/JCLI-D-17-0054.1
• Harris, I., Jones, P. D., Osborn, T. J., and Lister, D. H., 2014: Updated high-resolution grids of monthly climatic observations - the
CRU TS3.10 Dataset. International Journal of Climatology, 34: 623-642. doi: 10.1002/joc.3711
• Kirtman, B. P. and Co-authors 2014: The North American Multimodel Ensemble: Phase-1 seasonal-to-interannual prediction;
Phase-2 toward developing intraseasonal prediction. Bulletin of the American Meteorological Society. 95, 585–601. doi:
http://dx.doi.org/10.1175/BAMS-D-12-00050.1
• Landman, W.A., and Beraki, A., 2012: Multi-model forecast skill for midsummer rainfall over southern Africa. International
Journal of Climatology, 32: 303-314. doi: 10.1002/joc.2273.
• Landman, W.A., Archer, E. and Tadross, M., 2016: Decision-relevant information on seasonal time scales – the case of a farm in
References
northern Namibia. Conference Proceedings of the 32nd Annual Conference of the South African Society for Atmospheric
Science, Cape Town, 31 October to 1 November 2016, pp 69-72. ISBN 978-0-620-72974-1.
• Landman, W.A., Archer, E. and Tadross, M. (2019): How costly are poor seasonal forecasts? Peer reviewed abstracts, 35th
Annual conference of the South African Society for Atmospheric Science, Vanderbijlpark, 8 to 9 October 2019, pp 60-63. ISBN
978-0-6398442-0-6.
• Landman, W.A., Archer, E.R.M and Tadross, M.A (2020a). Citizen science for the prediction of climate extremes in South Africa
and Namibia. Frontiers in Climate, 2:5, doi: 10.3389/fclim.2020.00005
• Landman, W.A., DeWitt, D., and Lee, D.-E., 2011: The high-resolution global SST forecast set of the CSIR. Conference
Proceedings of the 27th Annual Conference of South African Society for Atmospheric Sciences, 22-23 September 2011,
Hartbeespoort, North-West Province, South Africa. ISBN 978-0-620-50849-0
• Landman, W.A., Sweijd, N., Masedi, N. Minakawa, N. (2020b). The development and prudent application of climate-based
forecasts of seasonal malaria in the Limpopo province in South Africa. Environmental Development, 35, 100522, doi:
10.1016/j.envdev.2020.100522.
• Landman, W.A., DeWitt, D. Lee, D.-E., Beraki, A. and Lötter, D., 2012: Seasonal rainfall prediction skill over South Africa: 1- vs. 2-
tiered forecasting systems. Weather and Forecasting, 27: 489-501. DOI: 10.1175/WAF-D-11-00078.1
• Muchuru, S., Landman, W.A. and DeWitt, D., 2016: Prediction of inflows into Lake Kariba using a combination of physical and
empirical models. International Journal of Climatology, 36: 2570–2581, DOI: 10.1002/joc.4513.
• Troccoli, A., Harrison, M., Anderson, D.L.T. and Mason, S.J., 2008: Seasonal Climate: Forecasting and Managing Risk. NATO
Science Series on Earth and Environmental Sciences, Vol. 82, Springer, 467 pp.Financial support from… • The National Research Foundation through the Incentive Funding for Rated Researchers • ACCESS (Alliance for Collaboration on Climate and Earth System Science) through the project “Investigating predictability of seasonal anomalies for societal benefit” • Water Research Commission through administering the international project “Research-based Assessment of Integrated approaches to Nature-based SOLUTIONS (RainSolutions)”
Student participation in forecast system development

             Stephanie Hinze, BSc (Honours)(Meteorology):
             Statistical downscaling using large and high-resolution data sets, forecast displays for
             SADC rainfall and maximum temperatures, forecast verification

             Surprise Mhlongo, BSc (Honours)(Meteorology):
             Improving on SST forecast system through pattern correction, correlation vs
             covariance approaches, forecast output combination (multi-model approaches),
             mean and bias correction, and correct for skill
Shepherd Muchuru, PhD (Meteorology): Statistical modelling to relate large-scale features to seasonal inflows into Lake Kariba in southern Africa. Two predictions systems: 1) using antecedent seasonal rainfall totals over the upper Zambezi catchment as predictor in a baseline model, and 2) using predicted low- level atmospheric circulation of a coupled ocean–atmosphere general circulation model as predictor. Pearl Gosiame, BSc (Honours)(Meteorology): Development of hydro-climate predictions models for dam levels and downstream flows of the Vaal Dam. Predictors considered include historical rainfall over the catchment, SST and output from global climate models.
You can also read