Planning of City Transportation Infrastructure Based on Macro Simulation Model
←
→
Page content transcription
If your browser does not render page correctly, please read the page content below
View metadata, citation and similar papers at core.ac.uk                                                                                            brought to you by   CORE
                                                                                    provided by International Journal on Advanced Science, Engineering and Information Technology

                                                                                                                                         Vol.7 (2017) No. 4
                                                                                                                                          ISSN: 2088-5334

                Planning of City Transportation Infrastructure Based on Macro
                                      Simulation Model
                                   Joni Arliansyah#, Muhammad Rizky Prasetyo#, Astri Yuli Kurnia#
                                                  #
                                                    Department of Civil Engineering, University of Sriwijaya,
                                   Jl. Raya Palembang-Prabumulih KM 36, Inderalaya South Sumatera, 30602, Indonesia
                                E-mail: joniarliansyah@yahoo.com, rizkyprasetyo9a@gmail.com, aztri_zainuddin@yahoo.com

        Abstract—Palembang City having an area of 358.55 km2 with a total population of approximately 1.8 million people is one of the main
        cities in Indonesia. A city transport modelling is important in a city transportation planning particularly to overcome the existing
        transportation problem such as traffic congestion. In this study, Palembang City transportation model was developed using the PTV
        Visum Program whose transportation modelling was based on the four-step model of transportation. The result of the study shows
        that the developed model has an excellent reliability in representing the transportation conditions in Palembang and it also indicates
        that Palembang required bridges connecting between Ulu and Ilir areas of Palembang to overcome traffic congestion in Palembang
        City. Ideally, in 2022 Palembang will have had 4 connecting bridges and 5 bridges in 2027. The construction of an additional bridge
        helps to reduce the traffic load on the existing bridge (Ampera), which was built in 1965 and helps spread the traffic load in the city of
        Palembang

        Keywords—transport modelling; visum; trip assignment; infrastructure

                                                                                 that in the long term it will interfere with the overall
                               I. INTRODUCTION                                   economy.
           Planning and constructing transportation facilities and                  Transport modelling was used to predict the condition of
        infrastructures quite influence the increase of economic                 the road network in the study region, both with and without
        growth in supporting the achievement of the development                  the development of the network of roads and bridges.
        target of a country that will have a real impact on the                  Indicators-the traffic predicted from the road transport
        constructive change in the community in all aspects of life.             models such as traffic flow segment, road speed, and the
        In addition, environmental situation and condition go                    travel time, are usually used to perform a feasibility study of
        through a fundamental change to a better and a more                      the development plan to be undertaken.
        progressed improvement that the community standard of                       As a metropolitan city as well as the capital of South
        living gets increased.                                                   Sumatra Province, Palembang becomes the centre of
           The fact shows that in big cities in Indonesia the needs of           government, trade, industry, and settlement in South
        transport mobility for people and goods both in the present              Sumatra. Good planning of transportation system should
        and future conditions is not matched yet by the provision of             have been implemented in order to be able to solve
        planned and sufficient transport facilities and infrastructures          transportation problems commonly occurred in big cities,
        that the social and economic activities are still hampered by            one of which is traffic congestion.
        transport problems such as disorder, ineffectiveness, and                   In this study, the transport modelling of Palembang City
        inconveniences of public transportation, traffic jam at roads            used macro-simulation of PTV Visum 15.00 to find out the
        and intersections, etc.                                                  pattern of movement, search for alternative solutions in
           Structuring the network of roads and bridges is an                    order to be able to decipher this congestion and control the
        important public issue to be concerned with, given in                    distribution of the movement of every trip occurring in
        Palembang City congestion has become prevalent, even it                  Palembang City.
        spreads to almost all roads and occurs not only at peak hours               The PTV Visum Program applied four-step transportation
        only. Traffic jams enormously affect the lives of citizens               modelling. The resulting model reliability was conducted by
        resulting in a reduced performance of the city's economy,                comparing the traffic volume resulted from the modelling
        waste of time and energy as well as increased air pollution              and the one from the field survey. The analysis focused on

                                                                          1262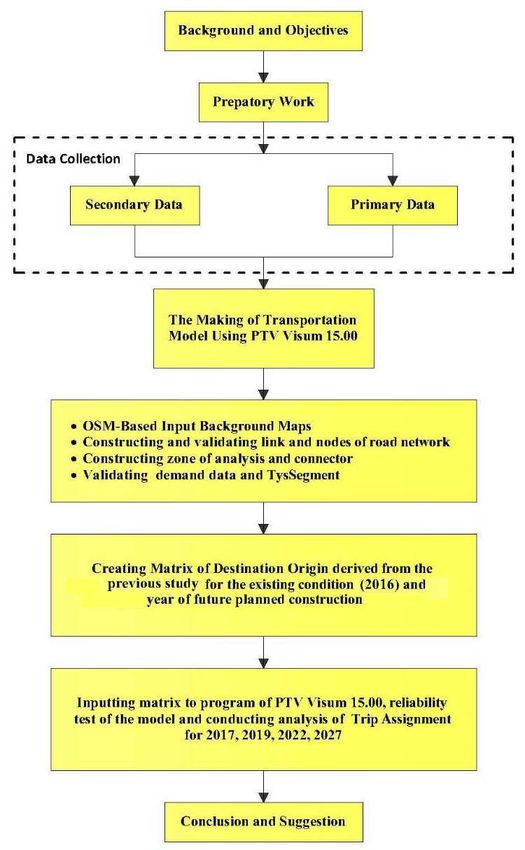
the adequacy of bridge construction plans in Palembang City
as outlined in the general plan of spatial Palembang City.
The city is divided into two parts by Musi River, that is the
Ulu and Ilir areas which are connected by the Ampera
Bridge.

                 II. MATERIAL AND METHOD
A. Macro-Simulation Program Used
   Transportation model of Palembang City was developed
using a program of macro-simulation of PTV Visum
15.00.Visum is software for simulation macroscopic traffic
flow and developed by PTV (Planning Transport Verkehr
AG) in Karlsruhe, Germany. It can analyse the macro traffic
simulation modelling with various methods of analysis.
   In this study, the model was developed using four steps of
transportation [1], [2], [3], [4]. Briefly, the making of traffic
model using the program of PTV Visum 15.00 [5], [6], [7] is
as follows:
    1) Establishing road networking of Palembang City in
the PTV Visum 15.00.
    • Creating a base map of the road network.
    • Validating the base map in accordance with the road
       network in the existing condition.
    • Creating an additional road network in accordance
       with the existing condition.
    • Checking directions, rows, lanes, and transportation
       system of each road network in accordance with the
       existing condition.
    • Creating link paths to ensure that the road network has
       been linked and it is ready to run the program.                                     Fig. 1 Integrated 4-step model in visum
   2) Creating an analysis zone of road networking of
Palembang City made previously.                                              2) Independent parameters including the geometric
   • Determining the boundary of analysis zone in                          width of the road, maps, background, matrix input, and
     accordance with the administration map of Palembang                   demand data.
     City.                                                                   After inputting the above parameters, the modelling
   • Dividing analysis zone to determine centroid zone for                 output obtained are as follows:
     each analysis zone.                                                      • Desire line trip of each zone.
   • Creating linking connectors from centroid zone to                        • Visual trip route load of each Link.
     nodes or entering lanes into the nearest road network                    • Results of load analyses in the form of tables.
     with analysis zone.
    3) Determining the analysis setting beginning from                        The methodological procedure of the study is described as
demand data, the setting of time analysis, demand segment,                 follows:
and procedural sequence in the program of PTV Visum                            1) Secondary data collection covers collecting of matrix
15.00.                                                                     data of destination origins of the previous study [12], [13],
                                                                           whose data needed to the concerned institutions as follows:
    The steps of model development are shown in Fig. 1.
                                                                               • The population of study zone.
Several successful studies using Visum Program in
                                                                               • Mode division, transport cost, and fare.
transportation macro analysis were published [8], [9], [10],
                                                                               • Data of groups, organizations, and transportation
[11].
                                                                                 operators in Palembang City.
B. Methodology                                                                 • General city spatial plan.
   Workflow in transportation modelling of Palembang City                      • Development of facilities and infrastructures to be
is shown in Fig. 2.                                                              executed.
   In analysing the transportation modelling, there are some                   • A network map of city roads and rivers, status, and
parameters that can be used. The making of the modelling                         function of the road, river transport, land use,
and the needed data input are as follows:                                        topography, sub-districts.
   1) Fixed parameter including a link, zone, connector,                       • Social    demography, economy, industrial and
PrT path, and nodes.                                                             agricultural regions, work sites, and a parameter of
                                                                                 regional revenue.

                                                                    1263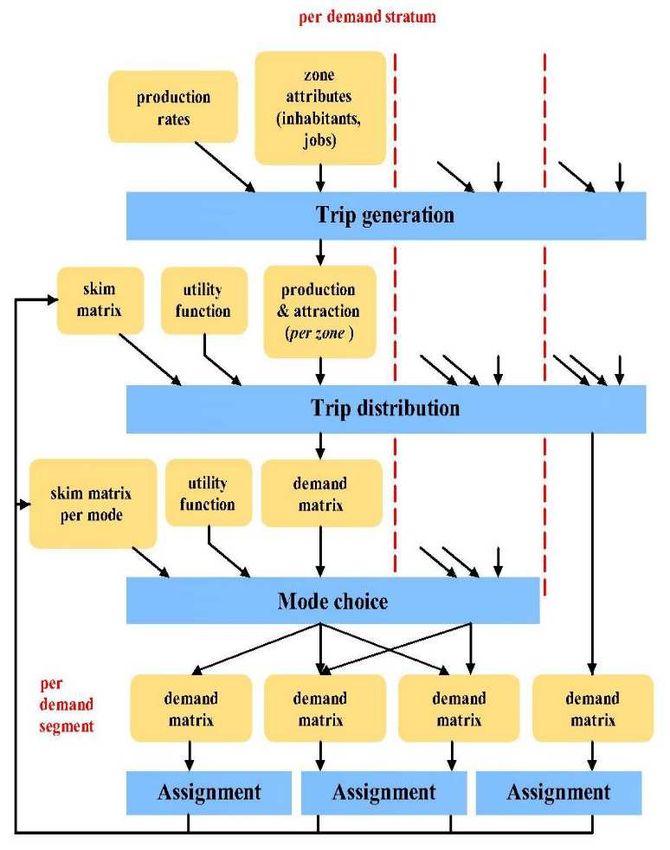
Fig. 3 Zones in the study area
Fig. 2 Research methodology
Fig. 4 Road network in the study area
• Data of traffics, river transport routes, public transport
routes, buses, trucks, traffic directions, ownership of Analysis of the trip route loading is the last phase of
vehicles, public transport facilities, facilities of identifying how much loading is accommodated for each
parking lots and traffic, traffic accident data. existing trip route. The traffic loading is the last phase of the
• Inventory data of roads, ports and their facilities, four transportation plans which become the selected routes
terminals, harbours, airports, train stations. in conducting a trip from one zone to another zone. The
• Data of previous studies selected route is the one which travelling time is the fastest
2) Primary data collection covers collection of traffic or the cheapest one.
data of city main road segments and survey of identification Trip assignment model used a loading model of
of road segments as parts of modeling road network. equilibrium assignment, taking into account of route
3) The matrix of the origin of destination obtained from capacity in which the traffic volume in the network will
the previous study [12], [13] was used to predict the OD affect the travelling cost of each route and all travelers are
interactively aware of the cheapest route so that they will
matrix of 2016 and other matrices for the analysis. Figure
distribute themselves to each route until all routes have
zones and road network in the study area are shown in Fig. 3
travelling costs.
and Fig 4. It shows that the city of Palembang is split into
5) The model reliability was conducted by comparing
two parts by the Musi River.
the results of a survey on road segments and the results of
4) Analysis of movement distribution of matrix OD used modelling using Visum Program.
Detroit method and trip assignment model used the trip
6) The developed model was used to analyze the
assignment of User Equilibrium.
conditions and needs of road and bridge development in
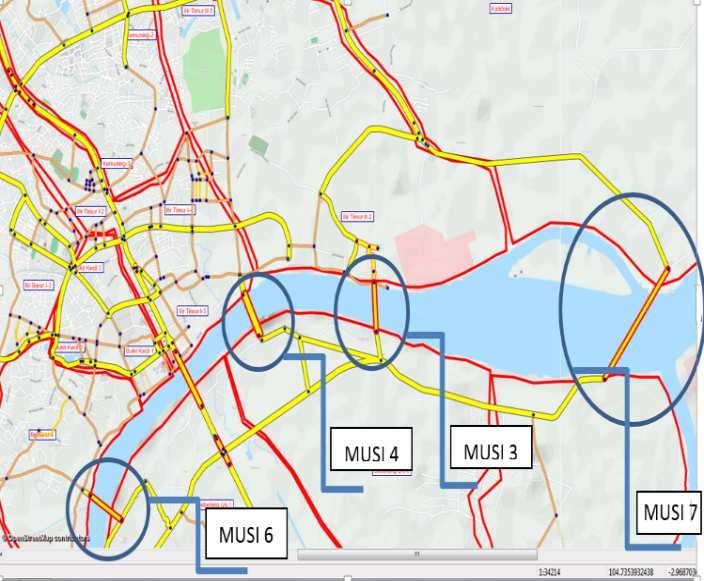
Palembang City. The bridge needs analysis refers to
Palembang spatial planning shown in Table 1 and Fig. 5.
1264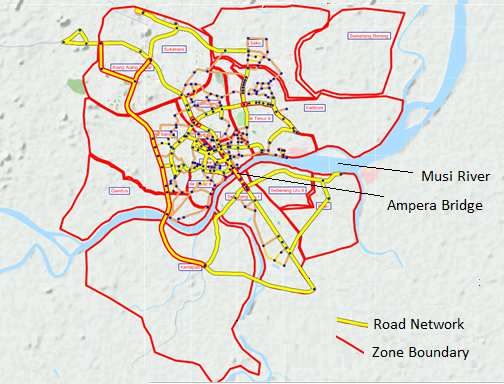
TABLE I
                     SCENARIO OF NETWORK DEVELOPMENT

                                                             Operational
 No                          Scenario
                                                              Year *)
      1     Plan of Construction of Musi 4 Bridge               2017
      2     Plan of Construction of Musi 6 Bridge               2019
      3     Plan of Construction of Musi 3 Bridge               2022
      4     Plan of Construction of Musi 7 Bridge               2027
 *)
      The Operational Year is estimated according to the result of an interview
      with the concerned institution.

                     III. RESULTS AND DISCUSSION
A. Traffic Conditions of Palembang City in 2016
   The volume and service condition of the main road
segments of Palembang City being surveyed is given in
Table 2 and Fig. 6. It can be seen that:
    • There are two road segments during rush hour having
                                                                                                 Fig. 5 Bridge development plan in Palembang City
       exceeding road capacity.
     • There are five segments which are already near the
       capacity during rush hour.

                                                                       TABLE II
                                                  TRAFFIC VOLUME RESULTED FROM SURVEY AND MODELLING

                                        The Owner of                         Survey Result                             Result of Trip Assignment
 No            Name of Street                                Capacity                               V/CRatio
                                            Road                              (smp/hour)                                 Analysis (smp/hour)
      1            POM IX                   City                4007             3367                0.840                        3245
      2         Angkatan 45                Province             4356                2328             0.534                          1929
               Kapten A. Rivai
      3                                    Province             3630                2636             0.726                          2832
                   (East)
               Kapten A. Rivai
      4                                    Province             4356                2858             0.656                          2725
                   (West)
      5            Radial                     City              4007                2879             0.718                          2648
      6          R. Sukamto                 National            4356                4826             1.108                          4243
      7         Abdul Rozak                 National            4704                2766             0.588                          2736
      8        Mangkunegara                Province             6703                7803             1.164                          7182
      9       AKBP Cek Agus                 National            3240                2638             0.814                          4803
  10            Kol H Burlian               National            4950                4199             0.848                          4653
  11           Soekarno Hatta               National            5346                2149             0.402                          2819
               Kol H Burlian
  12                                        National            4554                3129             0.687                          3576
                  (km12)

                                                                       TABLE III
                                                CONDITION OF BRIDGE SERVICE LEVEL IN PALEMBANG UP TO 2027

                                                2016                    2017                     2019                2022                  2027
             Bridge        Capacity
  No                                        Volume   V/C            Volume   V/C             Volume   V/C        Volume   V/C          Volume   V/C
             Name
                          (smp/hour)      (smp/hour)              (smp/hour)               (smp/hour)          (smp/hour)            (smp/hour)
            Ampera
      1                      5742           11237        1.96        6269          1.11      5450      0.95       4401       0.77          4201     0.73
            (Existing)
      2     Musi 4           5742                                    5267          0.92      2982      0.52       3412       0.59          3287     0.57
      3     Musi 6           5742                                                            7175      1.25       6632       1.15          3648     0.64
      4     Musi 3           5742                                                                                 3480       0.61          2527     0.44
      5     Musi 7           5742                                                                                                          4623     0.81

                                                                                  1265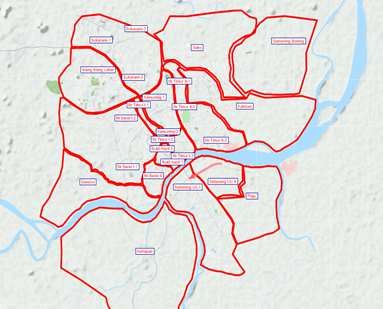
results of needs adequacy of bridge constructions in
                                                                                Palembang is as follows:
                                                                                   • In the existing year of 2016, the Ampera Bridge as the
                                                                                      only bridge connecting the Ulu and Ilir areas of
                                                                                      Palembang cannot serve the existing traffic movement
                                                                                      anymore. It also causes traffic congestion on road
                                                                                      network in Palembang City particularly on the main
                                                                                      roads directly connected to or affected by the
                                                                                      performance of the Ampera Bridge.
                                                                                   • Even though there will be an additional construction
                                                                                      of Musi 4 Bridge in 2017, the existing two bridges
                                                                                      still serve the traffic in saturated conditions. Yet,
                                                                                      given the short time of constructing of the Musi 4
                                                                                      Bridge which has not started yet until now, it is
                                                                                      estimated that the bridge construction in 2017 will be
                                                                                      difficult to complete.
                   Fig. 6 V/C ratio of existing road                               • In 2019 even though there are two additional
                                                                                      constructed bridges, two of the three existing bridges
   The above matters indicate that during rush hours most                             at rush hours are at saturation. It indicates that the
main road segments in Palembang City have a poor service                              constructions of the 2 bridges need to be conducted
level.                                                                                until 2019. Late constructions will result in severe
B. Model Reliability                                                                  congestion in Palembang City.
                                                                                   • In 2022 the addition of three new bridges is quite
   The model reliability test was carried out by comparing                            ideal for servicing the traffic between Ulu and Ilir
the traffic volumes of 12 main road segments of Palembang                             areas of Palembang City though one bridge still has
City with the result of modelling in 2016 shown in Table 3                            saturated conditions during rush hours.
and Fig. 7. The resulting model can well represent the                             • In 2027 it will have had at least 5 connecting bridges
traffic conditions of Palembang City with the R2 value of                             to well serve the traffic movement from Ulu to Ilir
0.836.After conducting a reliability test of the model, it                            areas and vice versa. It shows that in the next 10 years
was proceeded to analyse the traffic conditions of                                    the additional constructions of 5 bridges have to be
Palembang City using the developed model, in this case,                               realized to prevent Palembang City from the
the analysis of the adequacy of the number of bridges                                 congestion problem.
crossing the Musi River.
                                                                                D. Analysis of Traffic Loading of the Existing Bridge
                                                                                    (Ampera)
                                                                                   Currently, in 2016, Ampera Bridge constructed in 1965
                                                                                is still the only bridge connecting Ulu and Ilir areas of
                                                                                Palembang City. Shown in Table 3, at rush hour traffic
                                                                                loading exceeds the existing bridge capacity. The needs of
                                                                                the additional bridge are accordance with the existing plan
                                                                                has to be able to realize to reduce the load of Ampera
                                                                                Bridge and spread the traffic movement of Palembang City.
                                                                                Fig.8 shows that the construction of additional bridges
                                                                                between Ulu and Ilir areas helps spread the movement from
                                                                                the Ampera Bridge to the new bridges as well as the traffic
                                                                                movement in Palembang City. The traffic spread from the
                                                                                Ampera Bridge both increases the level of bridge service
                                                                                and decreases loads on the Ampera Bridge structure.
Fig. 7 Correlation analysis between the existing traffic and modelling             Fig 9. and Table 4 show the decrease of traffic loading
result                                                                          on Ampera Bridge if the plan of bridge construction is
                                                                                realized. Fig 8 shows that in 2017 if there is an additional
C. Analysis of Bridge Construction Adequacy                                     bridge, Musi 4, the traffic load decreases to 55.6%, and
   In accordance with the spatial plan of Palembang City                        with the addition of 3 or 4 bridges in 2022 and 2027, the
[14] until 2027, Palembang City will construct four                             traffic load on Ampera bridge will become 39.1% and
additional bridges, namely Musi 4 Bridge, Musi 6 Bridge,                        37.3%. Table IV shows the movement percentage on the
Musi 3 Bridge, and Musi 7 Bridge. The analysis was                              Ampera Bridge against the total movement existing in
carried out to see if the plan of bridge constructions met the                  Palembang City. The percentage decreases to be 2.23% in
movement needs in Palembang City. Table 3 shows the                             2016 and 1.01% in 2027.
results of Visum program for bridge service rate in
Palembang in 2017, 2019, 2022, and 2027. The analysis

                                                                         1266
TABLE IIIV                                                                          IV. CONCLUSION
 MOVEMENTPERCENTAGE ON THE AMPERA BRIDGE AGAINST THE TOTAL
               MOVEMENT IN PALEMBANG CITY                                          Based on the analysis, the conclusions are as follows:
                                      Movement Percentage on                    The development of transportation model of Palembang
 No              Year                                                           City using Visum Program can well represent the
                                        the Ampera Bridge
  1              2016                         2.23                              transportation conditions of Palembang City. In the
  2              2017                         1.46                              existing condition (2016), the existing Ampera Bridge has
  3              2019                         1.23
                                                                                not been able any more to serve the traffic movement
                                                                                between Ulu and Ilir areas of Palembang City. To serve the
  4              2022                         1.19
                                                                                traffic between Ulu and Ilir areas of Palembang City,
  5              2027                         1.01
                                                                                ideally, Palembang City will have had 4 bridges in 2022
                                                                                and 5 bridges in 2027. The construction of additional
                                                                                bridges in Palembang City could greatly diminish the load
                                                                                of Ampera Bridge that has been used since 1965 and helps
                                                                                spread the traffic in Palembang City.

                                                                                                             REFERENCES
                                                                                [1]    O. Z. Tamin, Planning, Modeling and Transport Engineering,
                                                                                       Bandung ITB Publisher, 2008.
                                                                                [2]    J.W. Dickey, Metropolitan Transportation Planning, 2nd ed.,Taylor
                                                                                       & Francis Publisher, 1983.
                                                                                [3]    M.D. Meyer and E.J. Miller, Urban Transportation Planning, 2nd ed.,
                                                                                       Mc Graw Hill, 2000.
                                                                                [4]    W. R. Black, Transportation – A Geographical Analysis, 1st ed.,The
                                                                                       Guilford Press, 2003.
                                                                                [5]    PTV AG, PTV Visum Manual, Karlsruhe, Germany, 2015
                                                                                [6]    PTV, Visum State of The Art Travel Demand Modeling, [Online].
                                                                                       Available: http://data.ptvamerica.com/docs /Visum.pdf
                                                                                [7]    PTV Groub, PTV Visum Tips & Tricks, [Online]. Available:
                                                                                       http://vision-traffic.ptvgroup.com/en-us/training-support/ support/
                                                                                       ptv-visum/tips-tricks/
                    Fig. 8 Service level of bridges                             [8]    I. Yatskiv and M. Savrasov, Development of Riga-Minsk Transport
                                                                                       Corridor Simulation Model, Journal of Transport and
                                                                                       Telecommunication, 1 (2010) 38-47.
                                                                                [9]    S. Fierek and J. Zak, Planning of Integrated Urban Transportation
                                                                                       System Based on Macro – Simulation and MCDM/A Methods,
                                                                                       Procedia – Social and Behaviour Sciences 54 (2012) 567-579.
                                                                                [10]   M. Kontelj and I. Jakomin, Transport Modelling of Freight Flows in
                                                                                       Accordance with Investments: Case Study of Slovenian Railways,
                                                                                       Promet-Traffic & Transportation, 26-5 (2014) 429-436.
                                                                                [11]   E. Mitsakis, G. Aifadopoulou, J. M. S. Grau, E. Chrysohoou and M.
                                                                                       Morfoulaki, Combination of Macroscopic and Microscopic
                                                                                       Transport Simulation Models: Use Case In Cyprus, International
                                                                                       Journal for Traffic and Transport Engineering, 4-2 (2014) 220-233.
                                                                                [12]   J. Arliansyah, E. Nursalam, M. Yusuf, and M. Agustine, Study
                                                                                       Development of Transportation Infrastructures in Palembang In
                                                                                       Order To Achieve Optimal Urban Transportation Services (First
                                                                                       year), Final Report of National Strategic Research, 2009.
                                                                                [13]   J. Arliansyah, E. Nursalam, M. Yusuf, and M. Agustine, Study
                                                                                       Development of Transportation Infrastructures in Palembang In
                                                                                       Order To Achieve Optimal Urban Transportation Services (Second
                                                                                       year), Final Report of National Strategic Research, 2010.
                                                                                [14]   Bappeda Palembang, Palembang Spatial Planning, 2010.

Fig. 9 The Decrease of traffic loading on Ampera Bridge if the plan of
bridge construction is realized

                                                                         1267
You can also read