PLASTIC WASTE MANAGEMENT AND BURDEN IN INDONESIA - COUNTRY SITUATION REPORT
←
→
Page content transcription
If your browser does not render page correctly, please read the page content below
PLASTIC WASTE MANAGEMENT AND
BURDEN IN INDONESIA
COUNTRY SITUATION REPORT

February 2022

Plastic Waste Management and Burden in Indonesia
February 2022

Authors
Yuyun Ismawati1,2, Mochamad Adi Septiono1, Nindhita Proboretno1,
Karlsson, Therese2, Buonsante, Vito2
1 Nexus3, Denpasar, Bali, Indonesia; 2 International Pollutants Elimination Network (IPEN),
Sweden ; 3 Arnika – Toxics and Waste Programme, Prague, Czech Republic; 4 Eco-Accord, Russia

                                  IPEN is a network of non-governmental
                                  organizations working in more than 100 countries
                                  to reduce and eliminate the harm to human health
                                  and the environment from toxic chemicals.
                                  www.ipen.org

For more information contact:

nexus3@nexus3foundation.org

www.nexus3foundation.org

Acknowledgment

This report is part of the plastic collaboration project “Advancing a Non-Toxic
Circular Economy: Reducing non-circular plastics and advancing circular plastic
collection in Indonesia” conducted by Nexus3 Foundation with financial support
from the Swedish EPA. The authors would like to thank Nexus3 team, Ecoton
team, Alliance for Zero Waste Indonesia members, IPEN, and BFFP Plastic Trade
team for their valuable inputs and comments.

© 2022. International Pollutants Elimination Network (IPEN).
All rights reserved.

IPEN Production Team: Bjorn Beeler, Tim Warner, Betty Wahlund

Cite this publication as:
 Ismawati, Y., Septiono, M.A., Proboretno, N. Plastic Waste Management and
 Burden in Indonesia. International Pollutants Elimination Network (IPEN),
 February 2022.

ii
CONTENTS
1. Policy and regulations related to waste management in Indonesia.. 5
   1.1 The umbrella policy...................................................................................5
   1.2 Waste management policy and regulations...........................................7
   1.3 Single-use plastic bans.............................................................................8
2. Petrochemicals industry in Indonesia............................................11
  2.1 Upstream petrochemicals industry...................................................... 13
  2.2 Middlestream petrochemicals industry............................................... 16
  2.3 Downstream petrochemicals industry................................................. 19
3. Plastics industry in Indonesia.......................................................26
  3.1 Distribution and scale of the plastic manufacturers ........................ 26
  3.2 Tax holidays, tax allowance, and plastic tax........................................27
      3.2.1 Tax holidays...................................................................................27
      3.2.2 Tax allowance............................................................................... 28
      3.2.3 Value Added Tax for plastic products....................................... 29
  3.3 Plastic consumption, recyclability, and circularity............................ 32
      3.3.1 Plastic consumption.................................................................... 32
      3.3.2 Plastic waste recycling and for fuel substitutions ................. 32
      3.3.3 PET recycling ..............................................................................35
  3.3.4 Antimony and other chemicals migration in rPET....................... 39
      3.3.5 Microplastics in PET water bottles........................................... 43
  3.4 Plastic waste: leakages and recycling...................................................45
  3.5 Bank Sampah/Garbage Banks............................................................. 48
4. Plastic waste imports and exports.................................................52
  4.1 Plastic waste imports..............................................................................52
  4.2 Plastic waste exports..............................................................................54
5. Public and environmental burden................................................. 57
6. Transitioning towards the circular economy.................................64
7. Recommendations........................................................................69
Bibliography..................................................................................... 72

This document is prepared by the authors based on its own best knowledge, literature studies, interviews,
and field works. The authors do not make any warranty or representation, either expressed or implied,
with respect to completeness of the information contained in this presentation; nor does the author assume
any liability of any kind whatsoever resulting from the use of or reliance upon any information, proce-
dure, conclusion, or opinion contained in this presentation. Any subjective information contained therein
should be perceived as expressing the views of its authors rather than those of Nexus3 Foundation or IPEN.
The authors assume no responsibility for maintaining the data contained herein on a current basis or for
notification of changes, additions or terminations.

iii
4
1. POLICY AND REGULATIONS
   RELATED TO WASTE
   MANAGEMENT IN INDONESIA

1.1 THE UMBRELLA POLICY
On the 2nd of February 2021, the Indonesian Government enacted 49
implementing regulations to the Omnibus Law. This new law consists of
45 Government Regulations and four Presidential Regulations. The Om-
nibus Law amends 76 laws across a wide range of sectors and industries,
including the laws on energy and mining, plantations, telecommunica-
tions, healthcare, tourism, land and buildings and employment.

The Job Creation Act (Undang-Undang Cipta Kerja), officially Act Num-
ber 11 of 2020 on Job Creation1 (Undang-Undang Nomor 11 Tahun
2020 Tentang Cipta Kerja or UU 11/2020), is a bill that was passed on 5
October 2020 by Indonesia’s People’s Representative Council (DPR), with
the aim of creating jobs and raising foreign and domestic investment by
reducing regulatory requirements for business permits and land acquisi-
tion processes.

The Omnibus Law was first introduced during President Widodo’s speech
after being appointed the President of the Republic of Indonesia for a
second term in October 2019. It represents the first time in the country’s
legal history that such extensive amendments are made to various laws
through a single legal instrument.

The Omnibus Law has received a positive response from investors. It
purports to open more doors to foreign investment and introduce employ-
ment provisions regarded as more favourable to business owners. Being
almost 1,028 pages long, the Omnibus Law left a range of crucial matters

1   Law Number 11 year 2020 on Job Creation https://peraturan.bpk.go.id/Home/Details/149750/uu-
    no-11-tahun-2020

                             Plastic Waste Management and Burden in Indonesia (February 2022)     5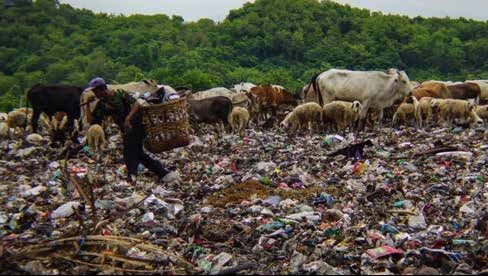
addressed by implementing regulations and protested by many groups all
over Indonesia.2,3,4,5

The Omnibus Law also leaves a gap on the calculation of severance pack-
age upon employment termination. As such, the recently issued suite of
implementing regulations have been much anticipated by the market.

The Omnibus law6 changes Indonesia’s environmental legal framework
with comprehensive provisions on environmental protection and manage-
ment. To implement those provisions, the Indonesian government has just
issued new Government Regulation No. 22 year 2021.7

One significant change brought about by Regulation 22 relates to environ-
mental licensing for businesses. The new law stipulated that businesses
must obtain an environmental license or Izin Lingkungan instead of
acquiring an Environmental Approval (Persetujuan Lingkungan).

An Environmental Approval will be valid for the term of the business
license. An Environmental Approval can be either:

•    a feasibility decree for business activities that significantly impact the
     environment; or
•    a statement of capability in environmental management for busi-
     nesses whose activities do not significantly impact the environment
     and who must have an environmental management and monitoring
     programme, in Indonesian, Upaya Pengelolaan Lingkungan Hidup
     dan Upaya Pemantauan Lingkungan Hidup.

Businesses that do not fall under the above categories do not need to
obtain Environmental Approval but must prepare their environmental
management statement and monitoring capability. The Business Identi-
fication Number (Nomor Induk Berusaha) of the business will integrate
this statement.

Whether a business must obtain Environmental Approval or prepare its
statement of capability will depend on various factors. Regulation 22 sets

2   https://www.bbc.co.uk/news/world-asia-54460090
3   https://www.asia-pacific-solidarity.net/index.php/news/2020-01-20/omnibus-law-clearly-and-
    explicitly-interests-of-oligarchy-lbh- jakarta.html
4   https://en.tempo.co/read/1306889/omnibus-is-throwing-people-and-democracy-under-the-bus
5   https://indonesiaatmelbourne.unimelb.edu.au/major-procedural-flaws-mar-the-omnibus-law/
6   Law Number 11 year 2020 amended the primary environmental regulation, Law Number 32 of
    2009 on Environmental Protection and Management. See https://peraturan.bpk.go.id/Home/De-
    tails/149750/uu-no-11-tahun-2020
7   Government Regulation Number 22 of 2021 on the Implementation of Environmental Protection and
    Management https:// peraturan.bpk.go.id/Home/Details/161852/pp-no-22-tahun-2021

6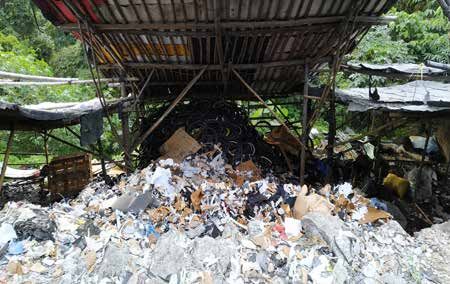
out the rules by which companies may judge whether they need approval
    and which type of approval they should apply for.

    The Omnibus Law and Regulation 22 also set out means by which the
    government will assist micro and small enterprises to make their environ-
    mental approval applications. Any environmental licenses and documents
    issued before Regulation 22 will remain valid.

    1.2 WASTE MANAGEMENT POLICY AND REGULATIONS
    The Ministry of Environment and Forestry stated that the local govern-
    ment had improved the quality of waste management through the prepa-
    ration of the Regional Waste Management Strategy Policy (Jakstrada),
    which is a mandate from Presidential Regulation No. 97 year 2017 on

                                                                                                                     Ministry of Environment and Forestry
                                                                                                                     Ministry of Public Works
                 UU No. 18 / 2008                                                                                    Ministry of Trade
                                           UU No. 11 / 2020
National Law     Law on Solid Waste
                                           Law on Job Creation                                                       Ministry of Industry
                 Management

                 PP No. 81/2012                      PP No. 22/2021                      DRAFT Government                   PP No. 27/2020
Government       Government Regulation on            Implementation of                   Regulation on Excise               Management of Specific
Regulation       Management of Household             Environmental Protection            on Plastic                         Wastes
                 and Household-like Waste            and Management

                 Perpres No. 97/2017          Perpres No. 83/2018         Perpres No. 18/2015          Perpres No. 15/2018        Perpres No. 35/2018
                 Presidential Regulation      Presidential Regulation     Presidential Regulation      Presidential Regulation    Presidential Regulation
                 on National Policy and       on Marine Debris            on Income Tax Facilities     on Acceleration of         on Acceleration of
Presidential     Management Strategy          Management                  for Investment in Certain    Damage and Pollution       Development of
Regulation       of Household Waste and                                   Business Fields and/or in    Control on Citarum River   Waste-to-Energy
                 Household-like Waste                                     Certain Regions              Basin                      Installation Using
                                                                                                                                  Environmentally-sound
                                                                                                                                  Technology

                 Keppres No. 61/1993 and No. 47/2005 Presidential Decree on Ratification of the
Presidential     Basel Convention on the Control of the Transboundary Movement of Hazardous
Decree           Waste and Their Disposal

                 Ministry of Trade Regulation No.       Ministry of Public Works Regulation   Ministry of Environment and         Ministry of Environment
                 83/2020 Third Amendment to the Min.    No. 3/2013 on Implementation of       Forestry Regulation No. P.75/2019   and Forestry Regulation
                 of Trade No. 84/2019 concerning        Solid Waste Infrastructure and        on Roadmap to Waste Reduction       No. 13/2012 concerning
                 Provisions for Importation of
                 Non-hazardous Waste as Industrial      Facilities                            by Producers                        Bank Sampah
Ministerial      Raw Material
Regulation
                 Ministry of Trade Regulation No.                Ministry of Trade Regulation No.               Ministry of Industry Regulation No.
                 48/2015 on General Provisions in                70/2015 on Importer                            48/2015 on Requirements for
                 the Import Sector                               Identification Number                          Income Tax Facilities Implementation

Regional/Local   Regional/Local Regulations on SUPs              - Perwali Denpasar 36/2018                     - Perwali Balikpapan 8/2018
Regulation       - PerGub Bali No. 97/2018                       - Perwali Bogor 61/2018                        - Perwali Padang 36/2018
                 - PerGub DKI Jakarta No. 142/2019               - Perwali Banjarmasin 18/2016                  - Perda Purwakarta 37/2016

    Figure 1. Summary of Indonesia’s national waste management regulations (as
    of July 2021). Source: KLHK-SWI (2019), Nexus3-ICEL-AZWI (2021)

                                               Plastic Waste Management and Burden in Indonesia (February 2022)                                        7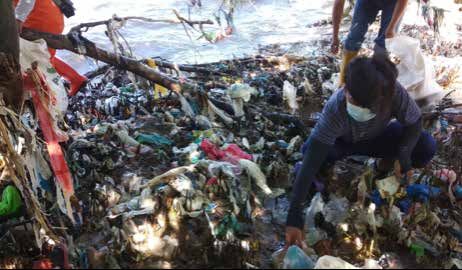
National Policy and Management Strategy on Household Waste and
Household-like Waste.8

This policy provides a direction towards balanced waste management
based on the amount of waste generated in 2025, phase-out and prohibi-
tion of several types of single-use plastics such as plastic shopping bags,
plastic straws, and styrofoam containers.

By the end of June 2021, two provinces and 58 regencies/cities have issued
regional policies related to waste reduction through the prohibition and
restriction of single-use plastics. Figure 1 provide summary of Indonesia’s
national waste management regulations (as of July 2021). Due to the
pandemic, several draft regulations are still in the pipeline and might be
released in 2022.

1.3 SINGLE-USE PLASTIC BANS
Since 2016 until now, several provinces and cities/regencies across Indo-
nesia have enacted single-used plastic bans regulation:

•     At regency and city levels: 54 regencies9,10,11,12
•     At provincial level: two provinces, Bali and DKI Jakarta13,14

Although, there was an increase in single-use plastic usage during the
COVID-19 pandemic, in general, the regulations are still enforced by the
government and retailers.

In 2019, when Bali Governor issued the new regulation to prohibit SUPs,
several plastic producers and retailers sued the Governor. After several
months of hearings, the Supreme Court verdict ruled out the judicial
review request submitted by the Association of Plastic Recyclers (ADUPI).

8    Perpres No. 97/2017 tentang Kebijakan dan Strategi Nasional Pengelolaan Sampah Rumah Tangga
     dan Sampah Sejenis Sampah Rumah Tangga https://peraturan.bpk.go.id/Home/Details/73225/
     perpres-no-97-tahun-2017
9    https://dietkantongplastik.info/download/
10   https://www.liputan6.com/bisnis/read/4454331/41-daerah-sudah-terapkan-larangan-penggunaan-
     kantong-plastik
11   ibid
12   http://lh.surabaya.go.id/fileupload/SURAT%20EDARAN%20WALIKOTA%20PELARANGAN%20
     KANTONG%20PLASTIK.pdf
13   Peraturan Gubernur DKI Jakarta No. 142 tahun 2019 tentang Kewajiban Penggunaan Kantong
     Belanja Ramah Lingkungan Pada Pusat Perbelanjaan, Toko Swalayan Dan Pasar Rakyat https://jdih.
     jakarta.go.id/uploads/default/produkhukum/ PERGUB_NO._142_TAHUN_2019.pdf
14   Peraturan Gubernur Bali Nomor 97 Tahun 2018 tentang Pembatasan Timbulan Sampah Plastik
     Sekali Pakai https:// dklh.baliprov.go.id/wp-content/uploads/2020/07/20.-PERGUB-97-TH-
     2018-compressed.pdf

8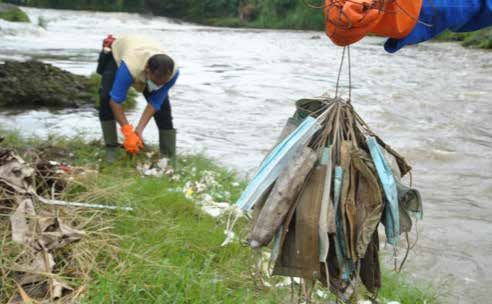
Figure 2. Provinces, cities and regencies with SUPs band regulations (as of
July 2021). Source: GIDKP, 2021

Bali Governor, Koster, told all local governments to follow his path and
not to be afraid to issue the plastic ban regulation.15

In collaboration with the government of Bali, the Alliance for Zero Waste
Indonesia and its members, DIGKP, Nexus3, and PPLH Bali, conducted a
participatory evaluation regarding the effectiveness of the Bali Governor
Decree No. 97/2018 early 2021.16

The evaluation results show a significant reduction in the use of single-use
plastic bags, straws and styrofoam as follow:

•     51-57% reduction of single-use plastic bags;
•     77-81% reduction of single-use styrofoam for food packaging; and
•     66-70% reduction of single-use plastic straw.

15 Bali wins plastic-ban battle in Court, steps closer to being plastic-free island. 15 July 2019. Jakarta
   Post, accessed by 7 May 2021.
   https://www.thejakartapost.com/news/2019/07/15/bali-wins-plastic-ban-battle-in-court-steps-
   closer-to-being-plastic-free-island.html
16 Aliansi Zero Waste Indonesia Instagram account, 5 July 2021. https://www.instagram.com/p/
   CQ73fmxgfC1/? utm_source=ig_web_copy_link

                                 Plastic Waste Management and Burden in Indonesia (February 2022)            9
Furthermore, 94% of respondents stated that they use reusable shopping
bags, and 86% said that they have no difficulties finding alternatives to
plastic bags.

Meanwhile, the evaluation in Jakarta concerning the effectiveness of Ja-
karta Governor Decree Number 142/2019 also shows significant reduction
of single-use plastics as follow:

•    82% reduction of single-use plastic bags;
•    42% reduction of single-use plastic bags at household level;
•    95% reduction of single-use plastic bags at shopping centers;
•    100% reduction of single-use plastic bags at supermarkets; and
•    50% reduction of single-use plastic bags at traditional markets.

However, in general, the regulations are still enforced by the government
and retailers. Although, there was an increase in single-use plastic usage
during the Covid-19 pandemic.

10
2. PETROCHEMICALS INDUSTRY IN
   INDONESIA
Law No. 3 year 2014. Article 8 paragraph 1 mandated the government of
Indonesia to develop a National Industrial Development Master Plan or
Rencana Induk Pembangunan Industri Nasional (RIPIN). RIPIN serves
as a guideline for the government and industry players in planning and
developing the industry so that the government and industry’s stakehold-
ers can achieve the strategy’s objectives.

The upstream industries that are listed under the top ten priority sectors
are the upstream Agro industry, base metals and non-metallic minerals
industry, as well as petroleum and gas-based basic chemical industry and
coal.

Three sectors in Indonesia’s real sector, namely agriculture, trade, and
industry, have been hardest hit by the corona pandemic. Data from the
Central Statistics Agency (BPS) shows that these three contribute the
most to Gross Domestic Product (GDP).

The agriculture sector’s contribution to GDP reached 12.84 per cent, trade
by 13.20 per cent, and industry 19.98 per cent. In total, the three sectors
have contributed 46.02 per cent to Indonesia’s GDP (Perindustrian, 2015).

Further, in terms of employment, these three sectors are also the highest
job providers, therefor the impact on the unemployment rate is also huge.
During the pandemic, the national unemployment rate increased from
6.88 million people (February 2020) to 10.58 million (July 2020).

The petrochemical industry is an industry that relies on oil and gas prod-
ucts as the primary raw material source, which includes olefin, aromatic,
normal paraffin, synthesis gas (H2 & CO gas), and organic compounds de-
rived from the primary raw materials (Matar & Hatch, 2001). Traditional
plastics production involves the transformation of petroleum or natural
gas into their constituent monomers. This process is highly energy-inten-
sive and accounted for 400 million tonnes of greenhouse gas emissions
(around 1% of the global total) in 2012 (OECD, 2018).

                       Plastic Waste Management and Burden in Indonesia (February 2022)   11
The fossil fuel feedstock used in plastics production accounts for 4% to
8% of global oil and gas production. This share could increase further
in the future if we don’t stop the production and consumption of Single-
Used Plastics and other unnecessary packaging (W. E. F. WEF, EMaF,
& McKinsey, 2016). The hydrocarbon molecules that are bound into the
structure of plastics are initially inert but release carbon dioxide and other
greenhouse gases when burned and or incinerated.
The availability of raw materials derived from oil and gas products is in-
creasingly limited and expensive, prompting the search for alternative raw
materials, namely ethane (ethane cracker), coal, methane-coal (coal bed
methane), waste refinery (green coke), and agricultural products (bio-
mass, starchy materials, vegetable oils, etc.).
Thus, the definition of the petrochemical industry becomes broader, not
only covering the chemical industry group that processes oil and gas raw
materials, but also those that process non-oil and gas raw materials and
produce products that are traditionally produced from processing oil and
gas products (Pales & Levi, 2018).
The Ministry of Industry recorded that the plastic recycling rate in 2019
was around 14%, while the Ministry of Environment and Forestry stated
that the overall plastic recycling rate was only 7%. Meanwhile, a represen-
tative of the Indonesia Olefin, Aromatic, and Plastic Industry Association
said that the low percentage of plastic recycling in the country is reflected
in the low utility of plastic recycling manufacturers capacity, which is
around 70%.
Indonesia’s petrochemical industry is categorized into three groups (Per-
industrian, 2014), namely:
1. Upstream (basic) petrochemical industry
The primary petrochemical industry is the most upstream group in
the petrochemical industry, processing raw materials in the form of
naphtha and condensate into olefins, aromatics, and paraffin.
Examples of products are:
• The olefin industry (ethylene, propylene, butadiene, etc.).
• Aromatic industry (benzene, toluene, xylene, etc.).
• C-1-based industry (ammonia, methanol).
2. Intermediate or middle-stream petrochemical industry
12The intermediate or middle-stream petrochemical industry is an
industry that processes olefins, aromatics (products of the upstream
petrochemical industry) into derivative products.
Examples of products are vinyl chloride, styrene, ethylene, glycol, etc.
3. Downstream petrochemical industry
The downstream petrochemical industry is an industry that processes
materials produced by the intermediate petrochemical industry into
various final products that are used by other sectors or end consum-
ers/users (industrial and consumer goods).
Examples of downstream petrochemical products are:
• Polyethylene (HDPE, LDPE, LLDPE);
• Polypropylene (PP); Polystyrene (PS);
• Polyvinylchloride (PVC);
• Polyethylene terephthalate (PET),
• synthetic rubber (ABS),
• synthetic fibre (polyester, nylon), etc.
The petrochemical industry also grouped based on the type of building
block raw materials that are processed namely:
a) Methane-based (C-1) petrochemical industry and its derivatives: am-
monia, methanol, urea, formaldehyde, acetic acid, etc.
b) Olefin petrochemical industry and its derivatives: ethylene, propylene,
bu
tene, butylene, ethylene glycol, polyethylene, etc.
c) Aromatic petrochemical industry and its derivatives: para-xylene,
ortho-xylene, toluene, benzene, ethyl benzene, purified terephthalic
acid (PTA), etc.
2.1 UPSTREAM PETROCHEMICALS INDUSTRY
The upstream petrochemical industry’s raw materials or feedstock comes
from petroleum sources (naphtha, condensate), natural gas, coal, and
biomass. These sources can produce olefin compounds, aromatics, synthe-
sis gas, and other organic compounds derived from these materials, which
have a higher value than the raw materials.
Plastic Waste Management and Burden in Indonesia (February 2022) 13TABLE 1. CAPACITY OF PETROCHEMICAL UPSTREAM PRODUCERS,
OLEFINS AND AROMATICS IN INDONESIA 2020 (IN TON PER YEAR)
Pertamina Pertamina TPPI
Chandra [Refinery [Refinery (Trans-Pacific
Type of Asri Unit (RU) Unit (RU) Petrochemical
products (CAP) III Plaju] IV Cilacap] Indotama) Sub-Total End products
UPSTREAM
Olefin
Ethylene 900,000 0 0 0 900,000 PE
Propylene 490,000 45,000 0 0 535,000 PP. autmotive
spareparts, toys,
films
Butadiene 137,000 0 0 0 137,000 Synthetic rubber,
gloves (PPE)
Aromatic
Benzene 0 0 100,000 207,000 307,000 Material for PS
Pygas (Pyrolysis 418,000 0 0 0 418,000 Gas, olefins
gasoline)
Para-xylene 0 0 270,000 500,000 770,000 Raw material for
(p-Xylene) polymers
Crude C4/ 330,000 0 0 0 330,000 Solvent
Mixed C4
Sub-Total 2,275,000 45,000 370,000 707,000 3,397,000
Upstream
Source: CAP, 2021; Kemenperin, 2020; Pertamina, 2020
There are only a few companies produced the upstream petrochemical
products, such as olefins (ethylene, propylene, butadiene) and aromatic
products (benzena, pygas, para-xylene, mixed C4). The companies that
produce olefins and aromatics products are PT Chandra Asri Petrochemi-
cals Tbk, Pertamina Refinery Unit III (RU III Plaju) and Unit IV (RU
IV Cilacap) and PT Trans Pacific Petrochemical Indotama. Table 1 shows
the capacity of petrochemicals upstream producers, including olefins and
aromatics.
14Figure 3. Illustration of fractional distillation of crude oil. Source: British Plastic
Federation
Figure 4. Illustration of various chemicals obtained from fossil fuel after oil
refining. Source: American Fuel and Petrochemical Manufacturers
Plastic Waste Management and Burden in Indonesia (February 2022) 15Figure 5. Crude oil production in Indonesia has already declining since 2004 and struggling to fulfill the domestic petroleum consumption. Source: Siagian, Ucok et al. (2015) 2.2 MIDDLESTREAM PETROCHEMICALS INDUSTRY The next industry are the middle-stream manufacturers of virgin plastics sheets or pellets to be use further by the downstream industry. The mid- dlestream industries produced butanol, butene-1, Methyl Tert-Butyl Ether (MTBE), ethylene dichloride and vinyl chloride monomer for PVC, raf- finate-1, and styrene monomer. The producers at the middlestream level are Chandra Asri Petrochemical, Asahimas Chemicals, Sulfindo Adiusaha, Indorama Petrochemicals Indonesia and others. In the middle stream petrochemical industry, PT Asahimas Chemi- cal (ASC) is the major producer of PVC and its precursor chemi- cals. ASC has integrated Chlor Alkali-Vinyl Chloride plants in Cilegon, Banten, Indonesia, to produce basic chemicals for many downstream industries. In 1989, it started operation as a state-of- the-art production complex in Banten Province. Over the years, the complex has expanded several times, substantially increasing production capacity. The total investment of ASC now stands at USD 1,015 million. [[table 2]] 16
TABLE 2. CAPACITY OF PETROCHEMICAL MIDDLESTREAM PRODUCERS IN
INDONESIA 2020 (IN TON PER YEAR)

                                                                                 Petrochemicals (PTIP)
     Type of products

                                         ASC (AGC Group

                                                              PT Sulfindo Adi-
                        Petrochemi-cal

                                         - PT Asahimas

                                                                                 Indonesia Cilegon

                                                                                                                                      End products
                        Chandra Asri

                                                                                 PT. Indorama
                                         Chemical)

                                                                                                                          Sub-Total
                                                              usaha

                                                                                                           Other
                        (CAP)

MIDDLESTREAM
Butanol                 0                0                0                      0                       20,000          20,000 Phthal-
                                                                                                                                ates basic
                                                                                                                                ingredient
Butene-1                43,000           0                0                      0                                 0     43,000 Material
                                                                                                                                for PP
Ethylene                0                760,000          380,000                0                                 0    1,140,000 PVC
Dichloride
Methyl Tert-            128,000          0                0                      0                                 0     128,000 Anti-
Butyl Ether                                                                                                                      knocking
(MTBE)                                                                                                                           agent
Purified                0                0                0                      500,000                           0    500,000 PTA for
terephthalic                                                                                                                    polyester
acid (PTA)                                                                                                                      coatings
                                                                                                                                resin
Raffinate-1             170,000          0                0                      0                                 0     170,000 Precursor
                                                                                                                                 MTBE &
                                                                                                                                 DIB
Styrene                 340,000          0                0                      0                                 0    340,000 PS, cups,
monomer                                                                                                                         helmet
                                                                                                                                pad
Vinyl Chloride 0                         875,000          130,000                0                                 0   1,005,000 PVC
Monomer
Sub-                    681,000          1,635,000        510,000                500,000                 20,000        3,346,000
Total Mid-
dlestream

Source: CAP, 2021; Kemenperin, 2020; PTIP, 2020

ASC operates the largest chlor alkali-vinyl chloride plant in Southeast
Asia. By focusing on chemical and industrial markets, ASC has the capac-
ity to produce Caustic Soda (NaOH), Ethylene Dichloride (EDC), Vinyl
Chloride Monomer (VCM), Polyvinyl Chloride (PVC), Hydrochloric Acid
(HCI) and Sodium Hypochlorite (NaCIO).

                                             Plastic Waste Management and Burden in Indonesia (February 2022)                                        17
ASC has three plants in Banten, operated by a distributed control system, highly efficient and set high-quality standards. In the first process, which consists of three trains, Caustic Soda is produced. The derivative products include Chlorine Gas, Hydrogen, Hydrochloric Acid solution and So- dium Hypochlorite solution. The second process produces Vinyl Chloride Monomer as a raw material for the production of PVC. This plant consists of two trains. Chlorine Gas, generated in the Chlor Alkali plant, reacts with Ethylene to produce Ethylene Dichloride; this is then cracked into VCM. The third process, made up of three trains, produces Polyvinyl Chloride, and it is at this stage, VCM is polymerized into PVC. Figure 6. Chimneys stand tall at the newly constructed gas processing plants operated by Chandra Asri in the industrial city of Cilegon in Banten, West Java. Source: Jakarta Post 18
Figure 7. ASC’s state-of-
the-art integrated Chlor-
Alkali to Polyvinyl Chloride
production complex.
Source: ASC

2.3 DOWNSTREAM PETROCHEMICALS INDUSTRY

The downstream industries produced polyethylene, HDPE, LLDPE, PP,
PVC, PET, rPET, ABS. polyester, acrylic acid, and 2-ethylhexanol. The
producers at the downstream level are Chandra Asti, Asahimas Chemi-
cals, Sulfindo Adiusaha, Indorama Petrochemicals Indonesia and others.

For production volumes of types of plastic polymers in Indonesia, PE, PP
and PET account for 34%, 31% and 12% (totaling 77%) respectively. The
production of PVC is 11%, PS is accounted for 7% while ABS and PC are
3% and 2% respectively.17

CAP is the largest integrated petrochemical producer in Indonesia and
operates the country’s only Naphtha Cracker, Styrene Monomer, Buta-

17   Dimas Andi and Anna Suci Perwitasari, Kontan.co.id, 04 April 2021. Pemerintah dorong industri
     manufaktur berbasis ekonomi sirkular. Accessed by 7 June 2021 https://industri.kontan.co.id/news/
     pemerintah-dorong-industri-manufaktur-berbasis-ekonomi-sirkular

                                Plastic Waste Management and Burden in Indonesia (February 2022)     19
diene, MTBE (Methyl Tert-Butyl Ether/Butene-1) and Butene-1 plants. CAP’s naphtha annual consumption is 2,500 tons at total capacity, and currently, on average, the cracker utilization rate is >90%. The market share of CAP is approximately 50%, 30%, and 32% of the domestic market (including imports) in Olefin, Polyethylene, and Polypro- pylene, respectively. Polyolefin producer manufactured plastic raw mate- rials and primary petrochemical products used for packaging products, pipes, automotive, electronics to support Indonesia’s growth and industri- alization. PT Chandra Asri Petrochemical Tbk (CAP) is a subsidiary of PT Barito Pacific Tbk. Their plants are located in Cilegon and Serang, Banten Province, Java. In 2020, PT Trans-Pacific Petrochemical Indotama (TPPI) produced 1.2 million tons of benzene, toluene, and xylene (BTX) per year. BTX is an important chemical raw material that can boost non-food industries such as textiles and tires. In addition to producing BTX, TPPI will also produce olefins from light naphtha, processing around 500,000 tons-1 million tons per year. Howev- er, TPPI is still waiting for the government to determine whether the light naphtha will be mixed with fuel or become industrial raw materials. The Lotte factory in Cilegon, Banten, targets a total naphtha cracker pro- duction capacity of 2 million tons per year. If the Lotte and Chandra Asri factories operate in 2023, Indonesia can reduce imports of petrochemical products by more than 60 per cent.18 PT Chandra Asri Petrochemical Tbk is also building a second naphtha cracker processing plant (CAP2) which requires an investment of USD 4-5 billion. With the additional investment from Lotte Chemical and Chandra Asri, Indonesia will produce 3 million tons of naphtha cracker- based chemical raw materials per year. Thus, Indonesia can position itself as the 4th largest producer of naphtha crackers in ASEAN after Thailand, Singapore and Malaysia.19 Siam Cement Group plans to build a naphtha cracker production facility worth USD5.5 billion in Cilegon, Banten. This petrochemical plant will have a production capacity of 1.2 million tons per year. This investment creates jobs and increases added value, and the output is also to meet the needs of the domestic and export markets. 18 Ministry of Industry, 19 May 2018. Accessed by 10 January 2021. https://kemenperin.go.id/ar- tikel/19269/Bangun-Pabrik-Akhir-2018,-Industri-Petrokimia-Korea-Bisa-Substitusi-Impor 19 https://www.chandra-asri.com/files/attachments/downloads/Presentasi/2021/Chandra%20Asri%20 Earnings%20Update%20Q1%202021.pdf 20
TABLE 3. CAPACITY OF PETROCHEMICAL DOWNSTREAM PRODUCERS IN INDONESIA 2020 (TON PER YEAR)

                                                                                                                                                                       PT Veolia
                                                                                                                                                                       Services                    PT.
                                                                                                                                                                       Indonesia    PT. Indorama   Indorama    PT Indorama
                                                                                              Chandra                  Pertamina   Masplene/   ASC (AGC                & PT Tirta   Ventures       Polypet     Polyester
                                                                                              Asri Petro-   Lotte      Refinery    PT          Group - PT   PT         Investama    Indonesia      Indonesia   Industries
                                                                                              chemicals     Chemical   Unit III    Polytama    Asahimas     Sulfindo   (Danone      (PTIVI)        (PTIPPI)    Indonesia
                                                                   Type of products           (CAP)         Titan      Plaju       Propindo    Chemical)    Adiusaha   Aqua)        Tang.          Cilegon     Karawang      Other     Sub-Total   Remarks
                                                                   DOWNSTREAM
                                                                   Polyethylene               736,000       0          0           0           0            0          0            0              0           0             0         736,000     PE, PET, containers

                                                                   HDPE                       336,000       250,000    0           0           0            0          0            0              0           0             0         586,000     HDPE

                                                                   LLDPE                      400,000       200,000    0           0           0            0          0            0              0           0             0         600,000     LLDPE

                                                                   Polypropylene (PP)         590,000       0          45,000      300,000     0            0          0            0              0           0             0         935,000     PP

                                                                   Polyvinyl Chloride         0             0          0           0           550,000      110,000    0            0              0           0             202,000   862,000     PVC

                                                                   Polyethylene Terephthal-   0             0          0           0           0            0          0            95,000         102,000     0             0         197,000     PET
                                                                   ate (PET)

                                                                   recycled Polyethylene      0             0          0           0           0            0          25,000       0              0           0             0         25,000      rPET
                                                                   Terephthalate (rPET)

                                                                   Synthetic Rubber (ABS)     120,000       0          0           0           0            0          0            0              0           0             75,000    195,000     Tires, O-ring, etc.

                                                                   Polyester                  0             0          0           0           0            0          0            0              0           38,000        0         38,000      Polyester

                                                                   Acrylic Acid               0             0          0           0           0            0          0            0              0           0             140,000   140,000     Plastic diapers, textile,
                                                                                                                                                                                                                                                   etc

Plastic Waste Management and Burden in Indonesia (February 2022)
                                                                   2-ethylhexanol             0             0          0           0           0            0          0            0              0           0             140,000   140,000     Plasticizers

                                                                   SUB-TOTAL DOWNSTREAM       2,182,000     450,000    45,000      300,000     550,000      110,000    25,000       95,000         102,000     38,000        557,000   4,454,000

21
                                                                   Source: CAP, 2021; Kemenperin, 2020; PTIP, 2020
Figure 8. PVC application in Figure 9. Various products of synthetic
products. Photo: ASC rubber. Photo: Prasad International
Figure 10. Type of plastic produce and utilization in various sectors.
Source: KLHK, 2020
Figure 11. PT TPPI’s light naphtha Figure 12. Pertamina and CPC Taiwan
storage tank capacity of 11,400 m3. have signed an agreement to build a
Photo: PT TPPI naphtha cracker plant, to produce 1
million tons/year of ethylene. Photo:
Pertamina
22The Ministry of Industry noted that naphtha crackers from national in-
dustrial production reach only 900 thousand tons per year, while domes-
tic demand is 1.6 million tons. The petrochemical industry is designated
as one of the strategic upstream sectors because it provides raw materials
for almost all downstream sectors, such as the plastics, textile, paint, cos-
metics and pharmaceutical industries.
From the petrochemical industry’s perspective, sustainability in the devel-
opment of the petrochemical industry is considered crucial for Indonesia’s
economic activity. With its capital-intensive, technology-intensive, and
massive energy-consuming nature, it is not surprising that the develop-
ment of the petrochemical industry has received special attention from
the government.20
20 Andi Arif. 2019. Evaluation of the Plastic Industry in 2019. Bisnis.com. Accessed by 5 December
2020. https://ekonomi.bisnis.com/read/20191230/12/1185390/evaluation-industri-plastik-ta-
hun-2019.
Plastic Waste Management and Burden in Indonesia (February 2022) 23TABLE 4. SUMMARY OF THE CAPACITY OF UPSTREAM, MIDDLESTREAM
AND DOWNSTREAM PETROCHEMICAL, OLEFIN AND AROMATIC PRODUCERS
IN INDONESIA 2020 (IN TON PER YEAR)
Type Of Products Sub-Total End Products
UPSTREAM
Olefin
Ethylene 900,000 PE
Propylene 535,000 PP, automotive sparepart, toys, films
Butadiene 137,000 Synthetic rubber, gloves
Aromatic
Benzene 307,000 Material for PS
Pygas (Pyrolysis gasoline) 418,000 Gas, olefins
Para-xylene (p-Xylene) 770,000 Raw material for polymers
Crude C4/Mixed C4 330,000 Solvent
Sub-Total Upstream 3,397,000
MIDDLESTREAM
Styrene Monomer 340,000 Material For PS, Cups, Helmet Pad
Vinyl Chloride Monomer 1,005,000 PVC
Methyl Tert-Butyl Ether (Mtbe) 128,000 Anti-Knocking Agent
Purified Terephthalic Acid (Pta) 500,000 PTA For Polyester Coatings Resin
Raffinate-1 170,000 MTBE & DIB
Butene-1 43,000 Material For PP
Ethylene Dichloride 1,140,000 PVC
Butanol 20,000 Phthalates Basic Ingredient
Sub-Total Middlestream 3,346,000
24Type Of Products Sub-Total End Products
DOWNSTREAM
Polyethylene 736,000 PE, PET, containers
HDPE 586,000 HDPE
LLDPE 600,000 LLDPE
Polypropylene (PP) 935,000 PP
Polyvinyl Chloride 862,000 PVC
Polyethylene Terephthalate 197,000 PET
(PET)
recycled PET (RPET 25,000 rPET
Synthetic Rubber (ABS) 195,000 Tires, O-ring, etc.
Polyester 38,000 Polyester
Acrylic Acid 140,000 Plastic diapers, textile, etc
2-ethylhexanol 140,000 Plasticizers
Sub-Total Downstream 4,454,000
TOTAL 11,197,000
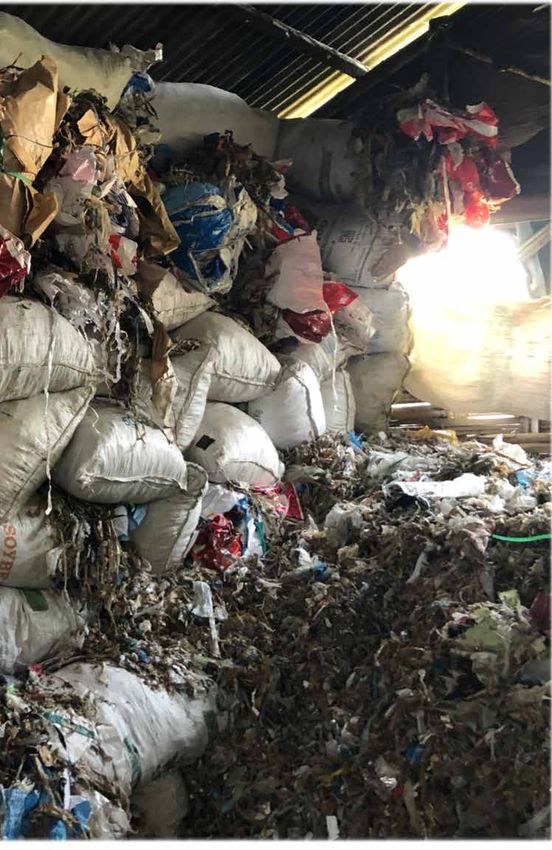
Plastic Waste Management and Burden in Indonesia (February 2022) 253. PLASTICS INDUSTRY IN INDONESIA 3.1 DISTRIBUTION AND SCALE OF THE PLASTIC MANUFACTURERS Indonesia’s domestic demand for plastics has increased by five per cent to 4.6 million tons in the last five years. Currently, the national demand for plastic raw materials reaches 7.2 million tons per year. Of that amount, there are as many as 2.3 million tons of raw materials in the form of lo- cal virgin plastic supplied by the domestic petrochemical industry. The plastics industry faces various challenges as it develops, including supply and demand for raw materials such as polyethylene and polypropylene (Pardosi & Mulyana, 2019). Meanwhile, the need for raw materials for the national plastic recycling industry is around 2 million tons with a domestic supply of approximately 913,000 tons, and the rest is imported. The Minister of Industry stated that the plastic recycling industry could produce various value-added products with economic potential reaching more than Rp 10 trillion per year or US$ 690 million per year. Meanwhile, the export potential of re- cycled plastic derivative products can reach US$141.9 million per year.21 According to the Ministry of Industry’s records, the value of petrochemical imports reached USD20 billion or Rp.284 trillion in 2019. Throughout 2019, the trade balance for all chemicals was still a deficit of Rp.193 tril- lion, with an export value of Rp.124 trillion. Ministry of Industry data show that in 2019 there were 1,581 companies - around 380 large industries and 1,200 small-medium industries - with an investment value of IDR 7.15 trillion engaged in the plastics industry, with a total of 177,300 workers employed.22,23 21 Elsa Catriana, Bambang P. Jatmiko. Kompas.com, April 05, 2021. Minister of Industry: The Use of Plastics in Indonesia is at the Bottom of the World. Accessed 7 June 2021 from https://money.kom- pas.com/read/2021/04/05/172547126/menperin-use-plastik-di- indonesia-berada-di-peringkat-ter Bawah-dunia 22 Dimas Andi and Anna Suci Perwitasari, Kontan.co.id, 04 April 2021. Pemerintah dorong industri manufaktur berbasis ekonomi sirkular. Accessed by 7 June 2021 https://industri.kontan.co.id/news/ pemerintah-dorong-industri-manufaktur-berbasis-ekonomi-sirkular 23 ADUPI, Focus Group Discussion Nexus3 with plastic and paper recycling industries, 29 July 2021. 26
Approximately 892 companies are manufacturing plastic packaging.24
Most plastic manufacturers and recycling industries are concentrated in
Java and Sumatra as shown in Figure 11.

The total production capacity of these producers is about 5 million tons
per year, and most of these companies produce conventional petroleum-
based downstream plastics products. The domestic petrochemical indus-
try supplied 50% of the raw materials of the downstream plastic industry
to make a limited type of product.

On the other hand, the demand for domestic petrochemical products is
still huge. The volume of polyethylene demand, for example, reaches 2.3
million tons per year. Domestic production can only meet 280,000 tons
per year, and the rest has to import 1.52 million tons from other countries.

3.2 TAX HOLIDAYS, TAX ALLOWANCE, AND PLASTIC TAX

3.2.1 Tax holidays
Indonesia’s petrochemical industry is currently referred to as one of the
sectors that imports raw materials. The Indonesian government hopes
to stop importing petrochemicals within the next 4-5 years. To that end,
several policies have been developed, including tax incentives, such as tax
allowances and tax holidays.25

Tax Holiday is a tax facility or tax incentive that applies and can be used
by newly established companies. Tax Holiday is also given in the form of
exemption from payment of corporate income tax or it can also be in the
form of reduction of the Corporate Income Tax rate from companies that
invest new capital in the country within a certain period.

The birth of this tax holiday is based on the statement contained in Law
no. 25 of 2007, Article 18 concerning Investment. Tax holidays are devel-
oped and enforced in the industry to promote growth. However, not all
industries can easily enjoy this tax holiday facility. Investors who wish to
enjoy this facility must meet all the requirements requested, such as creat-
ing a lot of jobs, bringing in new technology, entering small and underde-
veloped areas, and providing added value to the industry.

Chandra Asri, a major petrochemical industry in Indonesia, received
100% tax holiday for their corporate income tax for the first 20 years on
its commercial production, followed by 50% tax reduction for 2 years.

24 Ibid
25 Petrokimia Jadi Tumpuan Masa Depan. Monday, 31 August 2020. Accessed by 7 June 2021 https://
   indonesia.go.id/kategori/indonesia-dalam-angka/2025/petrokimia-jadi-tumpuan-masa-depan

                             Plastic Waste Management and Burden in Indonesia (February 2022)   27
Chandra Asri contributed to more than 50% of its petrochemical Olefins and Polyolefins importations. In addition, they planned to double their production to 8 million tonnes a year with products including: PE, PP, and aromatics.26 Tax holidays is part of the Indonesian government regulations, Minister of Finance Regulation No.159 of 2015 concerning Corporate Income Tax Reduction Facility (PMK No. 159/2015). This fiscal incentive facility is given to any industry that invested The Indonesian government has set a 100 per cent reduction in income tax without exception and can be given for investments worth IDR 500 billion (approx. USD35 million) in 17 pioneer sectors. This regulation is looser than before, where income tax reductions range from 10 per cent to 100 per cent and would be granted for investment value is more significant than IDR 1 trillion (approx. USD70 million) in eight sectors.27 The tax holiday rules are rooted in Law (UU) Number 25 of 2007 con- cerning Investment. Article 18, paragraph 5 of the regulation states that the government can provide an exemption or reduction of income tax in a certain amount and time and can only be given for new investments in the pioneer industry. 3.2.2 Tax allowance Just like a tax holiday, a tax allowance is also included in one of the tax facilities provided to investors to reduce their income tax which is calcu- lated based on the amount of investment invested in business fields in the region. David Holland and Richard J. Vann defined a tax allowance as a form of tax relief based on the value of expenditure on qualified invest- ments (Holland & Vann, 1996). In addition, the mechanism and technicalities for the provision of this tax allowance have been regulated in Government Regulation No. 9 of 2016 which was updated with PP No. 18 of 2015 concerning Income Tax Facili- ties for Investment Activities in Certain Business Sectors and in Certain Regions.28 26 Press release by Chandra Asri, 2020, accessed by 7 May 2021. http://www.chandra-asri.com/files/ attachments/press_releases/2020/ CAP%20-%20Siaran%20Pers%20-%20Tax%20Holiday%20 Chandra%20Asri%20Perkasa%20(ENG).pdf 27 https://www3.bkpm.go.id/id/publikasi/detail/berita/delapan-perusahaan-berinvestasi-rp-1613-t- dapat-tax-holiday 28 Peraturan Pemerintah No. 18/2015 tentang Fasilitas Pajak Penghasilan Untuk Penanaman Modal di Bidang-bidang Usaha Tertentu dan atau di Daerah-daerah Tertentu https://peraturan.bpk.go.id/ Home/Details/5582 28
3.2.3 Value Added Tax for plastic products
Plastic tax, especially in food and beverage sector, has been discussed
in various forum in the last five years. Value Added Tax (VAT) has been
discussed among the Indonesian recycling sector as a rule that will hinder
the effort in promoting recycling business.

Many players in the downstream recycling chain are not tax registered,
which means that the buyers higher in the chain cannot deduct any tax
from the tax paid over their sales. In fact, according to the Plastic Re-
cycling Association (ADUPI) and the Indonesian Packaging Federation
(IPF), VAT — and/or its percentage — needs to be reviewed in the case of
recyclables since the value actually decreases (Halim et al., 2018).

VAT on recyclables affects the price being paid for recyclable materials
throughout the supply chain. The tax registered buyers who are high in
the chain need to compensate this loss by decreasing the price they pay to
the middlemen and the scavengers. When the sales of distributors de-
creased the price by 10%, the impact on scavengers will also decreased by
30 to 50% of the price paid for their product.

This decrease in prices is due to the removal of contaminants such as the
non-recyclable components — i.e. food residues, mud and non-recycled
components, such as aluminum lids and labels — causes the volume of
material to shrink at every step of the process, and therefore multiply the
value loss.

Regarding the VAT, ADUPI and IPF proposed two solutions:

1.   VAT payment could be enforced throughout the whole sector, from
     scavengers to high-tech recycling facilities.
2. To exempt the recycled plastic from VAT. The recycling sector rec-
   ommends exempting the recycling chain from VAT since registering
   the complete scavenger network and its supply chain does not seem
   practically feasible.

Meanwhile, for plastic products, early 2020, the Minister of Finance
(Menkeu) Sri Mulyani Indrawati said the application of excise on plastics
would take place next year. This is the government’s strategy to pursue tax
revenues in 2022.29

Minister of Finance Sri Mulyani Indrawati said the application of excise
on plastics would take place next year. This is the government’s strategy to

29 https://newssetup.kontan.co.id/news/pemerintah-berencana-terapkan-cukai-plastik-tahun-
   depan?page=all

                             Plastic Waste Management and Burden in Indonesia (February 2022)   29
pursue tax revenues in 2022. In the 2022 State Revenue and Expenditure Budget (APBN), the tax revenue target is within the range of Rp. 1,499.3 trillion to Rp. 1,528.7 trillion. This figure rose 8.37% to 8.42% from the projected 2021 tax revenue. The discourse on plastic excise has been around for a long time. At least last year, the government wanted to implement it, but due to considering the impact of the coronavirus pandemic, it was finally postponed. How- ever, at the end of last year, the Ministry of Finance reported that excise would be imposed on all plastic products. The proposal grew because, previously, it only imposed excise duty on plastic bags with an excise rate of Rp 200 per sheet. This plan is also claimed by the Ministry of Finance that has been approved by Commission XI of the Indonesian House of Representatives. A researcher from the Institute for Economic and Community Research University of Indonesia (LPEM-UI) assessed the imposition of excise on all plastic products. They considered the plan as appropriate because it will be applied to all plastic products.30 The researcher argued that if excise duty was imposed on plastic products, public consumption would likely not be greatly affected. As a non-elastic product, the price of plastic will be higher, but people will still buy it because it is a supporting component for most food and beverages packag- ing. In terms of plastic excise tariffs, the tax should be applied differently depending on the type of plastic and its impact on the environment. This method is also useful so that the government can assess the effectiveness of excise on public consumption of various plastic products. However, the Secretary-General of the Indonesian Plastic Industry As- sociation (Inaplas) said that the imposition of a plastic excise tax would reduce the industry’s profitability. INAPLAS refused the idea to impose a plastic tax as it would decrease the income tax (PPh) and value-added tax (PPN) revenues from plastic bag companies.31 The impact of imposing a tax on plastic varied, one of them could include the termination of employment. INAPLAS reminded that next year the Indonesian economy will still be in the recovery stage. Further, INAPLAS representative said that the excise policy is better imposed on imported plastic raw materials or plastic products. They believed that imposing the 30 Ibid 31 Ibid 30
Note: red dot is a special
economic zone of with
trade facilities. Companies
in this special economic
zone allowed to import
their raw materials
but have to export the
products and not allowed
to sell it to the local or
domestic market.

Figure 13. Distribution of plastic industry in Indonesia. Source: KLHK, 2020

tax on imported plastic will quickly boost excise revenues without disrupt-
ing the economy of the plastic bag industry. Virgin plastic imports are
relatively high reached around 2 million tons per year, while the finished
goods get 1 million tons per year.

Through the Directorate General of Customs and Excise, the Indonesian
government proposes a plastic excise duty for plastic bags of Rp. 30,000
(approx. USD2.1) per kilogram. The DG Custom & Excise set this amount
after comparing the value applied in other Asian countries such as Ma-
laysia, at around Rp. 63,000 (approx. USD4.41), the Philippines at Rp.
200,000 (approx. USD14.00), and Vietnam who charges Rp. 24,900 (ap-
prox. USD1.74).

A spokesman for the Indonesia Packaging Federation (IPF) said that plas-
tic excise taxes had been around for a long time since 2019. According to
IPF, if the government’s reason is related to environmental pollution, then
it’s better not only plastics that are subject to excise. If the plastic excise
tax still wants to be applied, then the excise should be reused for plastic
waste management itself, like in Europe.

In Europe, these funds are used as environmental fiscal incentives or
incentives for the recycling industry to manage the waste collection, sort-
ing and other incentive mechanisms. There should be a tariff policy for
imports of paper scrap from abroad but mixed with plastic, then an EPR
(extended producer responsibility), standardization and roadmap policy
of a circular economy system according to the mandate of the Waste Law
no. 18 of 2008.32

32 https://ekonomi.bisnis.com/read/20210506/257/1391496/rencana-cukai-plastik-kembali-muncul-
   begini-kata-industri

                              Plastic Waste Management and Burden in Indonesia (February 2022)   31
3.3 PLASTIC CONSUMPTION, RECYCLABILITY, AND CIRCULARITY
3.3.1 Plastic consumption
According to the Indonesian Aromatic and Plastic Olefin Association
(INAPLAS), Indonesia’s plastic consumption per capita in 2019 was 23 kg
per person per year.33 If Indonesia’s population in 2019 was 270 million
people, it is estimated that Indonesia’s annual plastic consumption was
more than 6.2 million tons. The biggest plastic user in Indonesia is the
food and beverage packaging sector, which reaches up to 65% of the total
national plastic consumption. The nature of food and beverage packaging
products are generally disposable (KLHK, 2020).
By the second quarter of 2021, the Indonesia Statistics Bureau an-
nounced that there are five sectors with high growth rate: transportations
(45.70%), base metals (18.03%), machineries and auxiliaries (16.35%),
rubber and plastics (11.72%), chemicals, pharmaceutical, and traditional
medicines (9.5%).
With the growing middle-class to 90 million by 2030, there will be an
increased demand for products utilizing plastic packaging (WEF, 2020).
Several factors that contributed to the increased demand and consump-
tion of packaging by 2030 are:
• Over 35 million people are expected to move to big cities by 2030.
• The urban population could account for 71% of the total population
by 2030.
• Increased urbanization contributes to total overall trade and wastes
generation.
3.3.2 Plastic waste recycling and for fuel substitutions
There are four tiers of the concept of plastic recycling (Goodship, 2007),
namely:
• Level 1: mechanical reprocessing of plastic chips/crushed produced
from industrial production processes. This level is called primary
recycling or mechanical recycling.
• Level 2: mechanical reprocessing of materials collected from post-
consumer plastic goods. This level is called secondary recycling or
mechanical recycling.
33 Andi M. Arif. Bisnis.com, 30 December 2019. Evaluasi Industri Plastik 2019. Accessed by 7 June 2021
https://ekonomi.bisnis.com/ read/20191230/12/1185390/evaluasi-industri-plastik-tahun-2019
32• Level 3: chemical reprocessing of materials collected from post-con-
sumer plastic goods. This level is called tertiary recycling or chemical
recycling.
• Level 4: the incineration of materials collected from post-consumer
and post-industrial plastic goods. This level is called quaternary recy-
cling or energy recycling.
Many SMEs of plastic recycling in Indonesia are working at Level 2 using
mechanical processing with materials collected from post-consumers. At
the moment, only one FMCG company, Unilever, piloted a technology
Level 3 (chemical recycling) to recycle sachet/multi-layers plastic post-
consumer packaging.
Most of the raw materials for plastic bags are recycled plastic. The plastic
bag industry absorbs 6.5% of the total national plastic ore/pellets con-
sumption reaches 366,000 tons and employed about 30,000 workers.34
With technological advancement, there are new machines that can recycle
all types of plastic at the same time. It is well known among the plastic in-
dustry that recycling mixed plastics with different kinds of additives could
damage the engine.
Currently, PET and HDPE are the most common plastic that can be re-
cycled. Large plastic producers may be able to recycle LDPE and PP. Most
PVC, Poly-Styrene, and other types of plastic cannot be recycled. In many
places, scavengers do not collect styrofoam because it is of no value and
cannot be recycled.
Several scavenger groups who sort the waste also stated that ABS (acry-
lonitrile-butadiene-styrene) and polycarbonate (PC) plastics were of no
value and could not be recycled.
Currently, PET and HDPE are the most common plastic that can be
recycled. Large plastic producers may be able to recycle LDPE and PP.
Most PVC, Poly-Styrene, and other types of plastic cannot be recycled. In
many places, scavengers do not collect styrofoam because it is of no value
and cannot be recycled. Several scavenger groups who sort the waste also
stated some plastics, such as ABS (acrylonitrile-butadiene-styrene) and
polycarbonate (PC) plastics, were of no value and could not be recycled.
Thermoplastics are defined as polymers that can be melted and recast al-
most indefinitely. They are molten when heated and harden upon cooling.
When frozen, however, a thermoplastic becomes glass-like and subject to
34 https://ekonomi.bisnis.com/read/20191230/12/1185390/evaluasi-industri-plastik-tahun-2019
Plastic Waste Management and Burden in Indonesia (February 2022) 33fracture. These characteristics, which lend the material its name, are re-
versible, so the material can be repeatedly reheated, reshaped, and frozen.
As a result, thermoplastics are mechanically recyclable. Some of the most
common types of thermoplastic are polypropylene, polyethylene, poly vi-
nyl chloride, polystyrene, polyethylene ether phthalate and polycarbonate.
Thermoplastics have a simple molecular structure comprising chemically
independent macromolecules. They are softened or melted upon heating,
then shaped, formed, welded, and solidified when cooled. Multiple cycles
of heating and cooling can be repeated, allowing reprocessing and recy-
cling.
Thermoplastics have been around for a long time and are an essential
component of everyday life today. For example:
• Various automobile parts;
• Eyeglass lenses;
• Acrylonitrile butadiene styrene (ABS) is a thermoplastic used to
manufacture:
• Sports equipment.
• Toys - for instance, LEGO® blocks.
• Polycarbonate is used to make:
• CDs and DVDs.
• Drinking bottles
• Food storage containers
• Polyethylene is probably the most common thermoplastic and is used
to make:
• Shampoo bottles.
• Plastic grocery bags.
• Bullet-proof vests.
Thermosets, alternately known as thermosetting plastics or thermosetting
polymers, are materials that remain in a permanent solid state after being
cured one time. Polymers within the material cross-link during the curing
process to perform an unbreakable, irreversible bond. This means that
thermosets will not melt even when exposed to extremely high tempera-
tures.
34You can also read


