Plastics, the circular economy and Europe s environment- A priority for action - European ...
←
→
Page content transcription
If your browser does not render page correctly, please read the page content below
EEA Report No 18/2020

Plastics, the circular economy
 and Europe′s environment —
             A priority for action

                                                   1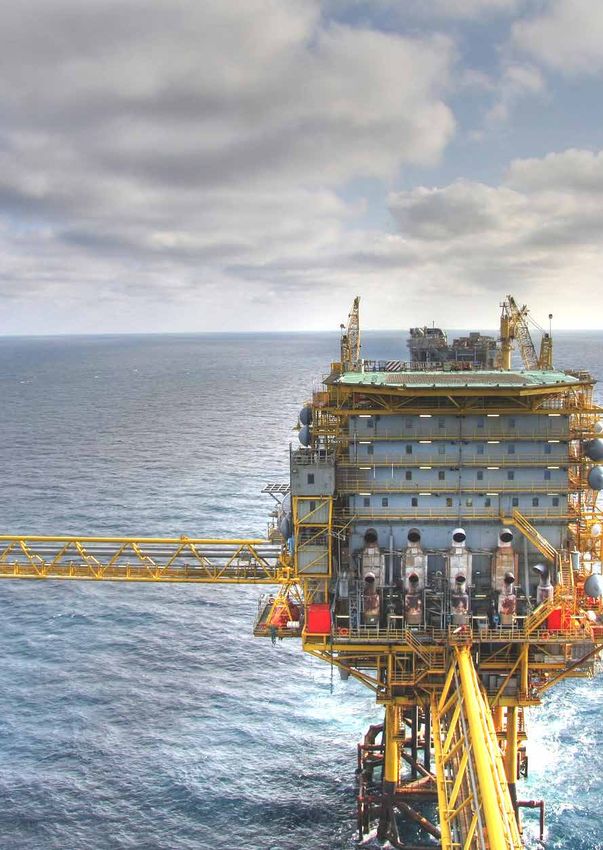
Cover design: Formato Verde
    Cover image © iStock.com/Thomas Faull
    Publication design: Formato Verde

    Legal notice
    The contents of this publication do not necessarily reflect the official opinions of
    the European Commission or other institutions of the European Union. Neither
    the European Environment Agency nor any person or company acting on behalf
    of the Agency is responsible for the use that may be made of the information
    contained in this report.

    Copyright notice
    © EEA, Copenhagen, 2021
    Reproduction is authorised, provided the source is acknowledged, save where
    otherwise stated.

    Luxembourg: Publications Office of the European Union, 2021

    ISBN: 978-92-9480-312-2
    ISSN: 1977-8449
    doi: 10.2800/5847

    You can reach us
    By email: signals@eea.europa.eu
    On the EEA website: www.eea.europa.eu/signals
    On Facebook: www.facebook.com/European.Environment.Agency
    On Twitter: @EUEnvironment
    On LinkedIn: www.linkedin.com/company/european-environment-agency
    Order your free copy at the EU Bookshop: www.bookshop.europa.eu

2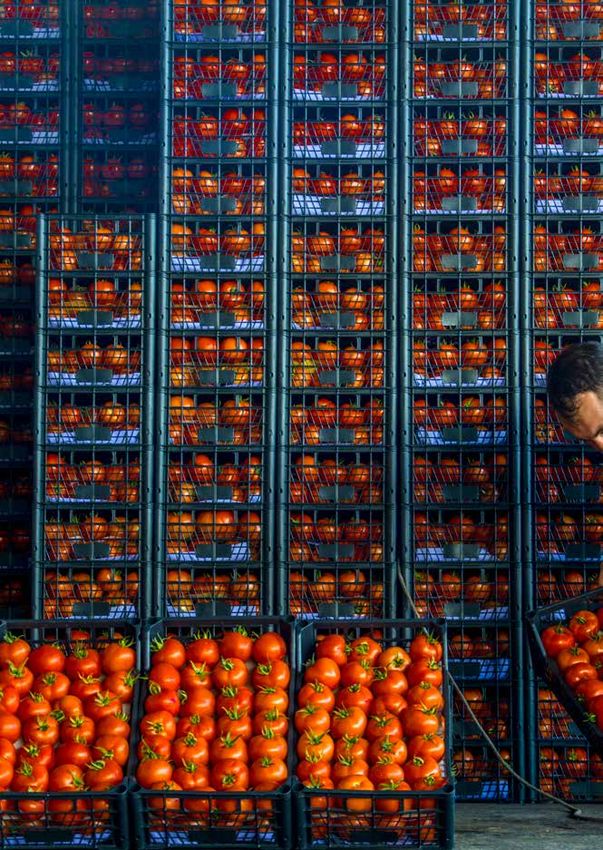
Contents
Acknowledgements4

Summary6

About plastics and the circular economy                9

The consumption, production and trade of plastics     15

Environmental and climate impacts of plastic          29

The road ahead: towards a circular plastics economy   53

What can you do as a consumer?                        67

List of abbreviations and acronyms                    69

References70

                                                            © Pexels   3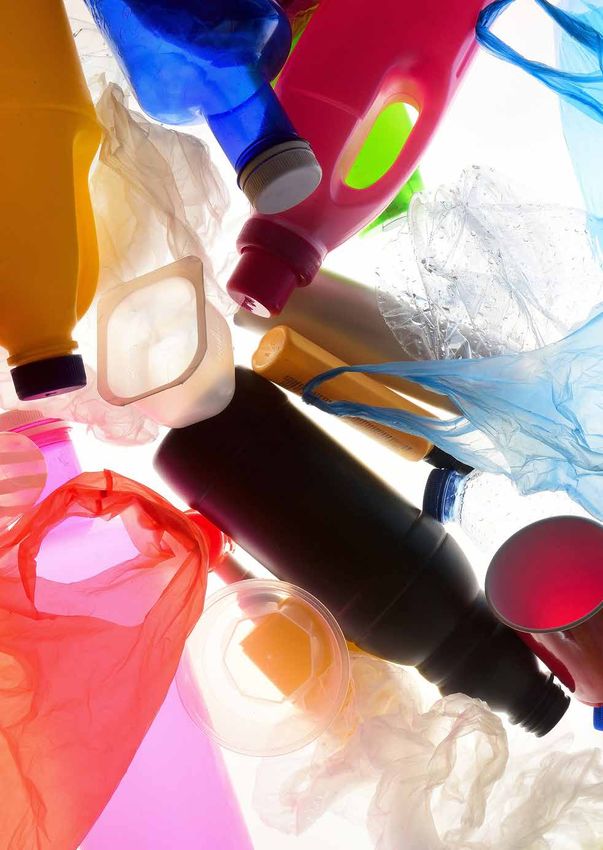
Acknowledgements
    Lars Fogh Mortensen and Ida Lippert Tange (both from the EEA) co-authored this report
    with Åsa Stenmarck, Anna Fråne, Tobias Nielsen, Nils Boberg (all from the IVL Swedish
    Environmental Research Institute) and Fredric Bauer (Lund University), who prepared a
    technical report commissioned by the EEA providing underpinning analyses for this report.

    Martin Adams and Daniel Montalvo (both from the EEA) provided guidance, comments and
    strategic oversight in the preparation of this report. James Daniell (from the EEA) led the editing.

    The following are thanked for their input during the preparation of the report:

    •   Ioannis Bakas, Ricardo Fernandez, Almut Reichel, Xenia Trier and Bastian Zeiger (from
        the EEA);

    •   Representatives from the European Commission’s Directorate-General for Environment.

4
Plastic items and products surround us every day © Pixabay 5

Summary
Plastics play an essential role in modern society, but also lead to significant impacts on
the environment and climate. Reducing such impacts while retaining the usefulness of
plastics requires a shift towards a more circular and sustainable plastics system. This
report tells the story of plastics, and their effect on the environment and climate, and
looks at their place in a European circular economy.
Plastics comprise a range of materials, In recent years, plastic has been subject
each with its own unique characteristics, to increased focus and attention from
properties and applications — 99 % of an environmental perspective. Being
plastics are made from carbon from lightweight and durable are two key
fossil fuels (CIEL, 2019). The consumption strengths of plastic, but this also means
and production of plastics have grown that plastic spreads easily and can persist
exponentially since the 1950s, with the in the environment for many years.
resulting products (including packaging, Plastic waste can now be found in our
kitchenware, electronics, textiles, car parks, on our beaches, at the bottom of
components and furniture) constituting the oceans and seas, on top of mountains
an important part of everyday life. Plastics and even inside our bodies. The leakage
are light, cheap, durable and can be made of plastics into the environment poses a
in an infinite number of variations, and significant problem for current and future
the plastics industry contributes to growth generations, and there are significant
and job creation. gaps in our knowledge about the kind
of effects that this exposure can have.
Plastic packaging is the largest sector The potential magnitude of impacts on
of the plastics industry, representing the environment and human health
almost 40 % of total plastic consumption. varies a lot depending on the type of
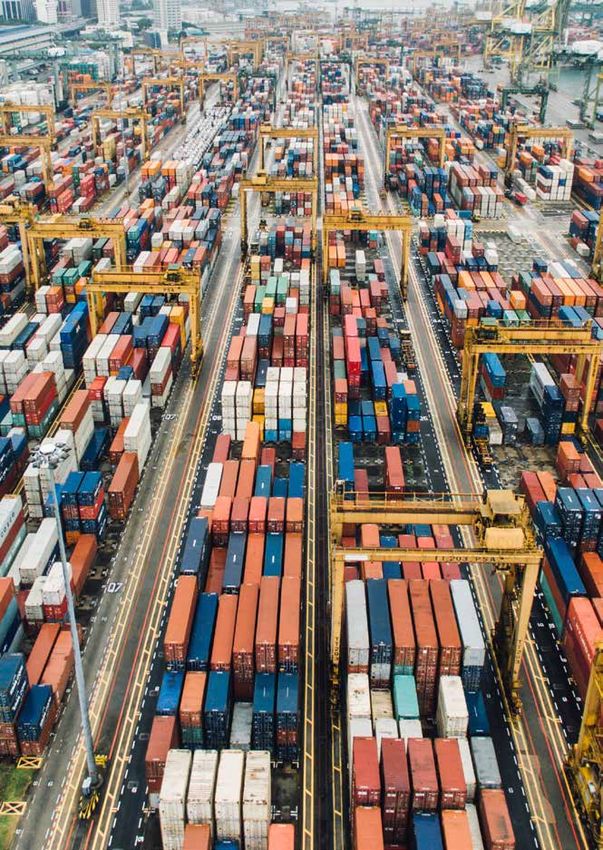
Among other things, plastics provide new plastics and the chemical additives they
transport solutions for the logistics sector, contain. The negative effects of plastics
and they are important for improving go beyond littering and leakage: 7 % of
hygiene in healthcare (e.g. in virus crude oil output is used to make plastics,
protection) and for reducing food waste a proportion set to grow rapidly as
by keeping food fresh for longer. Plastics consumption of plastics is expected to
are also used in cars and aeroplanes, double in the coming 20 years (EC, 2020).
reducing weight and improving fuel The energy and fossil feedstock used
efficiency, in synthetic fibres in clothing to produce and transport plastics and
and other textiles, and in furniture manage plastic waste creates a large and
and kitchenware. growing carbon footprint.
6
Today, plastics are too often used as single
use products, then discarded, then too
often littered. The current linear models of
production and consumption of plastics are
failing nature and our economy at the same
time, which is why we need a circular plastics
economy. Reducing the environmental and
climate impacts of plastics, while retaining
the usefulness of plastics in society, requires
making the systems of plastic consumption and
production more circular, resource efficient and
sustainable, thereby enabling longer use, reuse
and recycling. Adequate policies and the scaling
of circular business models can, together
with changes in the behaviour of producers
and consumers, enable a more circular and
sustainable plastics system.

This report introduces the wide family
of plastics and briefly explores the main
challenges involved in transitioning towards
a circular plastics economy. It shows that,
although the production, use and trade
of plastics continue to grow, significant
differences exist between Europe and
other regions of the world. Furthermore,
it explains the environmental and climate
impacts that occur across the life cycle of
plastics, including the leakage of plastics
into natural environments and the growing
demand for oil and emissions of greenhouse
gases. Finally, it shows that an increasing
number of EU initiatives are already in
place to address some of these issues,
but that more coordination and scaling up
is needed. Three pathways (smarter use;
increased circularity; and use of renewable
raw materials and decarbonisation) are
discussed, which together can help ensure
the continued longer term move towards a
sustainable and circular plastics system.

                                                   © iStock.com/eamanver   7
8 © Pixabay

About plastics and the
circular economy
Plastics are a large family of different materials, each with its own unique characteristics,
properties and applications. To address the environmental and climate challenges
associated with the production, use and disposal of these various types of plastics, a
circular economy offers a promising strategy for a more sustainable plastics system in
which materials and products never become waste.

Plastics: one name, many types                     A more circular
                                                   plastics economy
Plastics are composed of polymers (large
molecules comprising many repeated                 A more circular plastics economy seeks to
subunits called monomers) combined with            minimise the need for virgin material and
chemical additives. A common feature of            energy in the production of plastics while
plastics is that, depending on which chemical      ensuring that environmental pressures
additives are used, they can be easily             linked to resource extraction, production,
turned into many different forms during            consumption and waste are reduced. By
production. Chemical additives may, for            improving design, adopting higher quality
instance, improve the flexibility of plastics or   plastics, and encouraging and enabling
reduce their flammability.                         reuse, repair, remanufacturing and
                                                   recycling, a circular plastics economy aims
Despite their distinct composition, all plastics   to retain the value and utility of products
are based on carbon. Whereas fossil‑based          within the economy for as long as possible
plastics use carbon derived from oil and           to ensure that plastics never become waste
natural gas (petrochemicals), bio-based            (EEA, 2016; Ellen MacArthur Foundation,
plastics use carbon derived from renewable         2016). This is as opposed to the current
materials, such as agricultural products,          linear system of plastic production and
cellulose and even carbon dioxide (CO2).           use (dominated by low-value, low-cost and
Plastics, whether derived from oil or sugar,       short-life plastics) in which all phases of
for example, can have identical properties.        the value chain consume finite resources
                                                   and cause environmental impacts. Figure 2
Plastics can also be divided into different        shows the current challenges in achieving
types according to what they are made              a shift from a linear plastics economy to a
of (Figure 1), whether they are natural or         circular plastics economy.
synthetic, whether they can be remoulded or
not, and how they can be recycled without
causing contamination.

                                                                                                 9
Figure 1. Seven common types of plastics, with symbols and applications

     Types of plastics                       Symbol    Applications

     Polyethylene terephthalate (PET)          1       Beverage bottles, medicine jars, rope,
                                                       clothing and carpet fibre

                                                       Containers for milk, motor oil,
     High-density polyethylene (HDPE)          2       shampoos and conditioners, soap bottles,
                                                       detergents and bleaches

     Polyvinyl chloride (PVC)                  3       All kinds of pipes and tiles

                                                       Cling-film, sandwich bags, squeezable
     Low-density polyethylene (LDPE)           4       bottles and plastic grocery bags

                                                       Lunch boxes, margarine containers,
     Polypropylene (PP)                        5       yogurt pots, syrup bottles, prescription
                                                       bottles, plastic bottle caps and plastic cups

                                                       Disposable coffee cups, plastic food boxes,
     Polystyrene (PS)                          6       plastic cutlery and packing foam

     Polyethylene (PE)
     Acrylonitrile butadiene styrene (ABS)
     Polyamide (PA) or nylons
                                               7       Baby bottles, compact discs and medical
                                                       storage containers
     Polybutylene terephthalate (PBT)

     Source:   IVL and EEA.

10
Figure 2. Challenges in shifting from a linear to a circular plastics system
Producing plastics requires ’additives’ to be mixed in,
often making the material more hazardous
Most plastics are designed Plastics are largely used
to be used once only for short-lived products
(limited recyclability)
PRODUCTION
AND
DISTRIBUTION
TE, REFUR
IBU BI
STR S
ECO-DESIGN I
H,
D
RE
RE
, REPAIR,
MAN FACTUR
U
T ec h n ic a
B io lo gi
The share of recycled CONSUMPTION
USE
plastics in new products AND STOCK
is very low
RE
c al
Leakage to the environment,
l ma
E
ma
high persistence,
ter
te
ri a
hazardous substances
ial
ls
s
WASTE
MATERIALS
EMISSIONS
Plastics are mainly
based on fossil fuels Very low recycling rates,
downcycling prevails
Minimise
EXTRACTION AND IMPORT OF NATURAL INCINERATION LANDFILL
RESOURCES, INCLUDING ENERGY CARRIERS
Source: Adapted from EEA (2019b).
11Plastics and COVID-19
The coronavirus disease 2019 (COVID-19)
pandemic has caused significant changes in
the production, consumption and wastage
of plastics.
The pandemic led to a sudden surge in
global demand for personal protective
equipment, such as masks, gloves, gowns
and bottled hand sanitiser. During early
efforts to stop the spread of the virus, the
World Health Organization estimated that
89 million medical masks per month were
required globally, together with 76 million
examination gloves and 1.6 million sets of
goggles (WHO, 2020).
As a result of lockdown measures across
most of Europe, coupled with stringent
hygiene requirements, COVID-19 has had
a significant effect on the consumption of
single-use plastic packaging and products
such as plastic cutlery. As most restaurants
in Europe were closed for on-site dining,
many shifted to offering takeaway and
delivery services using single-use plastic
containers. Several large coffee retailers
stopped allowing customers to bring
refillable containers, using disposable cups
in their place. Meanwhile, online shopping
outlets have seen a surge in demand, with
many products packed in single-use plastic.
12 © Juan Miguel, REDISCOVER Nature/EEAAlthough disposable plastic products have In addition to the direct effects stemming
played an important role in preventing the from increased demand for single-use
spread of COVID-19, the upsurge in demand plastics, other factors related to the pandemic
for these items may challenge EU efforts in are important to note. Reduced economic
the shorter term to curb plastic pollution activity has seen sharp falls in global oil
and move towards a more sustainable and prices. In turn, this has made it significantly
circular plastics system. The production, cheaper for manufacturers to produce plastic
consumption and disposal of additional goods from virgin, fossil-based materials
single-use plastics will have led to greater than to use recycled plastic materials. The
impacts on the environment and climate economic viability of the European and global
than otherwise, such as increased air plastics recycling market is presently under
pollution and greenhouse gas emissions, significant pressure. Lower market demand
waste generation and the risk of littering. for recycled plastics has also complicated the
In cases where the cleanliness of multiple efforts of many of Europe’s municipalities to
use products cannot be guaranteed, single manage their waste practices sustainably,
use products may be preferred, but without and less desirable waste disposal options
undermining or delaying the objectives and are being used for significant quantities of
rules of the Single Use Plastics Directive. plastic waste.
1314 © iStock.com/curtoicurto
The consumption, production
and trade of plastics
With an exponential increase in the production and consumption of these versatile and
cheap materials ever since the 1950s, plastics have become an integral part of modern
society. However, significant differences in the demand for, production of and trade in
plastics exist between Europe and other regions of the world.

Plastic consumption and use                      The three largest end-use plastic markets
                                                 are (1) packaging, (2) building and
Global plastic use has increased very            construction, and (3) the automotive
rapidly, from almost zero around 1950            industry, accounting for almost 70 % of all
to 359 million tonnes worldwide in 2018.         plastics used in Europe. The single largest
Plastic use in Europe alone was 61.8 million     end-use market for plastics is packaging,
tonnes in 2018, but it seems to have             which constitutes almost 40 % of European
stabilised somewhat, while its use in other      demand. Although synthetic textile fibres
parts of the world is still increasing rapidly   are also made from plastics, they are not
(PlasticsEurope, 2019).                          included in the official statistics for plastics.

The global average use of plastics is 45 kg
per person per year. Western Europe
(Europe excluding central Europe and the
Commonwealth of Independent States) uses
three times as much — around 136 kg per
person (Plastics Insight, 2016).

                                                                                                     15
Box 1. Plastics for textiles
A significant proportion of plastics goes into synthetic fibres, such as polyester and nylon, used
for textiles. Plastic fibres are used for clothing, as well as furniture upholstery, carpets and other
applications. Although this is one of the largest end-use markets, textile fibres are usually not
included in the statistics for plastics. Synthetic fibres constitute the largest share of all textile fibres
used today. Almost two thirds of all textile fibres are synthetic, and one third are plant based (mainly
cotton), regenerated fibres (mainly viscose) or animal fibres (mainly wool).
Whereas the production of natural fibres has grown slowly over the past 30 years, the use of
synthetic fibres has grown rapidly. Over the past 25 years, synthetic fibres have become the
most common type of fibre for textiles, and production amounts to around 65 million tonnes per
year. Synthetic fibres are dominated by polyester, which is almost always the same as the plastic
which is known as polyethylene terephthalate (PET) when used for water bottles or packaging.
However, other plastics are also used for textiles — see Figure 3. More details on textiles and their
environmental impact can be found in a recent EEA briefing and underpinning report (EEA, 2019c;
ETC/WMGE, 2019).
Figure 3. Distribution of global textile fibre production by type
1%
6%
55 %
66 %
27 %
5%
4%
2%
Plant based Regenerated Animal Synthetic plastic fibres Polyester Polyamide Polypropylene Acrylic
Source: Based on data from Sandin et al. (2019).
16Box 2. Plastics for building and construction
The second largest application of plastics (after packaging) is also one of the most invisible. The
building and construction industry is responsible for 20 % of plastic use in Europe. Plastic pipes are
used to supply water and remove sewage, as well as for cables and other technical installations.
Plastic membranes are used as moisture-proof layers in walls and ceilings. Plastic window frames
and profiles have become popular, as they are energy efficient and do not require paint; plastic
insulation is used extensively. Plastic flooring is common, especially in public buildings (Agarwal and
Gupta, 2017).
The building and construction sector has special requirements (including for durability and strength)
for the plastics it uses. The most commonly used plastic is polyvinyl chloride (PVC), accounting
for 43 % of plastic used in the sector. In fact, 69 % of all PVC produced is used in building and
construction (Häkkinen et al., 2019).
Whereas plastics for packaging are designed and produced for a lifetime of weeks or months,
plastics intended for building and construction are designed for a lifetime of decades. This
introduces significant challenges when it comes to recycling. Since the plastics from buildings that
we want to recycle today are often 30-50 years old, they contain substances that are no longer
permitted. This means that new plastic products must be designed today to be recyclable in
30-50 years’ time.
Plastic water and sewage pipes used in building and construction © Pixabay
1718 © Pexels
Production of plastics                                  plastics production around the world has
                                                        changed considerably in that time, as
With its numerous uses and growing supply               shown in Figure 4. Although production in
and demand since the 1950s, the plastic sector          the 28 EU Member States as of 1 July 2013
has become a very large industry. It employs            (EU‑28), and in Norway and Switzerland,
over 1.6 million people in Europe — including           has only increased by about 1.2 % per year,
in raw material producers, plastic converters,          production elsewhere has grown, leading to
recyclers and machinery manufacturers — and             a falling market share for European plastics
had an annual turnover in 2018 of EUR 360               production from about 24 % to 17 %. The
billion (PlasticsEurope, 2019).                         growth has primarily been in China, which
                                                        has doubled its share of the global market
Global production of plastics has been                  from 15 % to 30 %. North America has also
growing at an average rate of 4.6 % per                 lost some of its market share, but less so than
year over the past decade (PlasticsEurope,              Europe because of recent US investments in
2019). The geographical distribution of                 production based on shale gas.

Figure 4. Share of global plastics production in regions with the largest output

Percentage
35

30

25

20

15

10

 5

 0
         2009     2010      2011     2012      2013           2014         2015          2016       2017   2018
                            Europe     NAFTA          China          Rest of Asia (excluding CIS)

Note:   Europe, EU28, Norway and Switzerland; CIS, Commonwealth of Independent States;
        NAFTA, North American Free Trade Agreement.
Source: Based on data from Plastics Europe (2010-2019).

                                                                                                                  19
Figure 5. The value chain for plastics
Crude oil
Oil refining
Naphta
Cracking
Natural gas liquids
and processing
PRODUCTION
Monomers
Polymerisation
Polymers
(PE, PP...)
Compounding Plastics
Additives
Converting
USE
Plastic products
AFTER USE
Reuse, repair,
Recycling Landfill Incineration Leakage
remanufacture
Source: Adapted from Nielsen and Bauer (2019).
20Plastics and chemical production has seen in which oil refineries, steam crackers,
faster growth than other markets for oil in polymerisation units and other chemical
recent years, some of which are expected production facilities are co-located. Some
to decline as electric transport gains share of the world’s largest chemical clusters are
from fossil fuel-based propulsion. This has found in various parts of Europe, such as the
resulted in increased interest in plastics from areas around Rotterdam (the Netherlands),
oil companies, which are investing in plastics Düsseldorf (Germany), Antwerp (Belgium),
and chemicals firms, and production capacity. Lyon (France) and Cheshire (United
Kingdom) (Ketels, 2007).
The value chain for plastic is long and
complicated. As shown in Figure 5, crude oil In contrast, the downstream plastics
fractions, such as naphtha and natural gas industry, namely plastic compounders
liquids, are cracked to produce monomers (adding chemical additives) and converters
— the building block molecules for polymers. (converting into specific products), are
During the polymerisation stage, the mostly smaller firms distributed throughout
monomers are linked together to form larger Europe and other regions of the world.
molecules called polymers. The polymers are
then mixed with various chemical additives The plastics trade
that give the plastic its desired properties. This
is done during a process called compounding. Plastics are traded globally, and Europe
After compounding, the plastic material is imports and exports large amounts of both
used by a converter to produce the final primary and non-primary plastics every year.
plastic products, such as bottles, water Primary plastics are the plastic materials
pipes and interior panels for cars. Although themselves, such as pure polymer granulates
approximately one third of these products and compounded plastics. Non-primary
is collected for recycling in Europe once they plastics are plastic components for later
become waste, the majority is leaked into the assembly, such as car interior panels, and
environment, incinerated or landfilled. Only finished products, for example tubes and
a small fraction is circulated for reuse, repair bags, as well as products containing plastics,
and remanufacturing (PlasticsEurope, 2019). such as electronics, furniture and cars.
The production of primary plastics is The EU has a trade surplus in both primary
dominated by large multinationals in the and non-primary plastics, meaning that the
petrochemical industry. Many of them are value of the exports for both categories
subsidiaries to or partially owned by large is larger than the value of the imports, as
oil firms, some of which are controlled by shown in Figure 6. Europe had a positive
national governments. Production usually trade balance of EUR 15 billion in 2018
takes place in large industrial clusters (PlasticsEurope, 2019).
21Figure 6. EU imports and exports of primary and non-primary plastics,
2009‑2018 (EU‑28)
Trade value (USD billion)
35
30
25
20
15
10
5
0
2009 2010 2011 2012 2013 2014 2015 2016 2017 2018
Exports: primary plastics Exports: non-primary plastics
Imports: primary plastics Imports: non-primary plastics
Source: Based on data from UN Comtrade (2019a).
Map 1 shows the EU-28’s trade flows in plastic exports and approximately 65 % of
primary plastics with its most important imports in each category. The EU’s strongest
trade partners in 2018. The top five trade trade partner in terms of plastics is the
partners represent about 50 % of EU United States.
22Map 1. EU-28 exports and imports of primary plastics to and from the EU′s five largest
trade partners in 2018
Exports and imports of primary plastics to and from the EU’s five largest trade partners in 2018
Export flow (USD million) Import flow (USD million)
Total Total
2
0
8
7
3
2
2
6
7
7
9
3
85
07
69
80
01
44
42
64
54
15
94
72
1
2
3
3
4
15
1
1
2
3
4
13
Source: Based on data from UN Comtrade (2019a).
23Box 3. Polyethylene and its trade
Polyethylene (PE) is the most commonly used
plastic worldwide, especially for packaging
in the form of bottles or film, as well as for
pipes and cable insulation. About 100 million
tonnes of PE are produced every year.
A significant amount of PE is traded
worldwide. Saudi Arabia and the United
States are significantly larger exporters than
most others, and the EU countries Belgium,
Germany and the Netherlands are also
large exporters. China is by far the largest
importer, as the massive manufacturing
industry in China demands considerable
volumes of plastics. Of the EU countries,
Germany, Belgium, Italy and France are those
with the largest imports.
The trade in plastic waste
Following policy requirements to collect
certain waste streams separately as well as
demands for plastic waste for reuse and
recycling, more plastic waste became visible
and available during the 1990s, leading
to rapid growth in international trade in
plastic waste.
The EU-28 represents the largest source
of export of plastic waste, accounting for
around one third of all exports of plastic
waste from 1988 to 2016 (Brooks et al.,
2018). Most of this waste was previously
exported to China and Hong Kong, as can be
seen in Figure 7.
24 © Orhan Kartal, Sustainably Yours /EEAFigure 7. EU-28 plastic waste exports, 2002-2018
Total
736 908 tonnes Total
(2002) 1 720 807
tonnes
(2019)
2002 2003 2004 2005 2006 2007 2008 2009 2010 2011 2012 2013 2014 2015 2016 2017 2018 2019
China Hong Kong India Indonesia Malaysia Turkey Vietnam Other
2002 (tonnes) 136 310 440 736 44 575 1 176 3 223 579 232 110 074
2019 (tonnes) 23 690 272 999 102 511 121 707 404 659 409 843 44 182 341 211
Source: Based on data from UN Comtrade (2019b).
The quantities and patterns of exported in 2017. European plastic waste exports
plastic waste have shifted, following an have halved and at the same time been
initial temporary Chinese restriction in 2013 re‑routed to other countries in South East
and then new regulations in China banning Asia, such as Vietnam, Thailand and Malaysia
the import of non-industrial plastic waste — see Figure 8.
25Figure 8. EU-28 exports of plastic waste by receiving country, tonnes per month,
January 2015 - December 2019
Total
201 911 tonnes
(January 2015)
Total
126 569 tonnes
(December 2019)
Chinese plastic ban
2015 2016 2017 2018 2019 2020
China Hong Kong India Indonesia Malaysia Taiwan Thailand Turkey Vietnam Other
2015 (tonnes) 1 658 970 775 557 139 628 32 640 137 876 31 548 15 414 19 377 88 760 177 742
2019 (tonnes) 23 693 272 939 102 462 121 707 404 062 27 954 3 327 409 897 43 953 305 702
Source: Reproduced from EEA (2019d).
The export of plastic waste from the EU is In the longer term, it is an opportunity to
likely to decrease and possibly halt in the improve capacities for reusing and recycling
coming years. In the short term, this may plastic waste within the EU (EEA, 2019d).
lead to more landfilling and incineration.
26© Unsplash 27
28 Offshore oil rigs, pictured here in the North Sea, are used to extract oil © Pixabay
Environmental and climate impacts
of plastics
Awareness of plastic litter, including its effect on nature (especially the marine
environment) and human health, has risen rapidly in recent years. However, litter is
just one of the negative environmental impacts that occur throughout the life cycle of
plastics, as can be seen in Figure 9. All of these must be addressed to create a circular and
sustainable plastics economy. This chapter focuses on impacts occurring throughout the
resource extraction, production, consumption and end-of-life phases of plastics. The most
significant impacts from each phase are discussed below, recognising that many impacts
occur in all phases, but to a varying degree.

Impacts of extracting oil and gas                gas. Approximately half of the oil used for
resources for plastics                           plastic is feedstock locked into the plastic
                                                 products, whereas half is used as fuel
• If the production and use of plastics          in the plastic production process (Ellen
  continue to increase as projected, the         MacArthur Foundation, 2016).
  plastic industry will account for 20 % of
  global oil use by 2050, an increase from       If the use of plastics continues to grow as
  today’s 7 %.                                   expected, it is projected that the plastics
                                                 industry will account for 20 % of global
• During the extraction of oil and gas for       oil use by 2050, an increase from today’s
  plastic production, greenhouse gases           7 %. The growth rate of plastic production
  and multiple pollutants are emitted to         (3.5-3.8 % per year) is much faster than
  the air, and large volumes of waste water      the growth in demand for oil (0.5 %
  containing dispersed oil, hazardous            annually) (Ellen MacArthur Foundation,
  substances and other harmful chemicals         2016). Although the vast majority of oil
  are leaked into the environment.               is currently used for fuels, this share
                                                 is expected to decrease in the coming
Extraction of oil and gas                        years as cars and trucks are increasingly
                                                 electrified, leading to reduced demand for
The system of consumption and production         petrol and diesel in developed economies.
of plastics implies significant resource use,    The International Energy Agency projects
mainly of fossil fuels, which has implications   that plastics and other petrochemicals
for the environment and climate. Over            will be the largest driver of the growth in
99 % of plastics (CIEL, 2019) are produced       the demand for oil up to 2030 (OECD and
from fossil fuel resources, mainly oil and       IEA, 2018).

                                                                                                29
Figure 9. The environmental impacts across the life cycle of plastics
The life cycle of plastics
!
EXTRACTION PRODUCTION
• Use of oil and gas • Use of oil and gas
Environmental impacts
• Greenhouse gas • Greenhouse gas emissions and air pollutants
emissions and air
pollutants
• Oil spills
Source: EEA.
30Electrical and
electronic equipment
Vehicles
Textiles
Packaging
Building and
construction
USE AFTER USE
• Human exposure to • Litter on land and in oceans, seas and freshwater
toxic substances
• Greenhouse gas emissions from incineration
and landfill
31In the past decade, there has also been Shale gas extraction, in particular, is known
a global shift in the choice of feedstocks to have significant impacts on natural areas,
used to produce plastics. Whereas the as large areas are used and contaminated in
main feedstock historically was naphtha, a the process. US ethane exports have grown
product derived from oil refining, natural gas rapidly following the expansion of shale gas
liquids are increasingly being used. These production, and since 2016 a significant share
are lighter hydrocarbons, mainly ethane and of exports goes to Europe (US EIA, 2020). Thus,
propane, found in natural gas reserves in the EU is increasingly using environmentally
some regions such as the Middle East and damaging shale gas imported from the United
in shale gas reserves in the United States. States to produce plastics.
Box 4. US shale gas extraction affects European plastics production and use
Shale gas extraction in the United States, which uses hydraulic fracturing (‘fracking’; see Figure 10),
grew very quickly during the beginning of the 21st century. Shale gas production constituted only
1 % of US domestic natural gas production in 2000; however, in just 10 years the share increased
to 20 % (Stevens, 2012). The rapid growth in production led to an oversupply of gas on the North
American market. At the same time, technologies were developed for managing liquefied natural
gas to enable a global trade in gas, as there has been in oil for decades.
By making use of technologies similar to those developed for liquefied natural gas, a global market
for ethane has been established. Several European firms have signed contracts for US ethane, which
is being shipped across the Atlantic in large specialised ships. European production of plastics is
thus now relying on shale gas products from the United States.
Shale gas extraction and hydraulic fracturing continue to be contentious issues, as they use large
volumes of water and chemicals, while issues regarding leakage of potent greenhouse gases and
chemicals remain unanswered.
Greenhouse gas emissions and climate emissions are a result of the combustion of
change arising from oil and gas extraction natural gas in turbines and diesel in engines
to fulfil the energy demands of the drilling
Plastics cause greenhouse gas emissions, machinery and pump and compressor
mainly due to their current dependence operations (Norwegian Environment Agency,
on the fossil fuels oil and gas. Greenhouse 2020a). Large numbers of trucks emitting
gas emissions from plastics start with the greenhouse gases are also needed at the
extraction of oil and gas, because it requires well sites to transport water and waste
large amounts of energy. Greenhouse gas (CIEL, 2019).
32Figure 10. Shale gas extraction through hydraulic fracturing
WELL
SHALE Fissure
Water, sand
Gas flows out and chemicals
Water, sand and chemicals
injected into well
Gas flows out
SHALE
Hydraulic
fracturing
Fissures
Note: Horizontal holes are drilled in deep shale layers. Using high pressure water and chemicals,
fissures are opened in the shale so that gas is released and can be extracted.
Source: IVL.
In addition to emitting the most common As oil and gas fields get older, the greenhouse
greenhouse gas, CO2, the extraction of oil and gas emissions generally increase, as more
gas is also a significant emitter of methane. energy is needed to clean greater quantities
Methane emissions occur when natural gas of contaminated water or for injecting
moves through the system, from production more water into the bedrock (Norwegian
to distribution. Examples of activities that Environment Agency, 2020b). In some places,
may cause methane emissions are intentional onshore oil and gas extraction causes land
venting and unintentional leaks from disturbance and indirect greenhouse gas
pipelines and gas engines (US EPA, 2018). emissions, as forests and fields are removed
33to make way for oil fields, and consequently example, chemicals are needed when
no longer absorb greenhouse gases. Refining drilling to lubricate and cool the drilling bit
crude oil to oil products such as naphtha, (OSPAR, 2017). Although the concentrations
still the dominant route for plastics in the EU, of dispersed oil and hazardous substances
consumes large amounts of energy, as does are generally low in the produced water,
steam cracking (CIEL, 2019). the large amounts of water make the
quantities relevant. For example, produced
Pollution of air, water and land arising from water and shipping are the largest emitters
oil and gas extraction of oil into the North Sea. The amount of
produced water increases as the oil and gas
Oil and gas extraction for plastic production fields get older (Norwegian Environment
emits air pollutants, such as nitrogen Agency, 2020b).
oxides (NOx), sulphur oxides (SOx),
particular matter (PM), volatile organic The emissions of oil and toxic chemicals
compounds (VOCs), heavy metals, and a wide from produced water may have negative
range of chlorinated and other toxic organic impacts on sea animals, but the
chemicals (US EPA, 2016). The emissions are consequences at ecosystem level are
mainly a result of fuel combustion in gas not fully understood (Figure 11). Another
turbines and diesel engines that generate environmental risk is oil spill, as this may
energy for drilling operations, treatment of cause both acute and long-term effects on
the extracted oil and gas, and transport of life at sea. The installation and removal of
oil and gas to reception stations. Flaring or oil platforms, as well as drilling operations,
venting excess gases when extracting oil and also affect the local environment, depending
gas likewise releases toxic chemicals to the on how sensitive the area in question is
atmosphere (CIEL, 2019). (Norwegian Environment Agency, 2020b).
Both onshore and offshore oil and gas Hydraulic fracturing, a technique to improve
extraction result in large amounts of waste the flow of the oil or gas from the well,
water coming from the reservoirs. This is further associated with risks such as
is called produced water, and it contains degrading groundwater and surface water
dispersed oil and hazardous substances quality due to waste fluid disposal, spills of
that occur naturally in the reservoir, such as chemicals and the reducing water availability
heavy metals, aromatic hydrocarbons, alkyl (USGS, 2020). Over 170 fracking chemicals
phenols and radionuclides. It also contains are known to cause health problems such as
added process chemicals, some of which cancer and damage to the immune system,
are considered harmful in terms of toxicity, especially for those living near fracking sites
bioaccumulation and biodegradation. For (Heinrich Böll Foundation, 2019).
34Figure 11. Emissions to air and water from an oil platform
Turbine exhaust
Flaring
Fuel exhaust
Vents
Waste
Spills
Sewage water
Cooling water Drains
Displacement water
Produced water
Cuttings piles
Source: Adapted from OSPAR (2017).
Impacts of plastic production • The production of plastics emits
substances such as toxic metals and
• Every year, the production of plastics organic compounds, which accumulate
in the EU is responsible for emitting in animals and plants and may negatively
13.4 million tonnes of CO2, which is about affect their health.
20 % of the chemical industry’s emissions
EU-wide.
35Figure 12. Global final energy demand and direct CO2 emissions by sector in 2017
Mtoe MtCO2
1 500 2 500
1 200 2 000
900 1 500
600 1 000
300 500
0 0
Chemicals Iron and steel Cement Pulp and Paper Aluminium
Final energy demand (Mtoe) Direct emissions (MtCO2)
Notes: Final energy demand for chemicals includes feedstock, and for iron and steel it includes energy
use in blast furnaces and coke ovens. Direct CO2 emissions includes energy and process
emissions in the industry sector; Mtoe, million tonnes of oil equivalent; MtCO2, million tonnes
of carbon dioxide.
Source: Reproduced from OECD and IEA (2018).
Greenhouse gas emissions and climate one third of the energy used for plastic
change arising from plastic production production, producing chemicals for plastics
has the second largest sectoral energy
Plastic production is the largest part of the demand in the world.
chemical sector, constituting about one third
of chemicals production worldwide and In Europe, data from the EEA Greenhouse
about one fifth in Europe (Zheng and Suh, Gas Inventory shows that annual
2019; EEA, 2020a). The chemicals sector is greenhouse gas emissions related to plastic
the production sector using the most energy production in the EU (i.e. the share of direct
in the world, ahead of the iron and steel, emissions from petroleum refineries and
cement, pulp and paper, and aluminium chemical manufacturing) amount to around
industries, as shown in Figure 12 (OECD and 13.4 million tonnes of CO2, which is about
IEA, 2018), and is the third largest source 20 % of the chemicals industry’s emissions
of industrial CO2 emissions. With about EU-wide (EEA, 2020a).
36Greenhouse gas emissions from plastics alteration known as eutrophication. When
production in the EU are, not surprisingly, nutrients increase in a water body, the balance
much higher when emissions over the whole across species changes, fostering increased
lifecycle are considered i.e. including direct algal growth. When the algae die, they are
and indirect emissions and upstream activities degraded in the water body, which causes
such as oil extraction and refining/cracking. a reduction in its oxygen concentration
In this different perspective, greenhouse gas and leads to a very significant decrease in
emissions related to the EU plastic value chain biodiversity (EEA, 2019a).
for resin production have been estimated to
be as high as 132 million tonnes CO2e in 2018 Impacts of plastic consumption,
(ETC/WMGE, forthcoming). Converting these littering and micro-plastics
polymers to plastic components and products
accounts for an additional 46 million tonnes • When using plastic products in their daily
(ETC/WMGE, 2020). lives, consumers may be exposed to
toxic substances through the migration
Pollution of air and water arising from of particles, additives, impurities and
plastic production degraded chemicals.
NOx and SOx are emitted by the plastic • Abundance of plastic litter on land and
polymer manufacturing sector in significant in oceans, seas and freshwater is one of
quantities and are well known for their effect the most visible aspects of the increasing
as acidifying substances. Acidification may lead production and use of plastics. 40 % of
to the spread of toxic metals, as it increases plastic items found in European freshwater
the mobility of the metals in the environment. environments are consumer-related
Toxic metals such as lead, cadmium and products, such as bottles, food wrappers
mercury, as well as toxic organic compounds, and cigarette butts.
are also emitted to air and water during plastic
production. These may accumulate in animals • Plastic pollution in the environment can
and plants and are of concern, mainly because have detrimental effects on wildlife,
of their undermining health effects. They also primarily because of entanglement, injuries
persist in the trophic webs, leading to higher and ingestion. More research is needed into
concentrations further up the food chain the effects of micro-plastics, including on
(EEA, 2019a). VOCs in combination with NOx marine biota and human health.
also participate in the atmosphere’s chemistry,
leading to various environmental phenomena, Chemical toxicity to humans and nature
the generation of toxic tropospheric ozone arising from plastic use
being the most important.
Many negative health impacts including
Plastics production and waste is also reproductive disorders, behavioural disorders,
responsible for increased levels of nutrients diabetes and obesity, asthma and cancers
in water systems, which lead to an ecosystem have been associated to exposure to
37various chemicals used in plastics, such as substance in the plastic, the surface area of
flame retardants, endocrine disrupters and the product, and how and where the plastic
phthalates (HEAL, 2020). product is used, for example the temperature
(ECHA, 2019). Additives are usually not
Consumers and users can be exposed to chemically bound to the plastic structure, so
toxicity through the migration of particles, they can potentially migrate/leach from the
additives, impurities and degraded chemicals, plastic product into a medium in contact with
mostly during the first use but also during the product or migrate through the plastic to
subsequent uses of plastics. Only limited its surface (Hahladakis et al., 2018).
risk assessments have been performed
for chemicals authorised to be used in, for In nature, environmental factors such
example, food contact plastics, and several as temperature and the availability of
materials used in multilayer plastic materials microorganisms influence the leaching of
do not have specific legislation that requires chemical substances from plastics (Teuten
authorisation before use. et al., 2009) including resin pellets, fragments
and microscopic plastic fragments,
For single-use plastics, exposure is typically contain organic contaminants, including
higher than for repeated-use plastics. This is polychlorinated biphenyls (PCBs. In addition,
because it is mainly the chemicals that are not there are considerable differences between
bound to the plastic that migrate, and most of macro- and micro-plastics. Macro-plastics
the migration happens the first time the plastic are of key concern for marine animals that
is used. may, for example, get tangled in fishing
nets or eat plastics. There is less known
Although additives play an important role about the risks of micro- and nano-plastics
in improving the properties of plastics, we to humans, animals and the environment.
know that chemicals used as additives can Chemicals from plastics may enter animals
migrate from macro- and micro-plastics directly, if they mistake plastics for food,
into the environment and lead to human or indirectly via the food chain. This may
exposure (Hahladakis et al., 2018). For many result in a higher chemical concentration
of the substances used as additives, there than that of the source and is common in
are still uncertainties about their hazardous animals higher up the food pyramid, such as
properties and risks to human health and the birds and marine mammals. At lower trophic
environment (ECHA, 2019). levels, for example plankton, fish, bivalves
and molluscs, the major intake of chemicals
The migration of chemicals into nature and occurs passively via the surface of the
humans depends on a number of factors: the body or via respiratory organs by diffusion
type of substance, the concentration of the (Blastic, 2018).
38Plastics in the environment
Plastics end up everywhere in the
environment: in air, soil, freshwater, seas,
biota and some components of our food.
Plastics of various sizes are released into
the environment, from large plastic items
such as plastic bags and bottles to smaller
particles found in textiles and cosmetics
or released from car tyres. It has been
shown that that plastic waste enters the
ocean at a rate of 11 million metric tons per
year, harming mariner life and damaging
habitats (The Pew Charitable Trusts and
SYSTEMIQ, 2020). Over 200.000 tonnes of
plastic waste enters the Mediterranean Sea
every year, a number that is expected to
double if significant measures are not taken
(IUCN, 2020).
Larger plastic items in the environment may
fragment and degrade into micro-plastics.
Recent research estimates that at least
14.4 million tonnes of microplastics have
found its way to the bottom of the world’s
oceans (Barrett et al., 2020). The extent and
speed of this fragmentation depends on the
type of plastic and the exposure to sunlight,
high temperatures, wind and waves. The
majority of plastics are not biodegradable in
marine conditions but will gradually break
down into micro- and nano-plastics through
wear and tear and other mechanical action
(Velis et al., 2017). In general, knowledge of
ecological and health risk of microplastic
is surrounded by considerable uncertainly
(EC, 2019b).
Plastics on a beach/ © Pixabay 39Box 5. Different sizes of plastics in the environment
Plastics in the environment are usually categorised into macro-plastic, micro-plastic
and nano‑plastic.
Macro-plastics are generally referred to as plastic particles larger than 5 mm. Particles smaller
than 5 mm are called micro-plastics, and plastics smaller than 0.1 mm are called nano-plastics.
Knowledge about the fate, risks and effects of nano-plastics in the environment is very limited
(SAPEA, 2019).
Micro- and nano-plastics can be released either as so-called primary micro-plastics or as secondary
micro-plastics. Primary micro-plastics are emitted to the environment in their original shape,
for example from washing textiles and as microbeads in cosmetics and personal care products.
Micro‑plastics can also originate from the fragmentation of macro-plastics (secondary micro‑plastics;
see Figure 13), for example from the wear and tear of plastic litter or abrasion of car tyres
(UNEP, 2018).
Figure 13. The breakdown of a plastic bottle into smaller fragments, eventually
ending up as micro- and nano-plastics
Source: IVL.
40Figure 14. Sources and pathways of plastics in the environment
There are many sources of plastics in the environment, including:
Synthetic fibres Sanitary items Abrasion of vehicle tyres, Release from artificial
from laundering textiles and cosmetic products plastic coatings and paints turfs and playgrounds
Fishing and shipping activities Pellet loss from plastic Uncontrolled dumping, Escape of plastics from
production facilities fly-tipping and littering mismanaged waste activities
Plastics spread to the environment through, for example:
Littering Sewage effluents from Storm water run-off Snow disposal Atmospheric deposition
waste water treatment
plants and the run-off
of sewage sludge
Source: EEA.
41The majority of plastics found in the marine
environment in Europe and elsewhere are
carried there by rivers. Litter studies in
European freshwater environments show
that around 40 % of the identifiable plastic
litter items were consumer-related products,
mostly consisting of bottles, food wrappers
and cigarette butts (Earthwatch Institute,
2019). Results from modelling show that
most micro-plastics exported by rivers to
seas in Europe are synthetic polymers from
car tyres and plastic-based textiles from
laundry (SAPEA, 2019).
The effects of plastics in the environment
are not fully known. Risks are associated
with the size of plastics. Macro-plastics
such as plastic bags, lost fishing gear and
ropes may have detrimental effects on
animals because of entanglement, injuries
or ingestion. To some species, plastics
resemble their ordinary feeding sources, for
example for sea turtles transparent plastic
bags look similar to jellyfish (UNEP, 2018).
42 Seabird nesting on fishing nets ©PixabayBox 7. Marine Litter Watch
Marine Litter Watch is an ongoing EEA initiative launched in 2014 to better understand the
composition, movement and origin of beach litter and to combat plastic litter. By using the Marine
Litter Watch app, communities and the public can organise beach clean-ups and record the litter
they find on beaches using specific guidelines. The data are used to increase the knowledge base
on beach litter and support policymaking under the Marine Strategy Framework Directive and
the Single Use Plastics Directive. The top 10 litter items reported to Marine Litter Watch between
January 2014 and October 2020 are displayed in Figure 15 below. The percentages are calculated
based on the total number of items collected. Together, these items represent 60 % of the litter
reported (EEA, 2020c).
Figure 15. Top 10 items reported to Marine Litter Watch
(January 2014 and October 2020)
24 % 10 % 5% 4% 4%
CIGARETTE BUTTS PLASTIC PIECES POLYSTYRENE PIECES SHOPPING BAGS PLASTIC CAPS/LIDS
AND FILTERS 2.5 > < 50 cm 2.5 cm > < 50 cm including pieces DRINKS
4% 3% 3% 3% 2%
COTTON BUD CRISP PACKETS/ GLASS OR CERAMIC STRING AND CORD FOOD CONTAINERS
STICKS SWEET WRAPPERS FRAGMENTS > 2.5 cm diameter < 1 cm ≤ 0.5 l
Source: EEA (2020c).
43Many marine animal species have been and standardised methods. At present,
documented as being entangled in and the impacts of micro- and nano-plastic
injured by plastics, but the consequences contamination of food and beverages is
on a population level are not fully known. largely unknown (Toussaint et al., 2019).
The animals most often studied include
seabirds, turtles and mammals, but fish Impacts of plastic waste
and invertebrates are receiving increasing management
attention. Smaller plastic items may be
mistaken for food or enter organisms • Estimates suggest that 20-30 million
through filtration (e.g. in fish and mussels). tonnes of plastic waste is incinerated
All species of marine turtles, almost 60 % of in Europe annually, leading to CO2
whale species, 36 % of seal species and 40 % emissions of around 50-80 million tonnes
of seabird species have been documented as per year.
ingesting plastics (Kuhn et al., 2015).
• Of the 29 million tonnes of plastic waste
There is some knowledge of the collected in Europe in 2018, 32 % was
concentrations of micro-plastics in ocean collected for recycling. Recycling rather
surface waters and freshwaters, but similar than incinerating plastics can reduce
information regarding air and soil is very emissions by 1.1-3.0 tonnes of CO2
limited. However, there are indications that equivalent (CO2e).
microplastics in air, freshwater and soil are
in need to be addressed similarly to marine In addition to the growth in production,
microplastics (SAPEA, 2019). Micro-plastics use and consumption of plastics — and
have a negative effect on food consumption, the resulting direct environmental and
growth, reproduction and survival. High climate impacts — the generation of plastic
levels of exposure to micro-plastics may waste is also an issue, as it constitutes
cause inflammation and stress, as well as a considerable problem for waste
blockage of the gastrointestinal or respiratory management systems globally. Plastics
tracts, reducing energy uptake or respiration. today constitute a significant part of the
However, the extent to which this is happening total waste generated in Europe.
in nature is not known. The concentrations
of micro-plastics used in laboratory studies Humans have already produced a
are much higher than those found in the cumulative global total of over 8 billion
environment (SAPEA, 2019). tonnes of plastics since 1950, of which
6.3 billion tonnes became waste in 2015
The intake of micro- and nano-plastics (Figure 16). It has been projected that
through food and drink could pose a threat over 25 billion tonnes of plastic could be
to human health. It is, however, not possible generated by 2050, much of which could
to assess human exposure to micro- and end in landfills or the natural environment
nano-plastics because of a lack of validated (Geyer et al., 2017).
44Figure 16. Cumulative global plastic waste generation and disposal
Million metric tonnes
25 000
20 000
15 000
10 000
5 000
0
1950 1960 1970 1980 1990 2000 2010 2020 2030 2040 2050
Primary waste generated All waste discarded All waste incinerated All waste recycled
Source: Adapted from Geyer et al. (2017).
In 2018, 29 million tonnes of plastic waste in north-western Europe have banned or
was collected in Europe (EU-28, Norway and restricted landfilling and thus incinerate
Switzerland), of which it has been estimated the majority of plastic waste generated,
that 32 % was sent for recycling, 43 % landfilling is still the dominant treatment
was incinerated and 25 % was landfilled strategy for plastic waste in southern
(PlasticsEurope, 2019). Whereas countries Europe, as shown in Figure 17.
45Figure 17. Rates of recycling, energy recovery and landfill for post-consumer plastic
waste in 2018 (EU-28, Norway and Switzerland)
Switzerland
Austria
Netherlands
Germany
Luxembourg Countries with
Sweden landfill restriction
implemented
Finland
Belgium
Denmark
Norway
Estonia
Ireland
United Kingdom
Slovenia
France
Italy
Portugal
Spain
Lithuania
Czechia
Poland
Slovakia
Hungary
Romania
Latvia
Croatia
Bulgaria
Cyprus
Greece
Malta
0 20 40 60 80 100 Percentage
Recycling Energy recovery Landfill
Note: The underlying data supporting this graph was not made available to the EEA.
Source: Reproduced from PlasticsEurope (2019).
Whether used for a short or long period, production of plastics for different end-use
plastic products eventually end up as waste. segments and the plastic waste generated
Plastic packaging is usually discarded in each of these. End-use segments in which
within days or weeks, whereas plastic car products have short lifetimes, such as
parts last for years, and water pipes for packaging and textiles, generate the majority
several decades. Figure 18 shows the global of plastic waste.
46Figure 18. Global plastic production and waste generation by end-use market in 2015
Mt
160
140
120
100
80
60
40
20
0
Packaging Transport Building and Electrical and Consumer Industrial Textiles Other
construction electronic products machinery
Production Waste generation
Source: Based on data from Geyer et al. (2017).
At the end of their lifetime, plastics are amount of plastics from virgin fossil fuel
recycled, incinerated or landfilled (if not feedstock (Ellen MacArthur Foundation,
leaked into the environment). Of these 2016). At the same time, recycling requires
options, recycling is far more beneficial waste to be collected, sorted and processed,
to the environment and climate than which in turn requires fuel consumption
incineration or landfilling, the last option (OECD and IEA, 2018).
being the least favourable. Overall, waste
prevention is the most preferable option Collection for recycling of plastic waste range
(EEA, 2019b). from about 20 % in Bulgaria and Finland,
to more than 40 % in Spain and Norway.
Impacts of recycling plastic waste Although many types of plastics can be
recycled in principle, they are most often
The recycling of plastics reduces raw not because of the complexity involved,
material extraction and the production including issues such as the sorting of
of virgin plastics and therefore leads many different types of plastics and the
to reduced greenhouse gas emissions. combination of various plastics in one plastic
Recycling instead of incinerating plastics material. As a result, a large share of the
could reduce emissions by 1.1–3.0 tonnes of plastics that are collected for recycling are
CO2e, compared with producing the same later discarded in the recycling process.
47You can also read