Greenhouse gas emissions and natural capital implications of plastics (including biobased plastics)
←
→
Page content transcription
If your browser does not render page correctly, please read the page content below

Eionet Report – ETC/WMGE 2021/3

                                                                Greenhouse gas emissions
                                                          and natural capital implications
                                                  of plastics (including biobased plastics)

                                                                                                                    May 2021

Authors:
ETC/WMGE experts: Ive Vanderreydt (VITO), Tom Rommens (VITO),
                  Anna Tenhunen (VTT)
EEA experts:      Lars Fogh Mortensen, Ida Tange

 ETC/WMGE consortium partners: Flemish Institute for Technological Research (VITO),
 CENIA, Collaborating Centre on Sustainable Consumption and Production (CSCP), Research
 Institute on Sustainable Economic Growth of National Research Council (IRCrES), The Public
 Waste Agency of Flanders (OVAM), Sustainability, Environmental Economics and Dynamic
 Studies (SEEDS), VTT Technical Research Centre of Finland, Banson Editorial and
 Communications (BEC), The Wuppertal Institute for Climate, Environment, Energy (WI),
 Slovak Environment Agency (SEA)
Cover design; ETC/WMGE
Cover photo © iStock photo
Layout: ETC/WMGE

Legal notice
The contents of this publication do not necessarily reflect the official opinions of the European Commission or other institutions
of the European Union. Neither the European Environment Agency, the European Topic Centre on Waste and Materials in a Green
Economy nor any person or company acting on behalf of the Agency or the Topic Centre is responsible for the use that may be
made of the information contained in this report.

Copyright notice
© European Topic Centre Waste and Materials in a Green Economy (2021)
Reproduction is authorized provided the source is acknowledged.

More information on the European Union is available on the Internet (http://europa.eu).

European Topic Centre on Waste and Materials
in a Green Economy
Boeretang 200
BE-2400 Mol
Tel.: +14 33 59 83
Web: wmge.eionet.europa.eu
Email: etcwmge@vito.be
Contents
Acknowledgements ....................................................................................................................................... 1
Summary........................................................................................................................................................ 1
1      Introduction: plastics in a circular economy ......................................................................................... 3
    1.1.       Background .................................................................................................................................... 3
    1.2.       Plastics and the environment in a circular economy .................................................................... 3
    1.3.       Focus on greenhouse gas and natural capital implications of plastics (including biobased plastics)
               3
    1.4.       Goal and scope .............................................................................................................................. 4
    1.5.       Limitations of the report ............................................................................................................... 5
2      EU plastics value chain and greenhouse gas emissions ........................................................................ 6
    Summary and discussion ........................................................................................................................... 6
    2.1.       Introduction ................................................................................................................................... 7
    2.2.       Release of greenhouse gasses along the EU plastics value chain ................................................. 9
       2.2.1          Resource extraction............................................................................................................. 14
       2.2.2          Refining and polymer production........................................................................................ 15
       2.2.3          Conversion ........................................................................................................................... 19
       2.2.4          Use ....................................................................................................................................... 20
       2.2.5          End of life – waste management ......................................................................................... 22
       2.2.6          Leakage of plastic waste to the environment/plastic waste degradation .......................... 25
3      Biobased plastics value chain and greenhouse gas emissions ............................................................ 27
    Summary and discussion ......................................................................................................................... 27
    3.1.       Introduction ................................................................................................................................. 29
    3.2.       Release of greenhouse gas emission along the biobased plastics value chain ........................... 34
       3.2.1          Feedstock production .......................................................................................................... 35
       3.2.2          Refining, polymer production and conversion .................................................................... 37
       3.2.3          Use phase ............................................................................................................................ 40
       3.2.4          End of life - waste management.......................................................................................... 41
4      Plastics and natural capital .................................................................................................................. 45
    Summary and discussion ......................................................................................................................... 45
    4.1.       Introduction ................................................................................................................................. 45
    4.2.       Depletion of fossil resources (Extraction) ................................................................................... 46
    4.3.       Soil, water and groundwater pollution and water depletion...................................................... 47
    4.4.       Direct and indirect air pollution and emissions........................................................................... 49
    4.5.       Land use and soil erosion ............................................................................................................ 49
    4.6.       Loss of biodiversity ...................................................................................................................... 51
5      Conclusions .......................................................................................................................................... 53
6      References ........................................................................................................................................... 54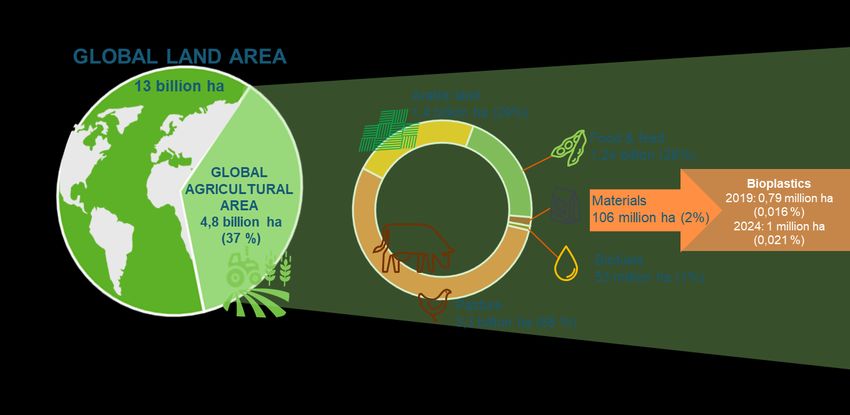
Acknowledgements
The report has been produced within the task on ‘Greenhouse gases and natural capital implications of
plastics and bioplastics’ of the 2020 ETC/WMGE work programme. Lars Mortensen (EEA) has been the
project leader and Ive Vanderreydt (VITO) has been the task leader, supported by main authors Tom
Rommens (VITO) and Anna Tenhunen (VTT).

The authors are grateful to the following experts and organisations for their comments that substantially
improved the quality of the report: Ida Tange (EEA) and Henning Wilts (Wuppertal Institut). Bart Ullstein
(BEC) provided careful editing of the report.

The authors are grateful to the following experts and organisations for their comments that substantially
improved the quality of the report: Maarten Dubois (OECD), Frederic Bauer (Lund University), Tobias
Nielsen (IVL), Małgorzata Grodzińska-Jurczak (Jagiellonian University), Werner Bosmans (European
Commission, DG ENV), Silvia Forni (European Commission, DG ENV), Serenella Sala (European Commission,
JRC), Davide Tonini (European Commission, JRC), Ricardo Fernandez (EEA) and Ioannis Bakas (EEA).

Acronyms

ABS        Acrylonitril-butadiene-styrene
APC        Aliphatic polycarbonate
BBP        Benzylbutylphtalate
BPA        Bisphenol A
BTX        Benzene-toluene-xylene
C          Carbon
CA         Cellulose acetate
CEPI       Confederation of European Paper Industries
CI         Carbon intensity
CIS        Commonwealth of Independent States: Armenia, Azerbaijan, Belarus,
           Georgia, Kazakhstan, Kyrgyzstan, Moldova, Russia, Tajikistan,
           Turkmenistan, Ukraine and Uzbekistan
CO2        Carbon dioxide
CO2 eq     Carbon dioxide equivalent
DBDPE      Decabromodiphenylethane
DBP        Dibutyl phosphate
DEHP       Di(2-ethylhexyl) phthalate
DMT        Dimethyl terephthalate
DIDP       Diisodecyl phthalate
DINP       Diisononyl phthalate
DNOP       Di-n-octylphthalate
DMT        Dimethyl terephthalate
DPET       Direct polyethylene terephthalate
EEA        European Environment Agency
EMF        Ellen McArthur Foundation
EoL        End of life
EPDM       Ethylene propylene diene monomer rubber
EPRTR      European Pollutant Release and Transfer Register
EPS        Expanded polystyrene
EU         European Union
g          gram
GHG        Greenhouse gas
Gt         Gigatonne (109 tonnes)
GWP        Global warming potential
HD PE    High-density polyethylene
HWP      Harvested wood products
IEA      International Energy Agency
IPCC     Intergovernmental Panel on Climate Change
IPPC     Integrated Pollution Prevention and Control
JRC      Joint Research Centre
Kg       Kilogramme
kt       Kilotonne (1,000 tonnes)
LCA      Lifecycle assessment
LCT      Lifecycle thinking
LD PE    Low-density polyethylene
LLD PE   Linear low-density polyethylene
LPG      Liquefied petroleum gas
MD PE    Medium-density polyethylene
MEK      Methyl ethyl ketone
MJ       Megajoule (106 joules)
MTA      Methanol to aromatics
MTBE     Methyl tert-butyl ether
MTO      Methanol to olefins
Mt       Million tonnes
MTP      Methanol to propylene
NGL      Natural gas liquids
NOx      Nitrogen oxides
OBDE     Octabromodiphenyl ether
OECD     Organisation for Economic Co-operation and Development
PA       Polyamide
PBAT     Polybutyrate adipate terephthalate
PBS      Polybutylene succinate
PBT      Polybutylene terephthalate
PBAT     Polybutylene adipate-co- terephthalate
PC       Polycarbonate
PCL      Polycaprolactone
PE       Polyethylene
PEBDE    Pentabromodiphenyl ether
PEF      Polyethylene furanoate
PET      Polyethylene terephthalate
PHA           Polyhydroxy alkanoates
PHB           Polyhydroxy butyrate
PHBV          Poly(3-hydroxybutyrate-co-3-hydroxyvalerate)
Phen. resin   Phenol formaldehyde resins
PLA           Polylactic acid
PM            Particulate matter
POP           Persistent organic pollutants
PP            Polypropylene
PRTR          Pollutant Release and Transfer Register
PTT           Polytrimethylene terephthalate
PS            Polystyrene
PUR           Polyurethane
PVC           Polyvinylchloride
RAS           Asia and the Pacific
SBR           Styrene-butadiene
SOx           Sulphur oxide
SUP           Single Use Plastics
t             Tonne
TPS           Thermoplastic starch
TRL           Technology readiness level
UNEP          United Nations Environment Programme
UNFCCC        United Nations Framework Convention on Climate Change
UF            Urea-formaldehyde
VCM           Vinyl chloride
VOC           Volatile organic compound
WEEE          Waste electrical and electronic equipment
Summary

Greenhouse gases (GHGs) are released throughout the lifecycle of plastics, from the extraction of their
base resources, through the refining and processing of these into plastics and the conversion of plastics
into products and components, to the products’ use phase and then their end-of-life pathway, including
incineration.

On top of climate impact, plastics also impact the environment and the world’s natural capital in various
and indirect ways, by consuming the natural resources stock and negatively impacting the world’s
ecosystems, such as soil, land, air, water and living organisms.

In light of the current rising trends in the consumption and production of plastics, systematic and
integrated perspective on plastics and the carbon cycle is needed. Against this background, finding a way
to make plastics compatible with a low-carbon economy is an urgent challenge and various opportunities
have been identified to reduce the carbon intensity of the plastics system. One of the key challenges,
however, seems to be the development of a knowledge base of the unintended side effects of how plastics
and plastic products are managed.

To reinforce the understanding of the links between (the circularity of) plastics and climate change and to
provide insights to inform future discussions on the potential (and limitations) of circular plastics and the
corresponding impacts on climate and natural capital, the European plastic value chain, from the
extraction of raw materials through production and use to the end-of-life waste treatment of plastics, was
analysed from a lifecycle perspective. The focus of this analysis is the impact of all steps in the total plastics
value chain across Europe, including feedstock production, refining, cracking, compounding,
manufacturing and waste management. Because of the diversity of plastics and the number of applications
in which they are used, the impacts of the use phase are not included.

The total greenhouse gas emissions caused by the plastics value chain, for the plastics volume converted
in the European Union (EU) in 2018, is estimated at 208 million tonnes (Mt) of carbon dioxide equivalent
(CO2-eq). The majority, 63 %, of the greenhouse gas emissions in the EU plastics value chain are caused by
its production. Converting these polymers into products accounts for 22 %, and plastic waste treatment at
end-of-life adds another 15 %, mainly due to incineration.

There is considerable variability among specific plastics in greenhouse gas emissions during their lifetimes,
depending on the polymer type and production technique. Overall, however, when 1 kilogramme (kg)
virgin fossil-based plastic product comes onto the market, it has already caused at least 2.9 kg of
greenhouse gas emissions. Moreover, the same product will cause a further 2.7 kg of emissions1 when it
is discarded and if it is incinerated.

The share of biobased polymers is very small compared to the fossil-based plastics – in 2019, their total
global production was 3.8 Mt, around 1 % of the total production volume of fossil-based polymers. The
biobased plastics value chain has the potential to reduce carbon dioxide (CO2) emissions due to
biogenic/sequestered CO2 if the usage of biobased plastics were to increase significantly and if biobased
plastic waste were recycled rather than incinerated. As for fossil plastics, decarbonisation of the energy-
related emissions plays a crucial role in reducing CO2 emissions from bioplastics value chains. The land-use
change-related direct and indirect impacts on greenhouse gas emissions, which can significantly alter
bioplastics’ overall potential for reducing greenhouse gas emissions when compared to fossil-based
plastics, are commonly not included.

1
    Not taking into account avoided emissions because of energy recuperation

                                                         1
A scenario calculation (2), substituting all fossil-based plastics with biobased ones in the EU, resulted in
overall greenhouse gas emissions of 146 Mt of CO2-eq in total for biobased plastics yearly, 30 % less than
the emissions of 208 Mt of CO2-eq from the fossil-based value-chain.
Both fossil-based and bioplastics have implications for several natural capital assets throughout their
entire lifecycles, such as the depletion of natural resources, water and air pollution, land use and soil
erosion and loss of biodiversity. Biobased plastics are based on various feedstocks and can have a variety
sustainability impacts on land and water use, biodiversity, indirect greenhouse gas emissions and create
competition with food production. The overall impacts of biopolymers need to be thoroughly evaluated
case by case.
2
Excluding (i-)LUC impacts and the same waste treatment scenario as the current situation
21 Introduction: plastics in a circular economy
1.1. Background
In recent years, plastics in the environment has become an important issue in both European and global
environmental debates and policy, especially its predominantly linear pattern of production and
consumption, and its striking leakages particularly into the marine environment.
Plastics have become a prominent feature of EU policymaking leading to, amongst others, the revision of
several Directives, the adoption of a Directive specifically on (single-use) plastics, and a specific EU Strategy
for Plastics in a Circular Economy (3). The von der Leyen Commission (2019-2024) plans to make the EU a
leader on the issue of single-use plastics. In the European Strategy for Plastics in a Circular Economy (EC,
2018) the European Commission highlighted that plastic is an important and ubiquitous material in the
EU’s economy and its citizens’ daily lives, but also stresses the urgent need to tackle its related
environmental problems because of the way it is currently produced, used and disposed. More recently,
the EU 2020 New Circular Economy Action Plan (4) emphasised action to increase circularity and reduce
the environmental impacts of plastic with particular focus on micro-plastics, requirements for packaging
and bio-based and biodegradable plastics.
The objectives of the European Green Deal (EC, 2019) affect the plastic value chain, for example by setting
specific goals for the reduction of greenhouse gas emissions, both in the short and long term, and
reinforcing all packaging in the EU market, including plastic packaging, being reusable or recyclable in an
economically viable way by 2030. In addition, the Green Deal proposes measures on microplastics, a policy
framework on bio-based and compostable plastics, and a timely implementation of the Single Use Plastics
(SUP) directive.
1.2. Plastics and the environment in a circular economy
A forthcoming EEA report on plastics in a circular economy describes the diverse appearance and
widespread use of plastics in society and explores the main challenges involved in transitioning towards a
circular plastics economy (EEA, 2020d). It assesses the overall environmental impacts that occur across the
lifecycle of plastics, including the leakage of plastics into the natural environment as well as the growing
demand for fossil resources (such as oil and gas) and related emissions of greenhouse gases. Finally, it
shows that an increasing number of EU initiatives are under way but that more coordination and scaling
up is needed to ensure a persistent, longer-term move towards a sustainable and circular plastics system.
1.3. Focus on greenhouse gas and natural capital implications of plastics (including biobased plastics)
In 2019, the carbon footprint of global plastic production and incineration was estimated at 850 Mt of CO2
(CIEL 2019). Taking into account the currently planned growth in plastic production and use worldwide,
these emissions could reach 1 340 Mt by 2030 and 2 800 Mt by 2050. Based on production volumes, the
EU’s contribution to this global impact could be 15 to20 % (CIEL 2019).
In 2018 the total annual global emissions of greenhouse gases were estimated by the International Panel
on Climate Change (IPCC) to be 55.3 gigatonnes (Gt) CO2-eq (UNEP 2019), of which plastics contributed
about 1.5 %.
3
https://ec.europa.eu/environment/waste/plastic_waste.htm
4
https://ec.europa.eu/environment/circular-economy/
3Greenhouse gas emissions are released all along the lifecycle of plastics, during the extraction of the
resources, their refining and processing, the conversion of plastics into products and components, the use
phase and the products’ after-use pathway, including incineration.
On top of the carbon issue, plastics also impact the environment and the world’s natural capital in various
and indirect ways, by using and impacting the planet’s stock of natural resources, including geology,
soil/land, air, water and living organisms.
In light of the current rising trends in the use of plastics, systematic and integrated perspective on plastics
and the carbon cycle is needed. Against this background, finding a way to make plastics compatible with a
low-carbon economy is an urgent challenge and various opportunities have been identified to reduce the
carbon intensity of the plastics system. One of the key challenges, however, seems to be the development
of a knowledge base of the unintended side effects of how plastics and plastic products are managed.
1.4. Goal and scope
The overall goal of this report is to reinforce the understanding of the links between different phases of
the plastics value chain and climate impacts, and provide insights to inform future discussions on the
potential (and limitations) of circular plastics and the corresponding impacts on climate and natural capital.
This is done from the perspective of a material, plastics, from the extraction of raw materials through
production to the end-of-life waste treatment of plastics (5). Most existing studies on climate impacts of
plastics focus solely on the production of plastics (from raw material to plastic (product)) or on waste
management aspects (from collection, over sorting to valorisation (recycling/incineration). Analyses on
product level, on the other hand, mostly include both production, use and end-of-life management, but
primarily focus on one product, and mostly not on the total market.
The current report provides insights on climate impacts for one specific year, being 2018, of both the
production of plastics in the EU and the management of European plastic waste.
The key benefit of this approach is that it considers potential burden shifting from one stage of the lifecycle
to others that might be beyond the (geographical) scope of the report. This approach can be applied both
at the level of a product, such as a car or a packaging, a societal functionality, such as mobility and heating,
or a material, such as plastics.
In this report focus is on plastics produced in Europe but because of the diversity of plastics and the
number of applications in which they are used, the impacts of the use phase are not included. The focus
is on the impacts of all steps in the total plastics value chain in EU Member States, including feedstock
production, refining, cracking, compounding, manufacturing, waste management, excluding the use
phase.
The report is concerned with the European plastic system, including both direct and indirect impacts, so
impacts outside the EU but related to plastics consumption in Europe, from resource use and production
to end-of-life management of EU plastics waste wherever they may occur are included. This will provide a
general overview of the size of the impacts of each step in the value chain, and how each step contributes.
The report uses the overall carbon footprint of the European plastic system, which is a global measure of
the greenhouse gas emissions over the entire European plastic value chain from oil extraction to waste
management and includes contributions of all incoming and outgoing mass and energy flows.
The analysis distinguishes between:
- direct emissions: emissions emitted directly during the various foreground processes;
5
This materials perspective differs by definition from a product and the functionality perspective
4- indirect emissions: those emissions emitted during the production and transport of materials
or the energy used in the various background processes – for example, during the production
of electricity that is used in the plastic production, regardless whether these processes occur
in or outside the EU;
- avoided emissions: for waste management purposes, it is key to include avoided emissions as
well to account for the benefits of the produced output streams of the waste management
process (JRC 2011). These avoided emissions are emissions that are considered to be avoided
because of the valorization of an output flow from waste processes, thereby avoiding the
traditional production of a similar product and the associated emissions. In the current report,
avoided emissions for energy recuperation during incineration are included explicitly. For
recycling, these avoided emissions are included implicitly as recycling plastics decreases the
demand of virgin feedstock materials (provided that the plastics are both recycled in Europe
and the recyclate is used as a feedstock in Europe).
Chapter 2 quantifies the greenhouse gas emissions of the European plastics system. Chapter 3 focuses on
bioplastics and their effects on greenhouse gas emissions, based on available information from relevant
case studies. In Chapter 4, natural capital implications of plastics and bioplastics are described.
1.5. Limitations of the report
The current report has its limitations, both with respect to the approach and the scope. For reasons of
clarity, these limitations are listed explicitly:
- the report does not claim to provide a complete or partial life cycle assessment, nor to follow
any official assessment procedure or standard;
- the reported greenhouse gas emissions always refer to a combination of direct, indirect and
avoided emissions, regardless the place where these emissions occur; so they should be
considered as global emissions;
- analyses of uncertainty and sensitivity have not been performed.
Although this report provides general insights in the link between plastic management and greenhouse
gas emissions, it would benefit from complementary studies and reports providing additional insights in
one or more specific aspects of the emission of greenhouse gasses during the life time of plastics or to look
at it from an alternative perspective. These specific aspects could relate for example to a specific life cycle
stage (such as resource extraction and the role of shale gas as resource for plastic production), a specific
polymer (such as PUR), a specific product (such as packaging), a specific sector or a functionality (such as
transport or mobility). Or these could focus more on the production perspective by diving deeper into the
contribution of the processing of resources or the conversion of polymer into products, or on the
consumers perspective focussing on the role and responsibility of consumers in the management of
plastics such as during the collection of plastic waste fractions.
Also more methodology related issues could be further elaborated to generate additional insights on the
environmental impact of the plastics value chain such as the link with existing greenhouse gas emission
inventories, the contribution of littering and microplastics to greenhouse gas emissions and natural capital
implications, the impacts of indirect land use change and/or other environmental issues (such as
acidification, eutrophication, …).
52 EU plastics value chain and greenhouse gas emissions
Summary and discussion
The total greenhouse gas emissions caused by the plastics value chain, for the plastics volume converted
in the EU, is estimated at 208 Mt CO2-eq per year (Table 2-1). This figure is the result of a bottom-up
approach, taking account of all emissions over the whole lifecycle, from resourcing to waste processing,
and taking into account both direct and indirect emissions. The resulting figure is therefore higher and
gives a more complete view for the plastics value chain compared to the figures reported, for example, in
the EU greenhouse gas emissions inventory, in which the plastics value chain is integrated in the sectors
‘Petroleum refining’ (111 Mt CO2-eq in 2018) and ‘Chemicals’ (73 Mt CO2-eq in 2018).
It has been estimated by Zheng and Suh (2019) that the global plastic production was 380 Mt in 2015
producing emissions of 1.8 Gt of CO2-eq. The total plastics production in Europe in 2018 was 61.2 Mt,
which is around 16 % of the total global production – 16 % of the Zheng and Suh (2019) figure of 1.8 Gt
CO2-eq for 2015 is approximately 285 Mt CO2-eq.
The total greenhouse gas emissions in the EU in 2018 were 3.9 Gt CO2-eq (EEA 2020b).
Table 2-1 Estimated annual greenhouse gas emissions from EU and global plastics value chains
Stage EU estimate (Mt CO2 eq) Global estimate (Mt CO2 eq)
Category (own calculation) (Zheng and Suh, 2019)
Production PP 18.91 134.84
LD PE 17.82 125.57
HD PE 11.97 101.35
PVC 12.80 78.51
PUR 22.80 132.30
PET 11.47 109.96
PS/EPS 12.14 87.93
PP&A fibers* 213.88
Additives* 55.00
Others 24.35 45.39
Conversion PP 9.31 92.89
LD PE 10.17 69.63
HD PE 7.01 58.40
PVC 2.60 22.53
PUR 2.04 32.18
PET 3.67 26.66
PS/EPS 1.68 31.00
PP&A fibers* 159.30
Additives* 25.90
Others 9.12 16.58
End of life** Recycling 3.02 49.25
Incineration 27.36 95.96
Landfilling 0.22 15.59
TOTAL 208.44 1,780.46
Notes: * Zheng and Suh (2019) include additives and polyester, polyamide and acrylic fibres, which are not included
in this report
** reported number do not include any avoided emissions, and only relate to direct and indirect emissions
during the end of life phase
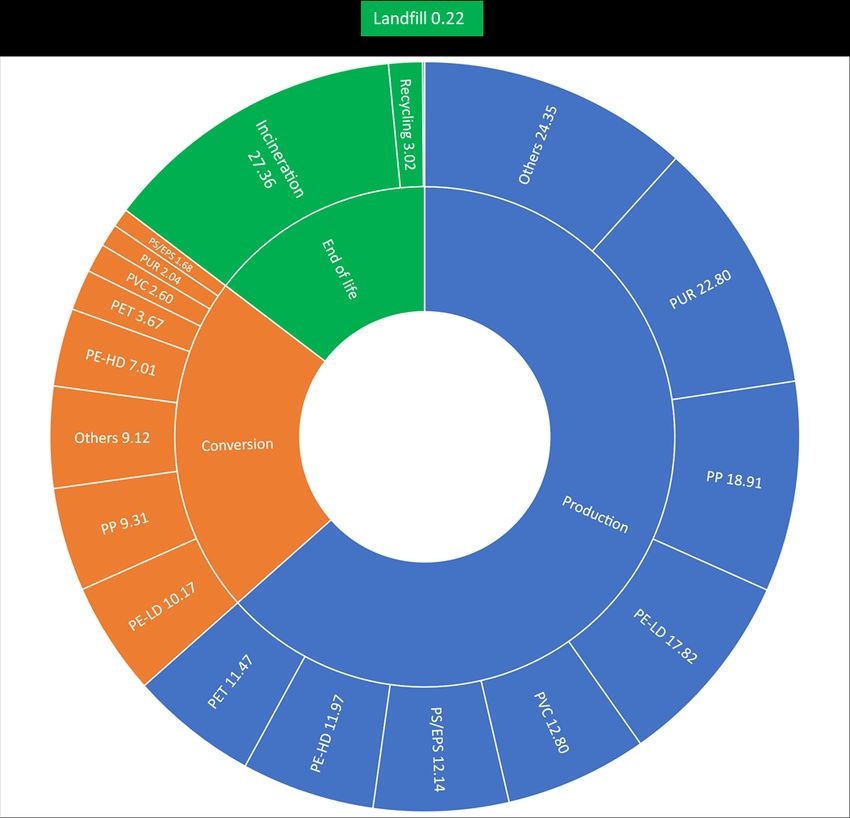
6Sixty-one per cent of the greenhouse gas emissions in the EU plastics value chain occur in the production
phase. Converting these polymers to products accounts for 21 %, and plastic waste treatment adds a
further 18 %, mainly due to incineration (Figure 2-1).
Figure 2-1 Total greenhouse gas emissions from the EU plastics value chain, 2018, Mt CO2eq per
year
Source: ETC/WMGE, 2021
It is clear that emissions reported by large refineries and resin production sites only cover part of the total
greenhouse gas emissions related to the plastics value chain. A significant part of the these emissions also
come from conversion activities, which usually take place in a variety of smaller companies, scattered over
the EU. The end-of-life phase is also responsible for a significant share of the emissions, which are
instantaneously emitted from incineration facilities or released from landfills over time.
2.1. Introduction
Nearly every piece of plastic begins as a fossil fuel, and greenhouse gases are emitted at each stage of a
plastic’s lifecycle. Emissions occur:
1) during fossil fuel extraction and transport;
72) in the production phase, which can be divided in two important steps: the production of the
polymers (plastic materials) and the conversion of these polymers into (intermediate) products;
3) in the use phase, where plastics products become part of a plastic stock; and
4) in the end-of-life-phase, when plastic waste is either littered or sent to incineration, recycling or a
landfill.
Greenhouse gas emissions are not only caused by the energy or fuel consumed during production,
conversion, use, transport, etc. In addition, plastics as such have a large amount of carbon embedded in
them, which is only released into the atmosphere at their end of life, when they are incinerated
(immediate emission) or landfilled/littered (partly released over time). Thus, all plastics’ embedded carbon
has the potential to be released as CO2. Recycling offers the opportunity to keep the embedded carbon in
the loop, while producing plastics from biomass avoids adding more fossil carbon to the loop (Figure 2-2).
Figure 2-2 Overview of basic sources and sinks of CO2 in the plastics’ product chain using a carbon
flow accounting approach.
Note: Arrows indicate storage (embedded carbon) and emissions (release of embedded carbon). Flows are not
proportional to the width of the arrows.
Source: Adapted from Gielen (1998)
Greenhouse gas emissions are thus not limited to, for example, the on-site emissions measured at polymer
production sites. They also include upstream and indirect emissions related to, for example, crude oil
extraction or electricity production for the power required for the plastics production and conversion
processes. As indicated in the previous paragraph, carbon embedded in plastic products should be taken
into account, as it causes emissions in the end-of-life phase.
Very few attempts have yet been made to map material flows and related CO2 emissions for the total
plastics value chain. It is very complicated to track the fate of carbon-containing resources through
feedstock and polymer production to a variety of plastic products with different lifetimes and end-of-life
options.
In this report, greenhouse gas emissions related to the European plastics value chain are estimated using
a bottom-up approach. The bottom-up analysis starts from plastic production, consumption and waste
management data, with greenhouse gas emission factors then attributed to the flows of each lifecycle
step, which then allow the calculation of the emissions throughout the value chain.
8Greenhouse gas emissions are expressed assuming a 100 year time horizon for the cumulated integration
of the IR (infrared radiation) of the emitted GHGs, applying the IPCC 2013 methodology (6). This means
that not only CO2 emissions, but also other greenhouse gases – methane, nitrous oxide, etc. – are included.
These other greenhouse gases vary in their relative contributions to global warming. The difference is
expressed by the global warming potential (GWP), which is a factor used to calculate the contribution of
other greenhouse gases in terms of CO2 equivalents.
2.2. Release of greenhouse gasses along the EU plastics value chain
Material flows in the EU plastics lifecycle
The plastics value chain is both very diverse and globally spread. Oil and gas, which are still the principal
feedstock for plastics production, are sourced in different parts of the world. Polymers are produced in
the EU, not only for the EU market, but also for export, and imported. These polymers are converted into
plastic products, which are sold in the EU, but again, also exported, and imported. Similarly, plastic
products are sold on the EU market or exported to other markets, or imported. Finally, plastic waste,
collected for recycling, is partially exported for processing outside the EU.
Figure 2-3 EU plastics lifecycle
Source: EEA (2020d)
Figure 2-4 summarises some key figures for material flows in the EU plastics value chain. The total primary
production of polymers in the EU is estimated at 61.8 Mt per year. Polyethylene (PE) and polypropylene
6
See also https://unfccc.int/process/transparency-and-reporting/greenhouse-gas-data/greenhouse-gas-data-
unfccc/global-warming-potentials
9(PP) represent by far the largest volume, followed by polyvinylchloride (PVC), polyurethane (PUR),
polyethylene terephthalate (PET) and (expanded) polystyrene ((E)PS). The EU converters demand of
around 51.2 Mt per year is smaller than polymer production, meaning that the EU is a net polymer exporter
(Plastics Europe 2018). Packaging, building and construction, and the automotive sector use almost 70 %
of all plastics in Europe, with the packaging sector alone accounting for almost 40 % of it.
There is, however, a gap between the volume of plastic used in products each year, 51.2 Mt, and the yearly
volume of plastic waste collected, 29.1 Mt. There are several reasons for this imbalance. Firstly, plastic
products have variable lifetimes: packaging becomes waste in a few days or weeks, whereas building
products last for decades. Secondly, not all waste is collected properly; and finally, not all plastic products
produced in the EU are sold, used and discarded in the EU itself.
Figure 2-4 Production, conversion, and waste volumes in the EU plastics value chain, 2018, Mt per
year
Note: Figures may not sum up due to rounding
Source: Plastics Europe (2018)
The analysis is somewhat complex, so in order to obtain a snapshot of the European plastics value chain
and related greenhouse gases, the scope for this analysis was defined as follows.
- 2018 was the Reference year.
- The volume of polymers produced for the EU market equals the EU converters demand: 51.2
Mt per year. If converters import some plastic polymers from outside the EU, the carbon
footprint of these is assumed to be the same as the carbon footprint of polymers produced in
the EU. Greenhouse gas emissions related to energy use in the production and conversion
steps are based on figures which reflect the average EU energy mix of fossil-based, nuclear
and renewable energy.
- No impacts are allocated to the polymers produced in the EU and exported; similarly no
(avoided) impacts are allocated to the use of secondary materials (recycled plastics);
10- PET-fibers, PA-fibers and polyacryl-fibers are not included in the figures from Plastic Europe
(2018), and also not included in our analysis. The European production of man-mad fibers is
estimated by the European Man-Made Fibre Association at 3.5 Mt in 2018. (ETC WMGE 2021)
- The potential impact of plastic products made outside the EU but sold, used or discarded in
the EU was not taken into account. In this simplified approach, the plastic conversion of 51,2
Mt per year in the EU was taken as plastic use. As will be explained further, no significant
greenhouse gas emissions were allocated to the use phase.
- The greenhouse gas emissions in the end-of-life phase were based on plastic waste collection
figures, 29.1 Mt: plastics collected for recycling, for example, were assumed to be recycled in
the EU. Additional impacts from long-distance waste transport, for example, were not
reflected in the result. It is, however, known from statistics on international trade (Comext),
that 1.8 Mt of plastic waste were exported from the EU in 2018, mainly to countries in Asia
(EEA 2019).
Greenhouse gas emission intensity factors
It is clear that existing greenhouse gas emission datasets do not provide a complete picture of emissions
at the level of product or material value chains. In the following paragraphs, a bottom-up approach was
therefore used. The basic data for this exercise are greenhouse gas emissions intensity factors that are
found in lifecycle analyses and databases such as Ecoinvent (7). They express the level of emissions per
(mass) unit produced, used, transported or treated (kg CO2 eq per kg of material), including direct and
indirect emissions per lifecycle phase. In this case, distinctions were made between:
- the production phase, including crude oil production, refining and polymer production;
- conversion;
- use;
- end-of-life and waste management
Resulting factors used in this report are summarised in Figure 2-5, and will be discussed in more detail in
the following sections.
For the production and conversion phases, specific estimates can be made per polymer type. In this case,
the primary focus was on high volume plastics, so common polymer types were distinguished:
polypropylene, high- and low-density polyethylene, polyvinylchloride, polyurethane, polyethylene
terephthalate and polystyrene. For other polymers, the median value of the others combined was used as
an estimate.
Little is known about the emissions related to the use phase, but as discussed later, in general, greenhouse
gas emissions in the use of plastics can be assumed to be insignificant.
For the end-of-life phase, no distinction was made between the fate of different polymer types. The three
main routes considered for plastic waste are recycling, incineration and landfilling.
7
https://www.ecoinvent.org/
11Figure 2-5 Greenhouse gas emissions intensity factors (horizontal axis) and material flows (vertical axis) in the EU plastics value chain used in the bottom up
analysis
Source: ETC WMGE
12Results show that, for plastic products, there is quite some variability in specific greenhouse gas emissions,
depending on the polymer type and conversion technique. But overall, it can be concluded that, when a 1
kg plastic product comes onto the market, it has already caused at least on average 2.9 kg CO2-eq
emissions. Moreover, the same product will cause a further 2.7 kg CO2-eq emissions when it is discarded
and incinerated8. These emissions are the equivalent of travelling 25 and 23 kilometres respectively in an
average European passenger car (EEA 2020b).
For the purpose of comparison, according to Materials Economics (2019),the carbon footprints for the
primary production of a kilogramme of steel and aluminium are 1.9-2.4 and 12 kg CO2-eq respectively.
Quantification of greenhouse gas emissions
To obtain total annual greenhouse gas emissions for the European plastics value chain, intensity factors
were multiplied with mass flows obtained from sectoral data for polymer production and conversion, and
waste processing. The overall greenhouse gas impact of the EU plastics value chain corresponds to 208 Mt
CO2-eq. Results are summarized in Figure 2-6 and discussed further in detail in the following sections.
As the total greenhouse gas emissions in the EU in 2018 were 3,893 Mt CO2-eq (EEA 2020b), of which the
EU plastics value chain contributes about 5.5 %.
Figure 2-6 Greenhouse gas emissions from the EU plastic value chain, 2018, Mt per year
Source: ETC WMGE
Figure 2-6 shows that the majority, 63 %, of greenhouse gas emissions caused by the plastics value chain
are related to the production resins. Converting these into products accounts for 22 %, and plastic waste
treatment adds a further 15 %, mainly due to incineration.
8
Not taking into account avoided emissions for energy recuperation
13The following sections provide more details about the bottom up calculation of greenhouse emissions
related to the different lifecycle phases of the value chain.
2.2.1 Resource extraction
For fossil-based plastics, resource extraction corresponds to crude oil production, as the fossil-based value
chain starts by default with the production of crude oil. This covers several activities, going from
exploration, through drilling, development, production and extraction, to surface processing and transport
to the refinery. Each of these activities causes emissions: direct emissions, like methane leakage and
flaring; emissions from fuel combustion and energy consumption in the drilling process of drilling; and
even emissions caused by land disturbance when forests and fields are cleared for well pads and pipelines.
There are very few comprehensive datasets covering lifecycle emissions from crude oil production.
Masnadi et al. (2018) estimated the emissions from 8,966 oil fields in 90 countries, representing 98 % of
2015 global crude oil and condensate production. From this dataset, the global volume weighted average
upstream carbon intensity (CI) was calculated to be 10.3 grams CO2 eq/megajoule (MJ) crude oil. Using a
heat value for crude oil of 42–47 MJ/kg (9), the global weighted value for crude oil production would be in
the range of 0.432-0.484 kg CO2/kg crude oil.
When estimating the greenhouse emissions more specifically for the European plastics value chain, it is
important to take account of the variable sources of crude oil and natural gas that are supplied to the
European market. As shown in Table 2-2, these supplies come from many countries all over the world,
with different production practices and corresponding carbon intensities, ranging from 0.03 kg CO2/kg
crude oil to 0.458 kg CO2/kg crude oil. The average carbon intensity for the EU cracker capacity mix is
estimated at 0.228 kg CO2 emissions per kilogram of crude oil (10), which is lower than the weighted global
value calculated by Masnadi et al. (2018). This 0.228 kg CO2 emissions per kilogram crude oil corresponds
to the gasses emitted over a 2 kilometre journey an average European car (EEA 2020c).
Similarly, the upstream natural gas supply chain has branches worldwide. The average carbon intensity for
the EU cracker capacity mix is estimated at 0.173 kg CO2 emissions per kilogram of gas feedstock.
Table 2-2 European upstream chain of crude oil and natural gas, supply share and emissions
upstream from refinery according to provenance, 2010 (10)
Crude oil
Country of origin Emissions due to crude oil production Share (% of weight)
(kg CO2/kg crude oil)
Russia 0.201 32.8
Middle East, Azerbaijan, Kazakhstan 0.291 22.9
Norway, Denmark 0.069 15.7
Libya, Algeria, Angola 0.289 11.1
United Kingdom 0.198 10.1
Nigeria 0.447 4.3
Venezuela 0.458 2.8
Netherlands 0.030 0.3
Average, according to cracker capacity
mix:
0.228
9
https://www.world-nuclear.org/information-library/facts-and-figures/heat-values-of-various-fuels.aspx
10
https://www.plasticseurope.org/en/resources/eco-profiles
14Natural gas
Country of origin Emissions due to gas production Share (% of weight)
(kg CO2 /kg gas feedstock)
Norway 0.077 23.6
Netherlands 0.027 23.2
Russia 0.348 22.7
Algeria, Qatar 0.289 16.5
United Kingdom 0.153 7.6
Germany 0.146 6.4
Average, according to cracker capacity
mix:
0.173
There are several reasons for the variability in greenhouse gas emissions during crude oil production – gas
flaring (burning) practices have a considerable influence. If not economically saleable, gas is either flared,
reinjected or vented – directly emitting methane. The estimated share of flaring emissions in the global
volume-weighted average upstream carbon intensity is 22 % (Masnadi et al., 2018). Besides intentional
venting and flaring, methane emissions also occur from leaks from the pipelines that transport the gas
from production sites to the distribution system (US EPA, 2019). Venting and methane fugitive emissions
are, however, poorly detected, measured or monitored, and therefore, estimates of their contribution
remain highly uncertain.
Another important factor to keep in mind is that as oil and gas fields near total exhaustion, greenhouse
gas emissions generally increase due to the use of enhanced recovery practices as more energy is needed
to manage higher quantities of water to be cleaned or injected into the bedrock (Norwegian EPA, 2019).
Finally, on-shore oil and gas extraction cause land disturbance and indirect greenhouse gas emissions as
forests and fields are converted into oil fields and can no longer absorb CO2 (CIEL 2019). No quantitative
estimates were found for this.
The above data refers to the extraction of crude oil as a basis for the production of plastics. However, a
variety of products is made from crude oil and gas, and it is not always clear how these relate or can be
allocated to plastics. In the references used, such as Ecoprofiles from Plastics Europe, this allocation has
already been done.
2.2.2 Refining and polymer production
Refinery
Crude oil is a complex mixture of hydrocarbons together with impurities such as sulphur and some heavy
metals. Oil refining aims to remove the non-hydrocarbon components and to split the crude oil into a
series of specific fractions, based on their different boiling points, such as butane, diesel, gasoline, heavy
gas, kerosene, naphtha, oil and residual fuel oil. The principal fraction used for the production of plastics
is naphtha.
As with crude oil production, the carbon intensities of global refining vary. Operating characteristics of
different refineries depend on the type of crude oil they process and the demand for different fractions –
naphtha, gasoline, etc. The global volume-weighted average, as calculated by Jing et al. (2020), was 40.7
kg CO2-eq per barrel or 7.3 g CO2 eq/MJ. Using a heat value for crude oil of 42–47 MJ/kg (9), the volume-
weighted value for oil refining would be in the range of 0.307–0.343 g CO2-eq/kg crude oil. It is estimated
that refining activities account for 40 % of the emissions from the oil and gas supply chain, and 6 % of all
industrial emissions (Jing et al., 2020). On average, more than 95 % of the global refining carbon intensity
is generated by CO2, and only 4 % plus by methane.
15Plastics Europe used data from seven oil refineries and world data from International Energy Agency (IEA)
statistics to compile the European eco-profile for naphtha (Plastics Europe 2005). To produce 1 kg of
naphtha, it was estimated that approximately 1.1 kg of crude oil is used and greenhouse gas emissions
were estimated at 0.340 kg CO2-eq/kg naphtha, which is in line with the global figure from Jing et al.
(2020). For each location of refineries and crackers, the respective country specific electricity mix, including
the respective pre-chains, was used instead of an average EU electricity mix.
For this report, the scope was limited to the refinery itself, including all major process units, energy and
hydrogen supplied to the refinery as well as the upstream emissions related to natural gas and electricity
consumed by the refinery.
Carbon dioxide, methane and nitrous oxide are significant of greenhouse gas emissions from refining
activities. Fugitive methane emissions occur, for example, from process equipment leaks while methane
flaring can occur due to safety concerns, such as equipment malfunctioning.
Steam cracking and polymer production
After refining, petroleum products are ready to be used as a feedstock for polymer production. The first
step in the process is cracking through which complex organic molecules in petroleum products are broken
down into simpler ones. Several methods exist, of which steam cracking is one of the most common and
widely spread.
Steam cracking delivers a complex range of petrochemical intermediates, which are essential for the
production of plastics (polymers), solvents, elastomers, fibres, fuel, etc. The main petrochemicals are
ethylene, propylene, and methane. Their shares depend on the type of feedstock. Other important
petrochemicals are butadiene and, in case of naphtha or gas-oil feedstock, pyrolysis gasoline with a high
aromatic content.
Possible pathways from feedstock to polymer are illustrated in Table 2-7. Ethylene and propylene can be
directly polymerised into polyethylene and polypropylene, or further processed into polyvinylchloride,
polyethylene teraphtalate, polystyrene or polyurethane, for example. The processes are linked and highly
integrated, which makes it difficult to allocate greenhouse gas emissions for the separate steps to the
resulting polymer.
16Figure 2-7 Overview of a selection of processes and intermediates stages in the production of
polymers and other petrochemical products.
Note: Main cracker feedstock components are indicated in green. Main polymers are indicated in red
Source: Gielen (1998)
In the EU, the main feedstock for crackers is naphtha: together with condensates from natural gas
production, the share of naphtha in European cracker feedstock is estimated at 74 % (Plastics Europe
2016). Other inputs are propane, butane and liquefied petroleum gas, 12 %; gas oil, 6 %; and ethane
(refinery gases), 4 %.
Greenhouse gas emissions and other life cycle impacts related to polymer production are documented in
Plastic Europe’s Ecoprofiles, which were published from 2005 to 2017 (Plastics Europe 2016). The same
data can be found in the Ecoinvent database, for which the last update, version 3.6, was released in
September 2019 (7). These datasets provide figures for the production of a range of polymers, including all
upstream processes. Due to the fact that for several unit processes, the data are aggregated, it is not
possible to calculate greenhouse gas emissions for each of the steps in the production process separately.
For most polymers, however, it is possible to trace some of the emissions hotspots in the process. The
contribution of total electricity or heat use in production and upstream processes can also be estimated.
Impacts related to electricity and/or heat use are tailored to the EU market by using the European energy
mixes.
Resulting greenhouse emission figures for common polymers are listed in Table 2-3. They show that
accumulated greenhouse gas emissions for the resource extraction, refining, cracking and polymer
production stages range from 1.91 to 5.70 kg CO2 eq/kg polymer respectively for polypropylene and
polyurethane rigid foam. As already stated, these values include emissions related to European electricity
17for cracking, polymerisation processes which take place in the EU, and world energy mixes for upstream
processes such as crude oil refining. A more detailed description of the datasets is included in Annex 1.
Table 2-3 Greenhouse emissions from polymer production, kg CO2eq/kg polymer
Polymer Polymer production Greenhous gas emissions
and key upstream contributing processes (kg CO2eq/kg polymer)
PP Polypropylene, granulate production (Europe) 1.91
LD PE Polyethylene, low density, granulate production(Europe) 1.98
HD PE Polyethylene, high density, granulate (RER) production (Europe) 1.93
PVC Polyvinylchloride bulk polymerised production (Europe) 2.51
PUR Polyurethane, rigid foam production (Europe) 5.70
PET Polyethylene terephthalate, granulate, amorphous production (Europe) 2.94
PS Polystyrene, general purpose production (Europe) 3.68
Source: Ecoinvent database, version 3.6 (7)
Finally, when multiplying the emission factors by the annual EU converters’ demand – the amount of
plastic resin needed for the production of plastic products in Europe – an estimate is obtained for the
annual emissions due to polymer production in the EU plastics value chain. The calculation is illustrated in
Table 2-4. For the “Other polymers”-category, in the absence of more specific data, the value for PVC was
applied. This might be an underestimation, since these specialty plastics are more advanced and usually
require several intermediate processes during production.
Table 2-4 Estimated annual GHG emissions due to resource extraction, refining and polymer
production in the EU plastics value chain, 2019
Polymer Annual EU Greenhouse gas Annual greenhouse
converters demand emissions gas emissions (Mt CO2-
(Mt) (kg CO2-eq/kg polymer) eq)
(Plastics Europe, (Ecoinvent 3.6)
2019)
PP 9.9 1.91 18.91
LD PE 9.0 1.98 17.82
HD PE 6.2 1.93 11.97
PVC 5.1 2,51 12.80
PUR 4.0 5.70 22.80
PET 3.9 2.94 11.47
PS/EPS 3.3 3.68 12,14
Others 9.7 2.51* 24.35
TOTAL 132.26
Note: *Median value
Source: ETC/WMGE
Results show that the production phase for the polymers needed for further conversion in the EU causes
emissions of approximately 132 Mt CO2-eq. More than 80 % of these emissions are related to seven
polymers: high- and low-density polyethylene, polyethylene terephthalate, polypropylene, expanded
polystyrene, polyurethane and polyvinylchloride.
182.2.3 Conversion
Plastic converters use the plastic resins – polymers, mixed with additives – to manufacture all kinds of
plastic products and components. They use several different technologies, depending on the resin type
and the type of product or application: injection moulding, blow moulding, calendaring, extrusion, foaming
and thermoforming.
All of these techniques are used in a wide variety of companies, both large and small, producing a
miscellany of products from drinks bottles and food packaging, through agricultural foils to plastics for
textiles and components for electronic appliances or the automotive and aviation industries. Production
volumes can vary from very small batches for specialised products to industrial-scale mass production.
The conversion step basically involves the application of mechanical and heat energy. Lifecycle inventory
data for conversion processes show that the additional greenhouse gas emissions caused by these
processes are in the range of 0.294–1.14 kg CO2-eq/kg product for the extrusion of plastic pipes and
stretch blow moulding, respectively (Table 2-5). Electricity use represents 64 to 93 % of these emissions.
Table 2-5 Greenhouse gas emissions from plastic conversion technologies (EU averages)
Conversion technology and key contributing processes Greenhouse gas emissions
(kg CO2-eq/kg product)
Injection mould processing (Europe) 0,962
Electricity, medium voltage (Europe) 0,62 (64%)
Heat, district or industrial, natural gas (Europe excluding Switzerland) 0,22 (23%)
Blow mould processing (Europe) 0,917
Electricity, medium voltage (Europe) 0,72 (78%)
Solid bleached board 0,12 (13%)
Stretch blow moulding (Europe) 1,14
Electricity, medium voltage (Europe) 1,06 (93%
Calendering, rigid sheets (Europe) 0,322
Electricity, medium voltage (Europe) 0,21 (66%)
Steam, in chemical industry (Europe) 0,07 (21%)
Extrusion of plastic film (Europe) 0,416
Electricity, medium voltage (Europe) 0,28 (67%)
Heat, district or industrial, natural gas (Europe excluding Switzerland) 0,03 (8%)
Waste plastic, mixture (Europe) 0,03 (8%)
Extrusion of plastic pipes (Europe) 0,294
Electricity, medium voltage (Europe) 0,21
Heat, district or industrial, other than natural gas (Europe) 0,05
Polymer foaming processing (RER) 0,513
Electricity, medium voltage (RER) 0,33 (64%)
Heat, district or industrial, other than natural gas (Europe) 0,18 (36%)
Thermoforming with calendering (Europe) 0,642
Electricity, medium voltage (Europe) 0,42 (66%)
Source: Eco-invent database, version 3.6 (7)
Datasets which allocate certain conversion techniques to specific volumes of polymers in Europe are not
available. Estimates can, however, be found in the literature for the share of conversion technologies used
for the most common types of resin (Zheng and Suh 2019, Keoleian 2012) Using these estimates, some
realistic assumptions were made regarding the shares of conversion technologies. GHG emission
19intensities were then calculated for the conversion of each polymer in the EU, by applying these shares on
data from the Eco-invent 3.6 database (Table 2-6).
Table 2-6 Estimated annual greenhouse gas emissions from polymer conversion in the EU plastics
value chain, 2018
Polymer Annual EU converters Assumptions regarding GHG emissions Annual GHG
demand (Mt) conversion (adapted from (kg CO2-eq/kg emissions
(Plastics Europe, 2019) Zheng and Suh, 2019) polymer) (Mt CO2-eq)
74 % injection moulding;
PP 9.9 24 % blow moulding; 2 % 0.94 9.31
extrusion (pipes)
67 % injection moulding;
LD PE 9.0 24 % blow moulding; 9 % 1.13 10.17
extrusion (pipes)
67 % injection moulding;
HD PE 6.2 24 % blow moulding; 9 % 1.13 7.01
extrusion (pipes)
51 % extrusion (pipes); 18 %
calendering (sheets); 29 %
PVC 5.1 0.51 2.60
injection moulding; 2 %
blow moulding
PUR 4.0 100 % polymer foaming 0.51 2.04
50 % injection moulding;
PET 3.9 0.94 3.67
50 % blow moulding
PS/EPS 3.3 100 % polymer foaming 0.51 1.68
Others 9.7 0.94* 9.12
TOTAL 45.60
Note: *Median value
Source: Plastics Europe (2019); Zheng and Suh (2019); Keoleian et al. (2012)
Results show that the conversion of polymers into plastic products in the EU emit approximately 46 Mt
CO2-eq. Most of these emissions relate to the mechanical and heat energy needed for the conversion
processes. These emissions correspond to 10 % of the 2018 worldwide greenhouse gas emissions caused
by the combustion of car fuels (EEA 2020b).
2.2.4 Use
For the vast majority of plastic products, it is impossible to allocate meaningful climate impacts to the use
phase. Usually, plastic products do not cause any direct emissions during use and therefore only contribute
in an indirect way to emissions caused by their usage. That is why the use phase is usually not taken into
account in calculations, including in this report.
The focus of this report is material (carbon) flows. In the use phase, however, focus is on the product and
its functionality. Plastics included in the product contribute to this functionality, but their contribution can
vary in many ways. Specific greenhouse gas analyses or carbon footprint calculations for products or
product groups typically do include the specific emissions from the use phase or the emissions upstream
and downstream of it, but their purpose and approach differs from looking from the materials perspective.
Therefore, the analysis does not include greenhouse gas emissions from products containing plastics.
20You can also read