Leverage Points for Reducing Single-use Plastics - Background Research Chris Sherrington - Seas at Risk
←
→
Page content transcription
If your browser does not render page correctly, please read the page content below
Leverage Points for Reducing
Single-use Plastics

Background Research

Chris Sherrington
Chiarina Darrah
Steven Watson
Joss Winter
30th March 2017

   BACKGROUND REPORT           i
Report for Seas at Risk

Prepared by Chiarina Darrah

Approved by

Chris Sherrington
(Project Director)

Eunomia Research & Consulting Ltd               Tel: +44 (0)117 9172250
37 Queen Square                                 Fax: +44 (0)8717 142942
Bristol                                         Web: www.eunomia.co.uk
BS1 4QS
United Kingdom

Disclaimer
Eunomia Research & Consulting has taken due care in the preparation of this report to
ensure that all facts and analysis presented are as accurate as possible within the
scope of the project. However no guarantee is provided in respect of the information
presented, and Eunomia Research & Consulting is not responsible for decisions or
actions taken on the basis of the content of this report.

                      Seas At Risk gratefully acknowledges EU funding support. The
                     content of this website is the sole responsibility of Seas At Risk. It
                     should not be regarded as reflecting the position of the Executive
                     Agency for small and medium sized enterprises.

ii                                                                              31/03/2017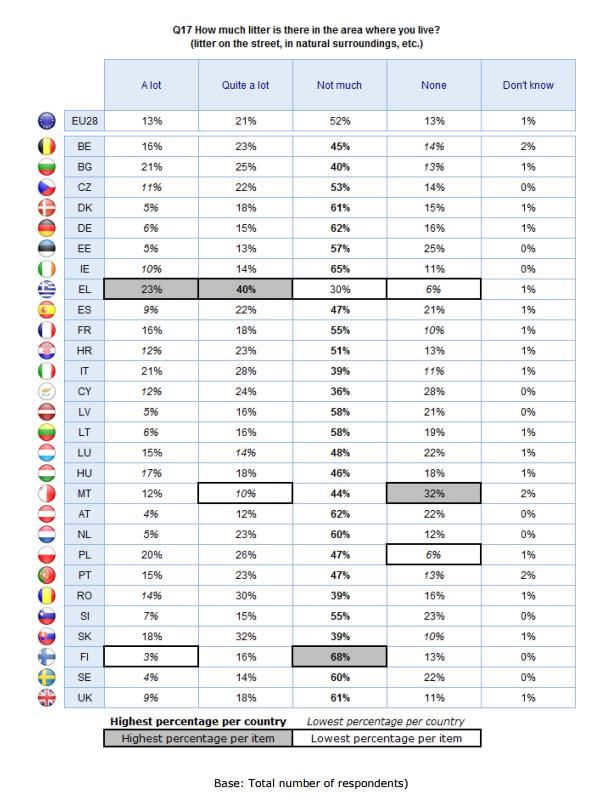
Version Control Table
Version         Date    Authorised by                       Description

                        Chiarina
V0.1      24/03/17                      First draft (internal)
                        Darrah

                        Chiarina
V1.0      30/03/17                      Second draft (sent to client)
                        Darrah

                        Emma
V2.0      19/05/17                      Client comments
                        Priestland

                        Chiarina
V3.0      12/07/17                      Draft final (sent to client)
                        Darrah

                        Emma
V4.0      28/07/17                      Client comments
                        Priestland

                        Chiarina
V5.0      06/09/17                      Final version
                        Darrah

   BACKGROUND REPORT                                                      iii
Contents
1.0 Introduction .............................................................................................................. 7
2.0 Item Specific Consumption Estimates ....................................................................... 8
2.1 Methodology ....................................................................................................... 8
2.2 Plastic Bottles ...................................................................................................... 9
2.3 Coffee Cups and Lids .......................................................................................... 12
2.4 Drinking Straws .................................................................................................. 15
2.5 Other Disposable Cups ....................................................................................... 18
2.6 Coffee Stirrers .................................................................................................... 18
2.7 Takeaway Packaging .......................................................................................... 19
2.8 Cigarette Butts ................................................................................................... 21
2.9 Eurostat – Prodcom Data ................................................................................... 23
2.10 Plastic Production .............................................................................................. 26
3.0 Prevalent Plastic Items on Beaches ......................................................................... 30
3.1 Single-use plastic found as beach litter .............................................................. 30
3.2 Review of the International Coastal Clean-up data ............................................. 30
3.3 Review of Arcadis Data ...................................................................................... 34
3.4 Review of Marine Litter Watch Data .................................................................. 37
3.5 Regional Sea: North Eastern Atlantic .................................................................. 38
3.6 Regional Sea: Black Sea ...................................................................................... 40
3.7 Regional Sea: Baltic Sea...................................................................................... 40
3.8 Regional Sea: Mediterranean ............................................................................. 42
3.9 Conclusions ........................................................................................................ 43
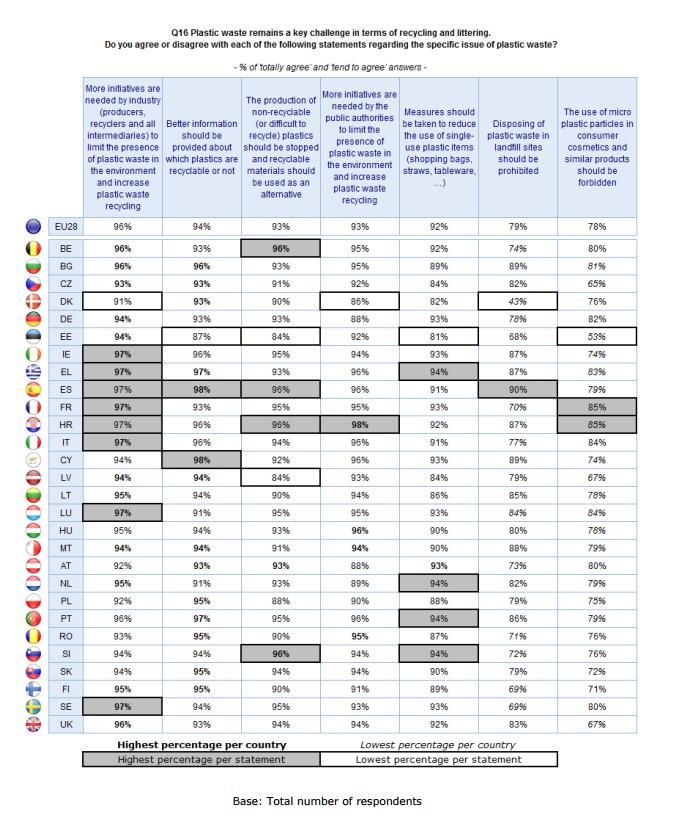
4.0 Attitudes towards single-use plastic consumption, litter and reduction measures 44
4.1 Public Attitude towards Litter and its Prevention ............................................... 45
4.2 Cigarette Litter ................................................................................................... 50
4.3 Perceptions around measures to reduce use or increase capture of single-use
items 51
4.3.1 Public Attitudes Towards Different Litter Reduction Measures.................... 51
4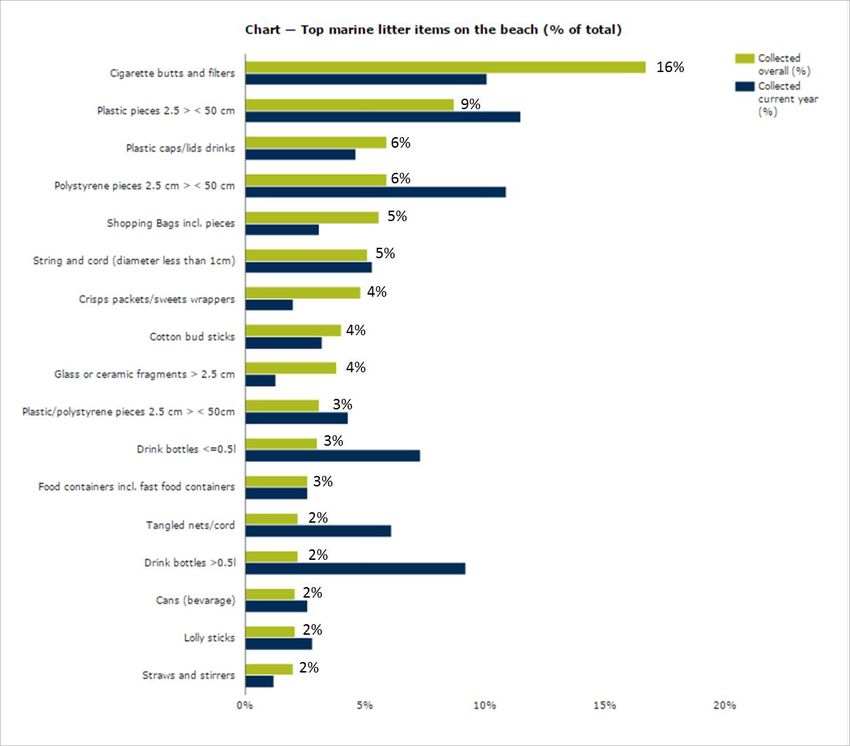
4.3.2 Plastic Bag Charge and Associated Perceptions Before and After
     Implementation ...................................................................................................... 52
     4.3.3       Public Acceptance of Deposit Return Schemes ............................................ 53
  4.4 Quality of Deposit Return Scheme Materials ...................................................... 54
5.0 Legislative Leverage Points ..................................................................................... 55
  5.1 Role of Green Public Procurement ..................................................................... 55
     5.1.1       Green Public Procurement for Food and Catering Services .......................... 56
     5.1.2       Use of Licencing Laws to Require the Use of Reusables ............................... 60
  5.2 Environmental Management and Audit Scheme (EMAS) .................................... 61
  5.3 Extended Producer Responsibility and Proposed Minimum Requirements......... 63
     5.3.1       Implementation of Producer Responsibility in the European Union ............. 64
     5.3.2       Cost-effectiveness of EPR Schemes for Packaging ....................................... 64
     5.3.3       Revised Circular Economy Package ............................................................. 67
  5.4 Extending the Provisions around Plastic Bags ..................................................... 70
  5.5 Cutlery and Straws – Are they Packaging? .......................................................... 71
  5.6 Requirement for Waste Producers to Implement the Waste Hierarchy .............. 72
     5.6.1       UK Situation ............................................................................................... 72
     5.6.2       Situation in other Member States ............................................................... 73
     5.6.3       Conclusion .................................................................................................. 77
6.0 Best Practice Case Studies ....................................................................................... 78
  6.1 “Münchner Einwegverbot” ................................................................................ 78
  6.2 Copenhagen Water Fountains ............................................................................ 78
  6.3 French Disposables Ban ..................................................................................... 78
  6.4 The Last Straw.................................................................................................... 78
  6.5 Beverage Container Deposit Refund System ...................................................... 78
  6.6 ReThink Disposable ............................................................................................ 79
  6.7 Bottled Water Ban ............................................................................................. 79
  6.8 The Freiburg Cup................................................................................................ 79
  6.9 Refill Revolution, Tennessee .............................................................................. 79
  6.10 The Mobile Water Station, Illinois ...................................................................... 80
7.0 Conclusions ............................................................................................................. 80

                                                                                                                               5
6
1.0           Introduction
The poor management of plastic waste, including its intentional discard in the
environment, leads to the annual emission to the sea of an estimated 54,000–145,000
tonnes of plastic from coastal land areas in EU countries.1 The European Commission has
proposed a headline target of
         “reducing marine litter by 30 % by 2020 for the ten most common types of litter
         found on beaches, as well as for fishing gear found at sea, with the list adapted to
         each of the four marine regions in the EU”
under the auspices of the Circular Economy Package,2 and the European Parliament have
proposed a non-binding target of 30% by 2025 and 50% by 2030 (compared to a 2014
baseline).
 Because of the enormous range of sources of marine litter, discussions to determine
how marine litter reduction can be achieved become very broad. Given the prevalence
of single-use plastic items found on beaches, and the great potential for dealing with
them at source, Seas at Risk determined this issue to be a good focal point for action.

On-the-go plastic items are those consumed while on the move in public spaces,
rather than in the home or at cafes and restaurants.
Single-use plastic items are those designed to be used once and then thrown away.

While packaging waste is addressed by the Packaging Waste Directive (94/62/EC), there
is a lack of legislation that focusses on single-use items, some of which do not come
under the definition of packaging. Similarly, although waste prevention does feature in
the Waste Framework Directive (2008/98/EC) and the Packaging Waste Directive,
because such provisions are not strong enough, there has not been sufficient movement
towards tackling single-use items.
Therefore Eunomia was commissioned by Seas at Risk to research the consumption of
single-use on-the-go plastic items, and leverage points for reducing their use.
In this report, we present the findings of desk-based research into the numbers of items
consumed in Europe and different European countries; the most prevalent items found

1
  Jambeck, J.R., Geyer, R., Wilcox, C., et al. (2015) Plastic waste inputs from land into the ocean, Science,
Vol.347, No.6223, pp.768–771
2
  European Commission (2014) Towards a Circular Economy: A zero Waste Programme for Europe.
COM(2014)398 http://eur-lex.europa.eu/legal-content/EN/TXT/?uri=celex%3A52014DC0398

                                                                                                                7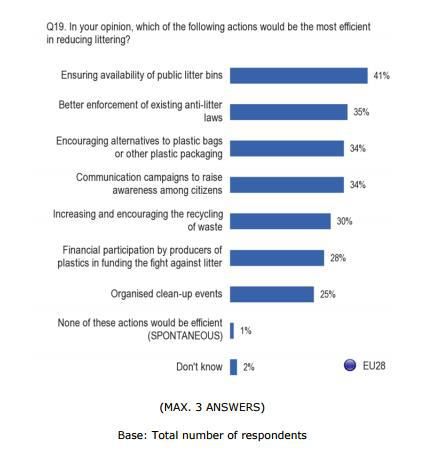
on beaches; European legislation that can be used to tackle the issue; and a variety of
research questions related to attitudes towards single-use plastic consumption, litter
and reduction measures. We also present ten case studies of initiatives to reduce the
consumption of single-use plastics and/or prevent their escape into the environment.
2.0 Item Specific Consumption Estimates
In order to arrive at EU consumption figures for commonly littered single-use plastic
items, a series of bottom-up calculations were made, in which consumption figures and
other supporting data for specific Member States were scaled up to produce estimates
for the whole EU, with consideration of the variation across the four regional seas areas 3
or representative Member States.
In the first case, a search was made for data relating to consumption of on-the-go items;
where this was not available, the search then targeted single-use items, before moving
on to general consumption figures for the items, and finally to production figures.
Based on considerations of which single-use plastic items are most commonly littered
and of those for which we anticipated reasonable data would be available, seven specific
types single-use plastic item were targeted:
Plastic bottles;
Coffee cups and lids;
Drinking straws;
Other disposable cups that contain fizzy drinks and milkshakes (and the associated
lids);
Coffee stirrers;
Takeaway packaging; and
Cigarette butts (made of cellulose acetate plastic).
The following sections briefly discuss the consumption calculation methodologies
employed for each item, before presenting the resulting estimates.
2.1 Methodology
To obtain consumption estimates for the range of single-use plastic items a number of
different methodologies were used, owing to the differences in available data pertaining
to each item type. However, a standard methodological approach was taken to
3
In Europe, there are four structures for inter-governmental co-operation which aim to bring together
Member States and neighbouring countries that share marine waters to protect the marine environment:
the Regional Sea Conventions. The ‘Regional Seas Areas’ covered are the North-East Atlantic, the Baltic,
the Mediterranean, and the Black Sea.
8identifying sources of information, and similar extrapolation techniques were used to
move from country specific to EU-wide figures.
For each item type, in the first instance an internet search was made to determine the
extent of European consumption data available for that item. In some cases data was
available for multiple countries, whereas in others it was only available for a few or just a
single country, or even just part of the market in a single country.
The scope of the consumption data available then determined the research needed to
build up the picture of consumption and scale up to an EU level. For example, when data
was only available on specific market areas, further economic data was researched in
order to scale up to country level before scaling up to EU level. Where good data was
immediately available at country level, scaling to EU level was more straightforward.
Once consumption figures were established for single countries, scaling up to EU level
was done in two ways: firstly, by national population (aged 15 and over, where
appropriate) and secondly, by gross domestic product purchase power parity (GDP PPP).
The latter is a more nuanced measure, which takes into account economic factors absent
from simple considerations of population size. Roughly speaking, it is a better measure
of ‘spending power’, taking into account both wealth and how much money can buy in
different countries. This is likely to be better correlated with the consumption of
consumer goods, especially things that aren’t ‘necessities’.
Although GDP PPP factors in economic considerations, it should be noted that the
estimates made in this report do not take account of cultural factors which influence
consumption rates in different countries. This is less of a concern where consumption
data for specific items was available for many countries when giving total EU estimates,
but where extrapolations have been made based on consumption figures for one or a
few countries there is more uncertainty around the EU-wide estimate.
In terms of how consumption rates are related to littering and marine litter, we can only
make the assumption that there is a positive correlation. We can not take into account
existing waste management practices and litter abatement measures already in place; or
different attitudes and hence propensities to litter in different countries. Research
conducted in Section 4.1 on public attitudes to littering was not able to obtain enough
data to provide country by country estimates for littering rates or any proxies of that.
2.2 Plastic Bottles
The consumption calculation for single-use plastic bottles is based on the number of PET
beverage bottles placed on the market (in terms of total sales) under the Norwegian
deposit refund system (DRS) in 2015, as published by the company which manages the
scheme, Infinitum. 4
4
Infinitum annual report 2015, Infinitum, 2015
9The Norwegian figure is 613 million bottles, all of which are single-use and many of which will have been consumed on-the-go in public spaces, with an associated risk of being littered, rather than being recycled or disposed of at home. This figure applies to bottles of between 200 millilitre and 3.5 litre sizes, because of the limits of detection of the return vending machines from which the data are obtained. If a further breakdown by size were available, we would be able to make a concrete estimate of how many of the bottles were consumed on-the-go, as we would assume that bottles between 200 and 500ml would be the ones to which this applies. At present this breakdown is not available, however. The Norwegian data was chosen because Norway publicly provides clear data on the number of PET bottles placed on the market under the DRS. As each unit placed on the market under a DRS is registered and accounted for this provides a reliable data set. Although Norway is not the only EU Member State with a DRS, it was the only one for which such a figure could be found. This figure has been scaled up for the whole of the EU in two different ways. Firstly, based on national population, and secondly, based on a measure of gross domestic product purchase power parity (GDP PPP). This later approach is more nuanced, as it takes into account the fact that different Member States display different levels of economic activity and consumption. However, it should be noted that as mentioned above in Section 2.1 this approach does not account for cultural differences between countries, such as that some may be more aware of the impacts of plastic pollution than others and so consuming less in response; or, the popularity of different products in different countries. The population figures used for the EU28 and Norway are of 1st January 2015, and come from Eurostat.5 The GDP PPP measures used are for 2015, and are also taken from Eurostat.6 The results of the consumption calculations for single-use plastic bottles are presented in Table 2-1. Table 2-1: Estimates for Single-use Plastic Bottles Consumed in the EU per Year Member State Estimate Based on Estimate Based on GDP 5 File:Demographic balance, 2015 (thousands) YB16.png - Statistics Explained, accessed 8 March 2017, http://ec.europa.eu/eurostat/statistics- explained/index.php/File:Demographic_balance,_2015_(thousands)_YB16.png 6 Statistics illustrated - Eurostat, accessed 21 March 2017, http://ec.europa.eu/eurostat/web/purchasing- power-parities 10
National Population                   PPP
                       (millions of bottles)         (millions of bottles)

Austria          1,017                         991

Belgium          1,329                         1,204

Bulgaria         854                           306

Croatia          501                           221

Cyprus           100                           63

Czech Republic   1,250                         828

Denmark          671                           649

Estonia          156                           89

Finland          649                           538

France           7,875                         6,355

Germany          9,628                         9,089

Greece           1,287                         666

Hungary          1,169                         605

Ireland          549                           740

Italy            7,209                         5,268

Latvia           236                           115

Lithuania        346                           198

Luxembourg       67                            134

Malta            51                            34

Netherlands      2,004                         1,953

Poland           4,507                         2,367

Portugal         1,230                         721

                                                                             11
Romania 2,356 1,022 Slovakia 643 377 Slovenia 245 155 Spain 5,506 3,773 Sweden 1,156 1,091 UK 7,680 6,314 TOTAL (EU28) 60,270 45,865 The resulting figures are 60bn and 46bn single-use beverage bottles consumed annually in the EU. As can be seen, the estimate based on population is higher than that based on GDP PPP. Because GDP PPP accounts for economic variability across Member States, it is likely to provide a more accurate consumption estimate, i.e. 46bn. In order to provide comparison with other types of data discussed below, i.e. based on weight, it is of interest to note that the Norwegian data contains weights associated with the number of items – the 612m bottles are assigned a weight of 22.2 thousand tonnes. This equates to an average weight of 36.3 grams per bottle, giving an equivalent mass of bottle consumption in Europe of 1.7 m tonnes. 2.3 Coffee Cups and Lids There is little information available on the consumption of single-use coffee cups in Europe; however, there are two published consumption estimates at individual Member State level. The first of these is for Germany, and comes from the environmental organisation Deutsche Umwelthilfe (DUH). According to DUH, 2.8 billion single-use coffee cups are consumed every year in Germany.7 The second estimate is for the UK, and comes from single-use coffee cup collection and recycling company Simply Cups. This figure is 2.5 billion single-use cups, and was 7 Deutsche Umwelthilfe (2015) Coffee to go-Einwegbecher-Umweltauswirkungen und Alternativen, January 2015, http://www.duh.de/uploads/tx_duhdownloads/DUH_Coffee-to-go_Hintergrund_01.pdf 12
calculated when Simply Cups started operations in 2014; since then, the 2.5 billion figure
has been reported frequently in the UK media (sometimes reported as 3 billion). 8
The UK estimate of 2.5 billion was -checked by calculating per capita consumption for the
UK population aged 15 and over. At a national consumption rate of 2.5 billion cups, UK
residents would on average be drinking 46 cups of takeaway coffee per year, at an
average rate of a cup every eight days. This seems sensible, given that many people will
not be consuming any takeaway coffees. Furthermore, it is reasonably comparable with
the slightly higher figure of 2.8 billion cups for Germany, which has an adult population
25% larger and a GDP PPP measure 19% higher (128 to the UK’s 108).
Both the German and UK figures have been scaled up for the whole of the EU by national
population (aged over 15 years) and GDP PPP, producing four different sets of results, as
presented in Table 2-2.

Table 2-2: Estimates for Single-use Coffee Cups Consumed in the EU per
Year

Member                   Based on German Figure                        Based on UK Figure
State
                  Estimate Based                                Estimate Based         Estimate
                    on National         Estimate Based          on National            Based on
                  Population over       on GDP PPP              Population over        GDP PPP
                   15 (millions of      (millions of cups)      15 (millions of        (millions of
                       cups)                                    cups)                  cups)

Austria          292                    301                     345                    409
Belgium          370                    355                     436                    481
Bulgaria         246                    93                      291                    126
Croatia          143                    67                      169                    91
Cyprus           28                     19                      33                     25
Czech            354                    249                     418                    337
Republic
Denmark          187                    192                     221                    260
Estonia          44                     26                      52                     36
Finland          182                    160                     215                    217

8
 To keep the momentum of circular economy brimming, we need to battle for the cup - The Simply Cups
blog, accessed 8 March 2017, http://www.edie.net/blog/To-keep-the-momentum-of-circular-economy-
brimming-we-need-to-battle-for-the-cup/6098093

                                                                                                      13
France 2,150 1,838 2,539 2,492 Germany 2,800 2,800 3,306 3,795 Greece 369 202 436 274 Hungary 335 184 395 249 Ireland 144 205 170 278 Italy 2,084 1,614 2,461 2,187 Latvia 67 35 79 47 Lithuania 99 60 117 81 Luxembourg 19 40 22 54 Malta 15 10 17 14 Netherlands 561 579 662 784 Poland 1,283 714 1,515 968 Portugal 354 220 418 298 Romania 667 307 788 416 Slovakia 187 116 220 157 Slovenia 70 47 82 63 Spain 1,566 1,137 1,849 1,541 Sweden 320 320 378 434 UK 2,118 1,844 2,500 2,500 TOTAL 17,053 13,732 20,133 18,614 (EU28) Like the estimates for plastic bottles, here those based on population are higher than those based on GDP PPP. GDP PPP is still likely to provide a more accurate estimate. However we see that scaling up by GDP PPP produces more divergent figures. In order to take into account both studies, we will use the midpoint of 16bn for the number of single-use coffee-cups used in a year in the EU28. Unfortunately, no data on the consumption of coffee cups lids was found to be available. While undoubtedly a high percentage of cups are served with lids, there is no way of fixing this percentage with any certainty. One approach is to make an assumption about the types of coffee outlets likely to provide lids, and use this to set a conservative lower limit. In the UK, the three largest 14
coffee shops account for around 77% of the market9, and these large retailers
customarily provide lids as a matter of course. Many of the shops comprising the
remaining 23% will also provide lids, but of course there will also be cups given out
without lids on both sides. Therefore, a 77% limit on the number of cups provided with
lids may be reasonable. Using this approach, we reach an EU wide figure of 12bn lids per
year.
However, owing to the uncertain nature of this figure, it may be preferable in the
context of messaging and campaigning to take a simpler estimate. For example, it could
be stated that over 16bn coffee cups are consumed per year and ‘the number of lids
could be as many’ or ‘at most matched by the same number of lids'.

2.4          Drinking Straws
The consumption estimate for single-use plastic drinking straws is based on an estimate
of the number of straws provided by McDonalds every day in the UK made by the
campaign group Straw Wars10. This estimate – of 3.5 million straws per day – was the
only figure available on the consumption of drinking straws in the EU, but by using
supplementary data it was possible to scale up to total straw consumption figures for the
EU28.
One supplementary dataset comprised numbers of McDonald’s restaurants by country
from statistics portal Statista11, and fast food market share figures for McDonald’s by
country from market research company Euromonitor 12. Based on the number of
McDonald’s restaurants in the UK, it was possible to calculate a per restaurant figure for
straw consumption which could be used as an average straws-per-restaurant figure for
other countries. Then, using the market share data, it was possible to calculate the
numbers of straws provided by McDonalds in 13 Member States (i.e. those for which
market share data was available. These member states were those where McDonald’s
was the market leader). Working on the assumption that other businesses in the fast
food sector distribute straws in the same manner as McDonalds, this could then be
scaled up to represent the total numbers of straws provided across the fast food sector
annually.
The consumption calculation for single-use plastic drinking straws in each Member State
can thus be summarised as:

9
  Starbucks Trails Costa in Booming U.K. Coffee-Shop Market: Chart - Bloomberg, accessed 22 March 2017,
https://www.bloomberg.com/news/articles/2016-02-04/starbucks-trails-costa-in-booming-u-k-coffee-
shop-market-chart
10
   Straw Wars, accessed 22 March 2017, http://strawwars.org/
11
   McDonald’s: restaurants by country Europe 2016 | Statistic, accessed 22 March 2017,
https://www.statista.com/statistics/256044/mcdonalds-restaurants-in-europe/
12
   Fast food restaurant industry market research, trends, statistics, accessed 22 March 2017,
http://www.euromonitor.com/fast-food

                                                                                                     15
Total straws = (100 / McDonald’s market share) * number of straws provided by
McDonald’s nationally
The results of the consumption calculations for single-use plastic drinking straws are
presented in Table 2-3.
Table 2-3: Estimates for Single-use Drinking Straws Consumed on the Fast
Food Market per Year
Estimate of Straws Consumed
Member State
(billions of straws)
Germany 4.8
France 3.2
UK 8.5
Italy 2.0
Poland 1.2
Netherlands 1.1
Sweden 1.0
Czech Republic 0.3
Hungary 0.6
Denmark 0.3
Romania 0.2
Bulgaria 0.3
Slovakia 0.1
TOTAL 23.5
One possible approach to filling in the data gaps for the remaining 15 Member States
would be to apply a scaling up by GDP PPP using the UK consumption figure of 8.5
billion. The results of this calculation are presented in Table 2-4.
16Table 2-4: Estimates for Single-use Drinking Straws Consumed on the Fast
Food Market per Year Based on GDP PPP
Estimate Based on GDP PPP
Member State
(billions of straws)
Austria 1.34
Belgium 1.62
Croatia 0.30
Cyprus 0.08
Estonia 0.12
Finland 0.73
Greece 0.90
Ireland 1.00
Latvia 0.15
Lithuania 0.27
Luxembourg 0.18
Malta 0.05
Portugal 0.97
Slovenia 0.21
Spain 5.09
TOTAL 13
The second set of estimates for 15 Member States based on GDP PPP total a figure of 13
billion, and the first set of estimates for the 13 Member States based on McDonald’s
market share totals over 23.5 billion. We may assume that fast food of this kind is not as
popular or of a slightly different nature in the second set of 15 Member States; the fact
that these MS are where McDonalds is not the dominant share of the market
corroborates this assumption., The spending power of individuals in these countries is
also generally not as great. Therefore the estimate produced is not as large. However, it
should be noted that, as elsewhere, the GDP PPP calculation cannot account for cultural
17factors which may play a part here, for example the motivation for some consumers with
more purchase power to choose more expensive healthy eating options, and so spend
less on fast food, which would lead to an overestimation of consumption for the
countries with higher GDP PPP and underestimation for countries with lower GDP PPP.
This gives a total EU figure of 36.5 billion plastic drinking straws consumed annually.
While not all of these straws will be consumed on-the-go (some will be consumed in
restaurants) they will nevertheless all be single-use items.
2.5 Other Disposable Cups
No data specific to other disposable cups (i.e. not coffee cups, such as those containing
fizzy drinks and milkshakes) or the associated lids was available. In lack of specific data, it
seems reasonable to simply go on the numbers for drinking straws discussed above, and
assume that for every single-use plastic drinking straw consumed at a fast-food
restaurant, one disposable cup is consumed.
While some of these cups will be provided without lids, there is no way of reaching an
estimate on this point. Therefore, we will simply make a conservative assumption that
two-thirds are provided with lids, based on a figure slightly below that reached for coffee
cup lids. The statement could also be made, as per coffee cup lids, that “up to 36.5bn lids
for soda cups are consumed each year in the EU”.
The results of this approach are presented in Table 2-5.
Table 2-5: Estimates for Other Disposable Cups and Associated Lids
Consumed in the EU28 on the Fast Food Market per Year
Associated Lids
Other Disposable Cups
(number of lids)
(number of cups)
36.5 bn 24 bn
2.6 Coffee Stirrers
No data specific to coffee stirrers was available. Given the lack of specific data, one
approach to reaching an estimate would simply be to make an assumption about the
percentage of the approximately 16 billion coffee cups consumed annually in the EU
which are provided with a stirrer. However, it has not been possible to find any basis
upon which such an assumption could be made.
It should also be considered that, at least concerning the large coffee shop retailers,
stirrers will not typically be taken out of store, and so are less likely to be littered on the
street. There is also no way of forming an estimate of the percentage of cases in which
stirrers are typically handed out the customers.
182.7 Takeaway Packaging
The consumption estimate for single-use plastic takeaway packaging assumes that this
kind of packaging (e.g. polystyrene ‘clamshells’ and polypropylene containers) is
primarily provided by small fast food businesses. The big players on the European fast
food market (McDonalds, Subway, KFC13) and similar large businesses typically do not
provide their food in plastic packaging, but instead use branded packaging made of
paper and card. The kinds of businesses responsible for providing plastic takeaway
packaging are rather the small and independent business such as kebab houses, chip
shops, and other takeaways serving global cuisines to go. Data on small and medium
sized enterprises (SMEs) from the DATA.GOV.UK website was used to estimate the
percentage of these fast food meals and takeaways provided by small takeaway
businesses14. This was done by calculating the percentage of UK restaurant turnover for
2009 accounted for by businesses with between one and nine employees (29.3%). It
should be noted, however, that the standard industrial classification (SIC) code under
which restaurants are grouped in UK Government data also includes hotels, and there is
unfortunately no way of separating out the two sectors in the data. However, simply
based on the size of staff, utilising the SME grouping would rule out a large number of
such establishments.
It is also important to note that this approach leaves out plastic packaging provided by
large retailers such as EAT and Pret A Manger for food items such as sandwiches and
salads. Although making a sizable contribution to plastic packaging consumption, as
there is no way of determining the market share of these ‘healthy’ take-away retailers
among UK restaurants, it has unfortunately not been possible to include them.
A 2015 report from Cancer Research puts the number of fast food meals and takeaways
consumed in the UK every week at 22 million. 15 This small business turnover share was
then applied to a yearly consumption figure of 1.14 bn (scaled up from the weekly
figure) to reach a figure for the number of fast food meals and takeaways provided every
year by small businesses – many of which will be consumed off premises and on-the-go.
At this point, a figure for the number of fast food meals and takeaways consumed from
small business per person per year in the UK was calculated in order to provide a
multiplication factor which with to reach consumption estimates for the rest of the EU
based on population size. In addition, a comparable figure for UK consumption relative
13
Daily chart: Fast-food nations | The Economist, accessed 22 March 2017,
http://www.economist.com/fastfood
14
2009 edition tables - Resources, accessed 21 March 2017,
https://data.gov.uk/dataset/small_and_medium_sized_enterprise_statistics_sme_for_the_uk_and_region
s/resource/8cad0444-9ce7-4614-87d7-6d192767b72a
15
Cancer Research UK (2015) A Weighty Issue, A Study of UK Adult’s Consumption Behaviours, Knowledge
of Calorie and Added Sugar Guidelines and Physical Activity Levels, March 2015,
https://www.cancerresearchuk.org/sites/default/files/a_weighty_issue_full_report.pdf
19to UK GDP PPP was also calculated to allow for EU estimates based on national GDP PPP
to be made.
The results of both calculations are presented in Table 2-6.
Table 2-6: Estimates for Takeaway Packaging Consumed in the EU28 per
Year
Member State Estimate Based on Estimate Based on GDP
National Population over PPP
15 (millions of takeaway
(millions of takeaway containers)
containers)
Austria 46 55
Belgium 59 64
Bulgaria 39 17
Croatia 23 12
Cyprus 4 3
Czech Republic 56 45
Denmark 30 35
Estonia 7 5
Finland 29 29
France 340 334
Germany 443 509
Greece 58 37
Hungary 53 33
Ireland 23 37
Italy 330 293
Latvia 11 6
Lithuania 16 11
Luxembourg 3 7
Malta 2 2
Netherlands 89 105
Poland 203 130
Portugal 56 40
Romania 106 56
20Slovakia 30 21
Slovenia 11 8
Spain 248 207
Sweden 51 58
UK 335 335
TOTAL 2,699 2,496
As can be seen, the results based on GDP PPP are quite similar to those based on
population. The final estimate is of the consumption of 2.5 bn plastic takeaway
containers per year in the EU28.
2.8 Cigarette Butts
Cigarette butts are made from a synthetic plastic fibre called cellulose acetate. One
consumption estimate for cigarettes is based on Eurostat data for the population aged
15 and over, 16 combined with data from campaign group Tobacco Atlas on the average
number of cigarettes smoked per person over 15 years of age per year by country. 17
The results of this calculation are presented in Table 2-7.
16
Population and population change statistics - Statistics Explained, accessed 20 March 2017,
http://ec.europa.eu/eurostat/statistics-
explained/index.php/Population_and_population_change_statistics
17
Cigarette Use Globally | The Tobacco Atlas, accessed 20 March 2017,
http://www.tobaccoatlas.org/topic/cigarette-use-globally/
21Table 2-7: Estimates for Cigarettes Consumed per Year
Member State Estimate of Cigarettes Per capita*
Consumed (number of cigarettes)
(billions of cigarettes)
Austria 15 1,988
Belgium 22 2,352
Bulgaria 9 1,505
Croatia 6 1,709
Cyprus 1 1,688
Czech Republic 20 2,194
Denmark 7 1,378
Estonia 2 1,775
Finland 5 1,083
France 54 993
Germany 106 1,480
Greece 19 2,086
Hungary 15 1,759
Ireland 3 954
Italy 76 1,443
Latvia 2 1,041
Lithuania 3 1,124
Luxembourg 1 2,284
Malta - -
Netherlands 20 1,396
Poland 45 1,396
Portugal 10 1,113
Romania 27 1,620
Slovakia 8 1,618
Slovenia 5 2,637
Spain 50 1,265
Sweden 7 831
UK 44 827
Total 580 –
22*Per capita amongst the total population over 15
A second source of information is the number of cigarettes released from bonded
warehouses for sale across the European Union. Country by country data is not as
relevant here as the figures do not fully reflect consumption, as they do not take cross-
border movement into account. The total number of cigarettes according to this is 493
bn.18 The lower figure perhaps goes some way to reveal the extent of illegal trade in
tobacco products; already the consumption figures might be expected to be
underestimated by smokers who may not be completely honest about their
consumption. Therefore we will use the consumption figures.
While cigarettes are single-use items, not all of them will be consumed on-the-go, and
therefore these figures relate only to single-use consumption. A conservative estimate of
the proportion of cigarette butts consumed on the go which are discarded as litter would
be around 60%.19 However, because we do not know what proportion of cigarettes are
consumed on the go (and this would vary widely country to country based on climate
and implementation of smoking bans, for example), we are not able to estimate the
number of cigarette butts discarded as litter.
Country by country, we see a wide range of variation in cigarette consumption per
capita, with Slovenia and Belgium scoring the highest with 2,637 and 2,352 per capita
per year; and Sweden and the UK coming at the bottom of the league with 831 and 827
respectively. We can expect the littering risk for these items to be proportionate.
2.9 Eurostat – Prodcom Data
The EU publishes lists of materials and products that are produced and traded within
Europe via the Prodcom database.20 The most recent Prodcom data is from 2015. As
stated on the website, the majority of product codes correspond to a combination of
products that have been grouped together. This presents a challenge when attempting
to obtain statistics with the correct scope from the data. As reported above, packaging is
the main driver of plastics demand in Europe but unfortunately the Prodcom data does
not differentiate plastic items on this basis.
Searching for plastic within the Prodcom database returns over 140 different coded
items. Only two of these are particularly relevant to single use items: these two are
defined as “plastic carboys,21 bottles, flasks and similar articles with a capacity of 2 litres
18
http://ec.europa.eu/taxation_customs/sites/taxation/files/resources/documents/taxation/excise_duties/t
obacco_products/tobacco_products_releases-consumption.pdf
20
Available here: http://ec.europa.eu/eurostat/web/prodcom/data/database
21
A carboy is a container for liquids
23or less” and “plastic stoppers, lids, caps, capsules and similar articles”. Other categories
are often too broad to attempt to estimate what proportion constitutes packaging.
Tracking down individual items such as cups, straws, coffee stirrers and takeaway
packaging was therefore also not possible via this method.
The table below shows the total number of items used within each EU country for the
bottles category. Figures for production were not available on the Prodcom database,
but as stated previously Europe is a net exporter of plastic, so it is the amount of plastic
consumed that is most relevant. The total figure of 120 billion is more than the sum total
of all the values displayed below. It is presumed by the researchers that this discrepancy
of over 14 billion more items in the EU-28 total is due to the Prodcom statisticians
creating a weighted total to account for the missing values from Cyprus, Germany,
Ireland, Luxemburg and Malta.
Table 2-8: Number of plastic carboys, bottles, flasks and similar articles
with a capacity of 2 litres or less consumed in 2015
Countries Consumption (no. of items) Per capita
consumption (no. of
items)
Austria 6,752,462,720 776
Belgium 5,455,793,731 483
Bulgaria 1,753,326,215 245
Croatia 473,455,000 113
Cyprus - -
Czech Republic 6,606,816,000 626
Denmark 811,826,033 142
Estonia 56,985,100 43
Finland 137,615,352 25
France 14,344,311,244 215
Germany - -
Greece 923,748,158 86
Hungary 2,235,730,000 227
Ireland - -
Italy 16,536,872,223 273
Latvia 76,734,098 39
Lithuania 3,525,300,507 1,220
Luxemburg - -
Malta - -
Netherlands 2,658,568,000 157
Poland 4,930,000,000 130
Portugal 1,711,253,086 165
Romania 1,250,788,744 63
Slovakia 457,952,635 84
Slovenia 267,603,056 130
24Spain 15,280,557,000 329
Sweden 191,111,900 19
United Kingdom 19,071,831,000 292
EU28TOTALS 120,000,000,000 Average: 207
The table below shows the total quantity of items used within each EU country by weight
in kilograms, for the lids category. This means it is not possible to directly compare the
quantity of plastic lids with plastic bottles detailed in the table above. Once again, figures
for production were not available so the table shows plastic consumption. The total
figure of just under 2.5 million tonnes is more than the sum total of all the values
displayed below. It is presumed by the researchers that this discrepancy of over 620
thousand tonnes is due to the Prodcom statisticians creating a weighted total to account
for the missing values from Austria, Cyprus, Latvia, Luxemburg, Malta, Netherlands,
Slovenia and the UK
Table 2-9: Quantity of plastic stoppers, lids, caps, capsules and similar
articles consumed in 2015
Countries Consumption (kg)
Austria -
Belgium 55,488,024
Bulgaria 4,583,471
Croatia 304,000
Cyprus -
Czech Republic 13,862,135
Denmark 6,683,205
Estonia 669,200
Finland 216,442
France 173,902,886
Germany 429,665,469
Greece 13,624,943
Hungary 49,509,000
Ireland 515,956,219
Italy 342,961,000
Latvia -
Lithuania 3,927,645
Luxemburg -
Malta -
Netherlands -
Poland 58,673,000
Portugal 683,430
Romania 9,150,377
25Slovakia 10,241 Slovenia - Spain 175,223,000 Sweden 16,842,400 United Kingdom - EU28TOTALS 2,495,907,354 The extent to which we are able to utilise this data is limited, firstly because the groupings are so broad; while we might be happy to assume that most of these containers and lids would be single use, we cannot make a judgement about what proportion might be consumed on-the-go. Secondly, where units are in weight, they do not allow us to compare them easily to the figures obtained from industry estimates on ‘number of items’. For this reason, we have not looked at the historic data set. However an interesting comparison may be made by taking the bottles figure (120bn) provided by the Prodcom database and the figure we have extrapolated for the EU from Norway’s deposit return system data – 46 bn. This helps us to sense-check the figure obtained and provide an indication of what proportion of bottles, approximately, are likely to be beverage containers, and hence more likely to be both single use and on-the- go items – about 40%. For the ‘bottles’ category, we calculated per capita consumption, so that country by country variation could be assessed – with a view to revealing differing attitudes. From a low of 19 for Sweden and 1,220 for Lithuania, and an average of 207 EU-wide, the wide variation is probably more indicative of the places where manufacturing/bottling takes place in the European Union. 2.10 Plastic Production In order to understand future trends in the production of single-use items, data on historic plastic production, the contribution of packaging demand to this, and future trends, are assessed and presented. Plastics Europe have been producing annual reports on the state of the plastics market within Europe since 2010. The quantity of plastic produced in Europe has fluctuated over the last 6 years, largely due to the recession that hit in 2009. This was particularly notable between 2011 and 2012 which saw a decrease of 3% in plastics production. 22 As a net exporter of plastic and plastic products Europe accounted for 18.5% of the world’s total production in 2015; which is a reduction on the 20.4% it contributed in 2011. In the period from 2010-15 Europe has exported an average of 11 million tonnes of plastic to the rest of the world per year; and an average of 47 million tonnes is consumed within Europe (The figures on plastic demand for packaging included in the table are useful to 22 Plastics – the Facts 2013 An analysis of European latest plastics production, demand and waste data - http://www.plasticseurope.org/Document/plastics-the-facts-2013.aspx 26
consider here, as it includes single-use items such as plastic beverage bottles, cups and
takeaway boxes. It gives an indication of the large extent to which packaging is
contributing to plastic demand and in turn, consumption of plastic items.
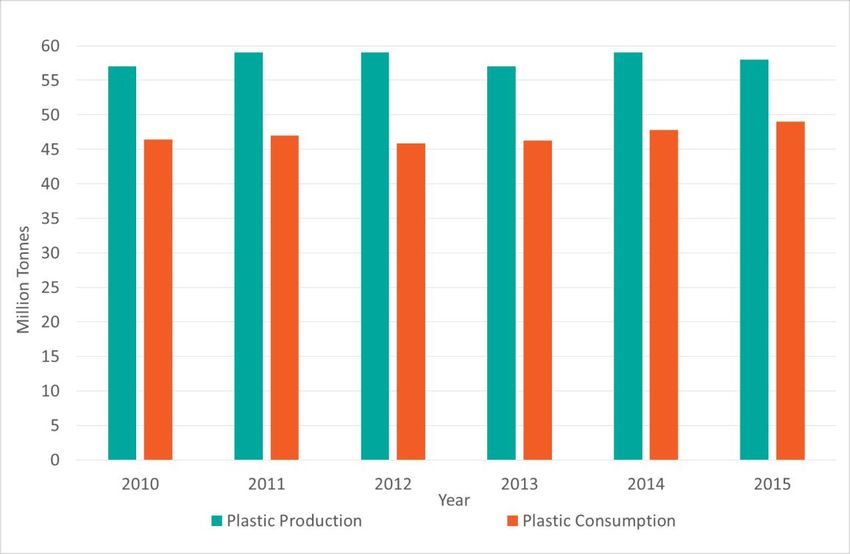
Table 2-10). The table below shows the changing levels of plastic production and
consumption within Europe since 2010, in more detail.
The figures on plastic demand for packaging included in the table are useful to consider
here, as it includes single-use items such as plastic beverage bottles, cups and takeaway
boxes. It gives an indication of the large extent to which packaging is contributing to
plastic demand and in turn, consumption of plastic items.
Table 2-10: Plastic production and use within the EU
Year Plastic Production Plastic Consumption Plastic demand that is
(million tonnes) (million tonnes) packaging
2010 57 46.4 39%
2011 59 47.0 39.4%
2012 59 45.9 39.4%
2013 57 46.3 39.6%
2014 59 47.8 39.5%
2015 58 49.0 39.9%
Each report Plastics Europe publishes shows figures for the previous year, so the most recent 2016 report
gives figures for 2015. Some figures are subsequently revised so may be marginally different to those
originally reported.
27Figure 1: Plastic production and consumption within Europe The six biggest consumers of plastic within Europe are Germany (24.6%), Italy (14.3%), France (9.6%), Spain (7.7%), the UK (7.5%) and Poland (6.3%) which make up 70% of total demand.23 Plastic consumption in different countries is likely to be a reflection of the manufacturing base; we do not think that Germany’s dominance in terms of plastic consumption according to these statistics reflects a similar prevalence in terms of single- use, on-the-go plastic consumption, because it includes the plastic used by manufacturers of plastic items. However, it is useful to understand that consistently, around 40% of consumption is used for packaging, equating to around 19 million tonnes per year. Given our estimate of 46 bn single-use, (mostly) on-the-go bottles consumed in the EU per year, weighing a total of 1.7 m tonnes, this accounts for approximately 9% of packaging production. The trend with respect to the last few years is relatively stable despite some fluctuations – however, if we look at a longer time series (Figure 2) we can see that plastics production increased by a huge amount since the material’s initial years of use (plastics entered into general mass use around the 1950s).24 After year on year increase in production, we only see a decrease in 2008, attributable to the reduction in demand caused by the global economic crisis of 2007–2008. Its use is not expected to decrease and, by extrapolating the data shown here, we can predict that it could reach 76 m tonnes by 2025; other industry estimates state plastics 23 Plastics – the Facts 2016 An analysis of European latest plastics production, demand and waste data http://www.plasticseurope.org/Document/plastics---the-facts-2016- 15787.aspx?Page=DOCUMENT&FolID=2 24 Plastics Europe (2013) Plastics - the Facts - 2013 28
production could double by 2035 and quadruple by 2050.25 It is reasonable to assume
that plastics production is correlated with the consumption of single-use on-the-go
plastic items, given the large proportion of plastics demand attributed to packaging and
in turn single use plastics. These items are correlated with increased waste generation
(given the items have such a short lifespan and high turnover rate) and also littering.
Litter which is not removed from the environment by municipalities, finds its way to
waterways and the sea, through direct deposition; washed by rain or moved by wind; or
via drains. Therefore, assuming that the consumption of single-use on-the-go plastic
items and the risk of marine litter generation are correlated with plastic production, in
the future we are looking at significant amounts of marine litter accumulation in the sea
and, potentially, increasing annual input inflating the extent of accumulation even more.
We can expect the contribution of all kinds of single-use on-the-go plastic items to
marine litter to be influenced by these trends.
The most recent report by Plastics Europe from 2016 mentions the issue of marine litter
for the first time. The report references the announcement in March 2011 of the launch
of the Global Declaration for Solutions on Marine Litter. This involves 47 plastics
associations from regions across the globe recognizing their role in fighting marine litter.
26

Figure 2: Long term historic trend in plastic production

25
   Ellen MacArthur Foundation (2016) The New Plastics Economy, 2016,
http://www.ellenmacarthurfoundation.org/assets/downloads/publications/EllenMacArthurFoundation_T
heNewPlasticsEconomy_19012016.pdf
26
   Ibid.

                                                                                              29
Source: Plastics Europe (2013) Plastics - the Facts - 2013 3.0 Prevalent Plastic Items on Beaches 3.1 Single-use plastic found as beach litter In order to provide further information about plastic items consumed and in particular, their fate, and to aid the selection of and advocacy for ‘leverage points’, the most common items of beach litter were identified through assessing data from beach cleaning and monitoring activities. Data from different surveys was assessed to give an insight into the main sources of beach litter and any regional variations. Using the consumption figures estimated above, we then explored correlations with beach litter composition. 3.2 Review of the International Coastal Clean-up data One of the most comprehensive global data sets available for beach debris counts comes from the Ocean Conservancy, who every year use over 700,000 volunteers across 153 countries to count and categorise with a standardised data recording method, what they 30
find as part of their “International Coastal Clean-Up27” (ICC). The full dataset is available
for 2015 and displays the top ten most common items found worldwide, with totals from
each participating country.
Across all the European countries that participated in the ICC (of which there are 19), the
table below shows the percentages of the ten most prevalent items found. Items
assessed in the previous sections are highlighted - the single-use plastic items, used
outside the home for which we attempted to estimate consumption figures. These
represent 37.3% of the total number of littered items. As shown, cigarette butts are the
most commonly littered item.
Table 3-1: European Plastic Beach Litter Composition: ICC Data 2015
Item Type % European Total Items per 100m
Cigarette Butts 21.1 37
Plastic Bottle Caps 6.5 11
Food Wrappers 5.4 9
Plastic Beverage Bottles 4.9 8
Straws/ Stirrers 3.5 6
Metal Bottle Caps 1.5 3
Other plastic bags 1.4 2
Plastic Grocery Bags 1.3 2
Plastic Lids 1.3 2
Glass Beverage Bottles 1.0 2
Other 52
To illustrate the regional differences between single-use plastic item prevalence the
same data is shown below for each of the Regional Sea Conventions.
North East Atlantic: Single-use plastic items under consideration in this study
account for 26% of the total number of beach litter items recorded in the 2016
ICC report.
o Most Prevalent Item: Cigarette Butts
Black Sea: Single-use plastic items under consideration in this study account for
84% of the total number of beach litter items recorded in the 2016 ICC report.
27
Ocean Conservancy (2016) 30th Anniversary International Coastal Clean-up: 2015 Global Ocean Trash
Index, accessed 10 March 2017, http://www.oceanconservancy.org/our-work/marine-debris/2016-data-
release/2016-data-release-1.pdf
31o Most Prevalent Item: Cigarette Butts
Mediterranean: Single-use plastic items under consideration in this study account
for 43% of the total number of beach litter items recorded in the 2016 ICC report.
o Most Prevalent Item: Cigarette Butts
Baltic Sea: Single-use plastic items under consideration in this study account for
57% of the total number of beach litter items recorded in the 2016 ICC report.
o Most Prevalent Item: Cigarette Butts
As we can see, across all Regional Seas areas, cigarette butts are the most commonly
littered item according to the ICC report.
Table 3-2: Regional Seas Plastic Litter Composition: ICC Data 2015
Item Type Black Sea Mediterranean North Eastern Baltic
Atlantic
Cigarette Butts 43% 24% 14% 54%
Plastic Bottle Caps 22% 6% 5.4% 1%
Plastic Beverage
9% 5% 3% 0%
Bottles
Straws and Stirrers 11% 6% 2% 1%
Plastic Lids 0% 3% 1% 1%
Other 16% 57% 74% 43%
As part of the ICC Report, the Ocean Conservancy also collected data on the amount of
litter collected and length of the beach the litter was collected along. This means that for
each of the Regional Seas areas, a figure for the number of items per 100m of beach can
be calculated that is comparable between the areas.
Figure 3 shows what we can tell about the littering intensity of different types of beach
litter in different regions. Cigarette litter seems to be heavily concentrated in the Black
Sea, which also has a prevalence of bottle caps, these figures are especially high when
compared to the European total. The data also indicates that the Mediterranean and the
North-East Atlantic have less cigarette-based beach litter by comparison.
32Figure 3: Number of Items Found per 100m of Surveyed Beach
700
625
600
500
400
313
300
200
156
125
98
100
8 11 2 2 1 3 3 2 1 3 2 0 0 1 1
0
cigarette butts plastic beverage plastic bottle caps straws and stirrirs plastic lids
bottles
North Eastern Atlantic Black Sea Mediterranean Baltic
One of the main issues with the ICC’s approach of aggregating together the total items
collected from all beach cleaning exercises worldwide, is that by doing so an artificial
weighting is created28. This is true with these conclusions regarding the Regional Seas’
beach litter, as not all of the Member States participated in the ICC, and individual
countries in the region can have a disproportionate influence over the final result,
preventing a full and accurate regional picture from being built.
This is especially concerning for the Black Sea’s data, as results are from only 300 people
across a 1.6km stretch of beach in Romania, compared to the Mediterranean’s data,
where over 4,500 people across 589km of beach participated. Therefore results are not
accurate enough to give a firm conclusion as to regional differences in beach litter
composition. This may also explain the extreme nature of the Black Sea’s results in
Figure 1, when compared to the other Regions.
28
Eunomia Research & Consulting (2016) Study to support the development of measures to combat a
range of marine litter sources, Report for European Commission DG Environment, 2016
333.3 Review of Arcadis Data In 2012, Arcadis was commissioned by DG Environment to assess marine litter data across the four European Regional Seas Areas. 29 The data for the whole EU area was collated in the latest marine litter report from the JRC30 and is reproduced in Table 3-3. Arcadis collated data sets predominately dating between 2012-2013 that were collected according to the OSPAR methodology and item categories, from projects such as the ARCADIS ‘4 seas’ pilot study and the MARNOBA project. Sampling screenings were of 100 meter strips of beach. Table 3-3: Sum of Beach litter composition, EU, Arcadis 2012 Item type Average number/100m Cigarette butts 461 Plastic/polystyrene pieces 2.5 cm > < 50cm (total) 225 Caps/lids (total) 209 Drink bottles (total) 186 Cutlery/trays/straws (total) 143 Crisp/sweet packets and lolly sticks (total) 138 plastic/polystyrene pieces 0-2,5 cm 81 String and cord (diameter less than 1 cm) 68 Cotton bud sticks 62 Drink cans 55 Source: Arcadis (2014) Marine Litter Study to Support the Establishment of an Initial Quantitative Headline Reduction Target, Report for DG Environment Assessed by Regional Seas areas the results diverge somewhat (Table 3-4). Notable examples include cutlery, trays and straws, which are hugely prevalent in the Mediterranean but nowhere else. Cigarette butts are reasonably dominant in all areas except in the North Sea. Results for cigarette butts are broadly in line with the ICC data, 29 Arcadis (2014) Marine Litter Study to Support the Establishment of an Initial Quantitative Headline Reduction Target, Report for DG Environment, 2014, http://ec.europa.eu/environment/marine/good- environmental-status/descriptor-10/pdf/final_report.pdf 30 European Commission JRC (2016) Marine Beach Litter in Europe - Top Items 34
You can also read