Platinum International Health Care Fund - Dr. Bianca Ogden, Portfolio Manager 17 June 2021 - Platinum Asset Management

Page created by Juan Francis
 
CONTINUE READING
Platinum International Health Care Fund - Dr. Bianca Ogden, Portfolio Manager 17 June 2021 - Platinum Asset Management
Platinum International Health Care Fund

Dr. Bianca Ogden, Portfolio Manager

17 June 2021

Platinum Investment Management Limited ABN 25 063 565 006 AFSL 221935
Platinum International Health Care Fund - Dr. Bianca Ogden, Portfolio Manager 17 June 2021 - Platinum Asset Management
Investing Framework

     Companies: People make a difference, not financial ratios

     Deep analysis: Look well beyond TAM, catalysts, fads and schematics

     Engage: Talk and LISTEN to real people doing the actual work

     Independence: Think and value for ourselves, avoid the crowd

     Crowd: Understand where the “Street” is

2   Source: Platinum. “TAM” refers to Total Addressable Market.
Platinum International Health Care Fund - Dr. Bianca Ogden, Portfolio Manager 17 June 2021 - Platinum Asset Management
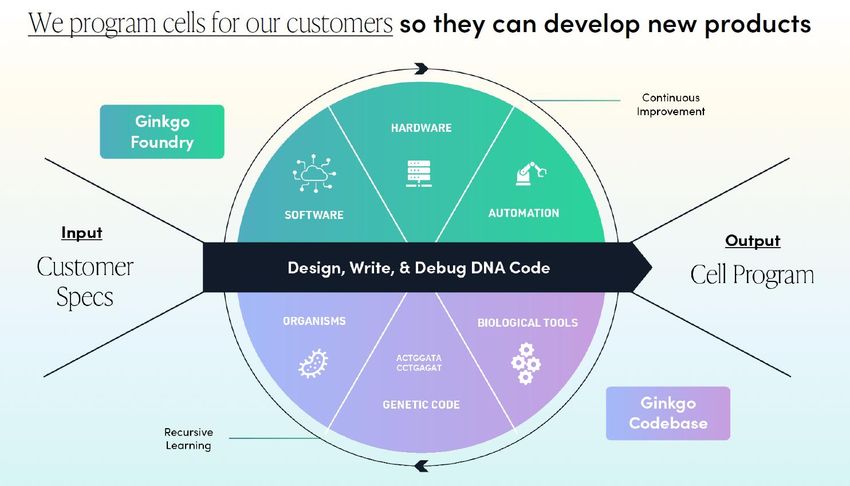
Biotech: mRNA, an example

                                                                                                                                                                                                      1,600
                                                                                                                                                                                                BioNTech
                                                                                                                                                                                                      1,400

                                                                                                                                                                                                              Share Price Index (100 at company IPO)
                                                                                                                                                                                                      1,200

                                                                                                                                                                                                     1,000
                                                                                                                                                                                               Moderna

                                                                                                                                                                                                      800

                                                                                                                                                                                                      600

                                                                                                                                                                                                      400

                                                                                                                                                                                                      200

                                                                                                                                                                                                      0
     Nov-2018         Feb-2019          May-2019           Aug-2019          Nov-2019          Feb-2020         May-2020           Aug-2020          Nov-2020         Feb-2021            May-2021

3   Source: FactSet Research Systems. Chart shows company prices indexed to 100 as at IPO price. Data current as at 8 June 2021. IPO dates are Moderna: 6/12/2018; BioNTech: 9/10/2019.
Platinum International Health Care Fund - Dr. Bianca Ogden, Portfolio Manager 17 June 2021 - Platinum Asset Management
What lies ahead?

     Biotech, Engineering and Technology will converge

     Pharma has to reimagine itself

     Precision Neurology

     Synthetic Biology

     Emergence of Asian Biotechs

4   Source: Platinum
Platinum International Health Care Fund - Dr. Bianca Ogden, Portfolio Manager 17 June 2021 - Platinum Asset Management
Engineering

             Antibody Scaffolds          RNA Interference          mRNA           Cell Therapy         Gene Therapy
                                                                                                                       Avidity, BioNTech
Recent                   Non-Antibody Scaffolds   Antisense-Conjugates           ceDNA           Gene Editing           Orchard, Merus

                                                                                                                Telix, Mersana,
                 2000s                                  Antibody-Conjugates                                     CytomX, Bioatla

                                                                Antibodies                           UCB, Innovent, Denali,
                             1990s                                                                          Alector
                                          Long-acting Protein                Antisense

                                        1980s                    Protein                 Werewolfe, Alkermes

                                                            Small molecule      Assembly, Blueprint,
                                              Pre-1980s                           Redx, BioCryst

 5   Source: Platinum
Platinum International Health Care Fund - Dr. Bianca Ogden, Portfolio Manager 17 June 2021 - Platinum Asset Management
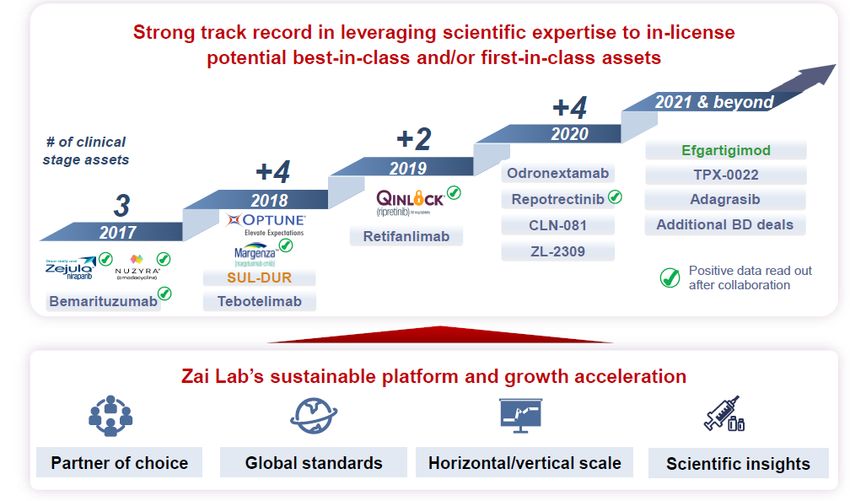
Factor VIII Hemophilia A

                                                                                             Patient as the
          Replace the Protein                Imitate             “Therapeutic”
                                                                                             Manufacturer

                                                                                       Deliver the gene
                   1950s
                                              2017                                     • Via a virus (Various)
               plasma derived
                                        Bispecific Antibody                            • non viral (GenerationBio)
                                          (Roche/Chugai)              siRNA
                  1990s
                                                              Silencing antithrombin   Deliver the mRNA
           rc F8, short half life
                                                                (Sanofi / Alnylam)     (Moderna)
                  2000s
                                                                                       Fix the mutation
          rc F8, longer half life
                                                                                       (Intellia/Regeneron)
          less immunogenicity
                                                                                       (NovoNordisk/Bluebird)

6   Source: Platinum, company website
Platinum International Health Care Fund - Dr. Bianca Ogden, Portfolio Manager 17 June 2021 - Platinum Asset Management
Cell and Gene therapies: engineering

                                     Preclinical                                      Early Clinical   Late Clinical   Marketed

7   Source: Beacon Pointe Annual Investment Forum 2020: Casdin Capital Presentation
Platinum International Health Care Fund - Dr. Bianca Ogden, Portfolio Manager 17 June 2021 - Platinum Asset Management
Biotech-Genomics-Tech conversion
                                                                                         “I think the biggest innovations of the 21st century will be at the intersection of biology
                                                                                                        and technology. A new era is beginning.” Steve Jobs (2011)
                                                                            $ 100M                                                                                                                                              14
                                        200

                                                                                                                                                                                                                                12
                                              Cost per Genome Sequenced (US$)

                                                                                $ 10M                                           Cost per Genome
    Share Price Index (100, Oct 2010)

                                        150                                                                                                                                                                                     10
                                                                                 $ 1M

                                                                                                                                                                                                                                     Bases (Trillions)
                                                                                                                                                                                          Volume of Publicly Shared
                                                                                                                                                                                               Genomic Data                     8

                                        100                                     $100K
                                                                                                                                                                                                                                6

                                                                                $10K
                                                                                                                           Pacific Biosciences                                                                                  4
                                         50                                                                                 Share Price Index
                                                                                 $1K
                                                                                                                                                                                                                                2

                                          0                                       $K                                                                                                                                            0
                                                                                        2000 2001 2002 2003 2004 2005 2006 2007 2008 2009 2010 2011 2012 2013 2014 2015 2016 2017 2018 2019 2020

                   Source: National Center for Biotechnology Information (https://www.ncbi.nlm.nih.gov/genbank/statistics/), National Human Genome Research Institute (https://www.genome.gov/about-genomics/fact-sheets/DNA-
8                  Sequencing-Costs-Data), FactSet Research Systems, data correct as at 8 June 2021. Pacific Biosciences monthly share price indexed to 100 as at 31 October 2010.
                   Past performance is not a reliable indicator of future returns.
Platinum International Health Care Fund - Dr. Bianca Ogden, Portfolio Manager 17 June 2021 - Platinum Asset Management
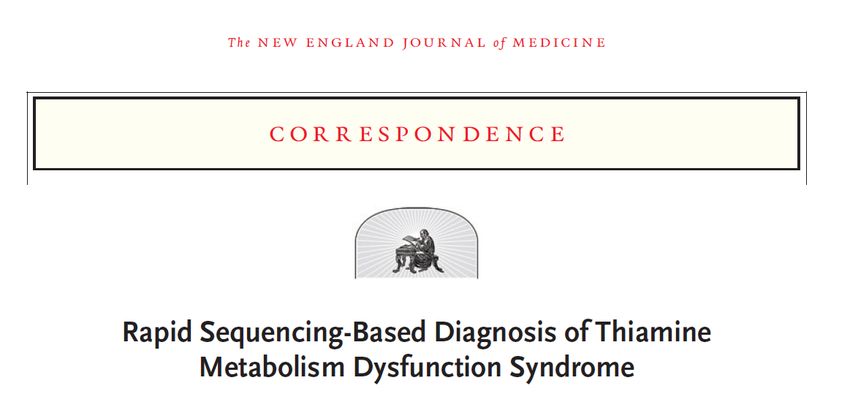
Case study in New England Journal of Medicine (3 June 2021)

     5 week old infant with inconsolable atypical crying
     Head CT scan showed issues
     10 years earlier sibling died with similar neurological presentation

                Blood draw
                Genome sequencing

                                                                              14h33min

9   Source: New England Journal of Medicine, 3/6/2021. https://www.nejm.org/doi/full/10.1056/NEJMc2100365
Platinum International Health Care Fund - Dr. Bianca Ogden, Portfolio Manager 17 June 2021 - Platinum Asset Management
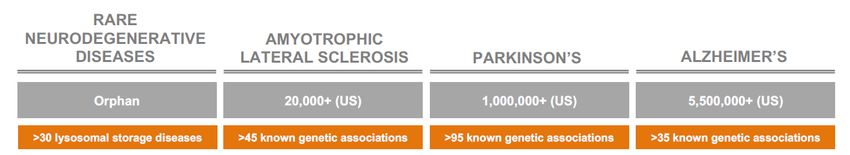
Research and development “spent” in 2020 (in US$ bn)

      Secondary US Biotech Raisings
                           US Venture Capital
                  New US Biotech Listings
                                               Roche
                                                 Pfizer
                          Bristol Myer Squibb
                                                Merck
                                            Novartis
                                              Eli Lilly
                                     AstraZeneca
                                               Sanofi
                                                  GSK
                                            Moderna
                                                   CSL
                                          BioNTech
                                                            0                         5   10            15          20   25   30   35

                                                                                               R&D Spend (US$ bn)

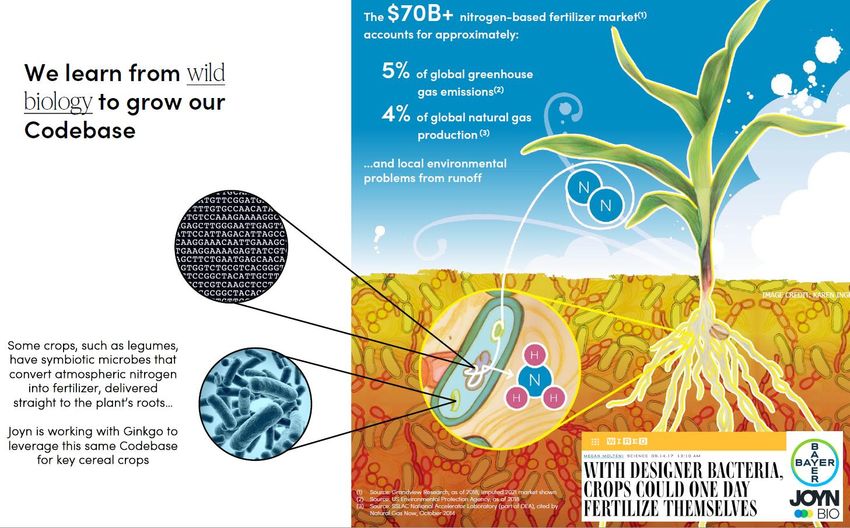
10   Source: Company filings, Jefferies Financial Group for US Biotech listing data
Synthetic Biology

11   Source: Gingko Bioworks Investor Presentation May 2021
Bayer-Ginkgo Bioworks JV: Joyn Bio

12   Source: Gingko Bioworks Investor Presentation May 2021
PIHF “Ltd.”

              Next Gen Pharma
                 China Oncology
                          Engineers
             Targeted Oncology
                       Immunology
                          Lab Tools
                         Diagnostic
                   Gene Transfer
                   Rare Diseases
                         Neurology
              Radiotherapeutics
      Contract Research Org.
                  Drug Discovery
                   Cardiovascular                                                                                                             Portfolio Composition (by stage)
                          Biosimilar                                                                                                     Biotech:                   Commercial:
                                                                                                                                           32%                         48%
                         Hepatitis B
                                                                                                                                         Exposure                    Exposure
                 Women's Health
                                         0%                     2%                     4%                      6%                        8%           10%         12%             14%

                                                                                                                     Fund Exposure (Long)

13   Source: Platinum, company websites. The categories provided cover 79% long exposure of the Fund. Data accurate as at 31 May 2021.
Platinum International Health Care Fund
     Net geographical and currency exposures as at 31 May 2021

                                                                                                                                            Europe: 22%
                                                                                                                                             Includes:
                                                                                                                                           Germany: 10%
                                                                                                                                            France: 4%
                                                                        USA: 31%                                                            Belgium: 2%
                                                                        Long: 33%
                                                                        Short: 2%

                                                                                                                                                                                                           Asia-Pac: 27%
                                                                                                                                                                                                              Includes:
                                                                                                                                                                                                         Greater China: 11%
                                                                                                                                                                                                           Australia: 10%
                                                                                                                                                                                                             Japan: 4%

                                                                                                              Major effective currency exposures
                                                    USD & HKD                          European                            AUD                              JPY                       Other Asian                    Chinese RMB
                                                            7%                             14%                              15%                              4%                              0%                          4%

     Source: Platinum. Exposure represents the fund’ s exposure to the relevant countries/regions as a % of the fund’ s total market value of investment positions, taking into account direct and indirect long
14   and short securities and derivative positions. Refer to disclaimer slide at the end of the presentation for information on long/short exposure. The currency exposure of the fund is calculated as a % of the
     fund’ s net asset value, with exposure through cash, forwards, long and short direct and indirect securities and derivative positions. Actual exposures may be changed from time to time by Platinum.
Zai Lab, founded in 2014 by Samantha Du

In 2017 PIHF owned:

Zejula: PARP inhibitor
Acquired by GSK in 2018 for $5.1b

Tumor microenviroment biotech
Bemaritzumab
Acquired by Amgen in 2021 for $1.9b

 15   Source: Company websites, Zai Lab Corporate Presentation.
Zai Lab Share Price Index

                                                                                                                                                                             1,200

                                                                                                                                                                             1,000

                                                                                                                                                                                     Share Price Index (100 at IPO)
                                                                                                                                                                             800

                                                                                                                                                                             600

                                                                                                                                                                             400

                                                                                                                                                                             200

                                                                                                                                                                             0
      Sep-2017                   Mar-2018                    Sep-2018                   Mar-2019                    Sep-2019                Mar-2020   Sep-2020   Mar-2021

16   Source: FactSet Research Systems. Zai Lab daily share price indexed to 100 as at IPO date of 20/9/2017. Data correct as at 9/6/2021.
Neurodegeneration: genetics, immune system, testing

                                                         “Engineers”                                                                              “Trial Tools”

                                                                                                                                                                    €205Mio
                         Brain Transport Vehicle                                                    Immuno Neurology                      Biobank, clinical trial
                                                                                                                                               support

                         Biogen, Takeda, Sanofi                                                  Abbvie, Innovent                                                   $2.2b

                                        $8.7b                                                                                             Biomarker detection
                                                                                                           $1.7b

17   Source: Company websites, October 2020 Denali Therapeutics Webinar: “Transporting Biotherapeutics Across the Blood-Brain Barrier”.
In Summary

      Biotech has gained speed and critical mass

      Biotech is truly global

      Biotechs are no longer reliant on “big companies”

      Biomarkers are the future sensors

      We have a long history in this sector with very deep, global understanding

18   Source: Platinum
Appendix

Platinum Investment Management Limited ABN 25 063 565 006 AFSL 221935
Platinum International Health Care Fund
     Fund overview and manager

      Launched in November 2003
      Invests in health care companies from around the world, ranging from those companies engaged in early exploratory research through to those
         providing health care services directly to consumers such as hospitals or health insurance
      Follows Platinum investment approach; index agnostic, seeks neglect, manage downside risk
      Stock analysis undertaken within a global context

                                               Dr Bianca Ogden
                                                Portfolio Manager – Platinum International Health Care Fund
                                                Joined Platinum in July 2003
                                                Prior to joining the finance industry, Bianca worked as a scientist for Johnson & Johnson Research
                                                  (Oncology) and for Novartis in Switzerland. The focus of Bianca’s post-graduate and undergraduate studies
                                                  was molecular aspects of viral diseases, such as AIDS.
                                                MBio (Tuebingen), PhD (University College London)
                                                Key to healthcare investments across Platinum

20   Source: Platinum
Platinum International Health Care Fund
     Health Care Sector Team

21   Source: Platinum, https://www.platinum.com.au/About-Platinum/the-team
Platinum International Health Care Fund
     Performance summary, as at 31 May 2021

                                                                                                     3 months        6 months          1 year         3 years        5 years         7 years          10 years Since inception
                                                                                                        (%)             (%)             (%)          (% p.a.)        (% p.a.)        (% p.a.)         (% p.a.)    (% p.a.)
                                      Platinum International Health Care Fund                             2.8             9.3           22.4            20.7           17.5            17.9             17.9             11.6
                                      MSCI AC World - Healthcare net index (AUD)                          8.7             5.2            2.2            14.2           10.4            13.3             16.2              9.5
                                      Relative return                                                    (5.9)            4.1           20.2             6.5            7.0             4.6              1.7              2.1

                                                                                                                                                                      Calendar            Fund            Index        Relative
                                                                                                                                                                       Year/s              (%)             (%)           (%)
                                                           Cumulative return based on $20,000 invested since inception
                                                                                                                                                                     2003-2007                 21.1            20.2          0.8
                                       $160,000                                                                                                                        2008                   (15.8)           (1.0)       (14.7)
                                       $140,000                    PIHF: 587.4%                                                                                        2009                     7.6            (7.4)        15.0
                                                                   MSCI: 393.3%                                                                                        2010                     6.7            (9.7)        16.4
                                       $120,000                                                                                                                        2011                     7.8             8.9         (1.1)
                                                                                                                                                                       2012                    19.6            16.3          3.3
                                       $100,000
                                                                                                                                                                       2013                    45.9            57.5        (11.7)
                                        $80,000                                                                                                                        2014                    15.6            29.1        (13.5)
                                                                                                                                                                       2015                    23.3            19.6          3.7
                                        $60,000                                                                                                                        2016                    (0.4)           (6.4)         6.0
                                        $40,000                                                                                                                        2017                    13.6            11.2          2.4
                                                                                                                                                                       2018                     8.7            13.0         (4.3)
                                        $20,000                                                                                                                        2019                    23.8            22.9          0.9
                                                                                                                                                                       2020                    30.8             4.6         26.2
                                               $0
                                                                                                                                                                       2021                    10.0             6.4          3.5
                                                    2003             2006              2009             2012             2015              2018

     Source: Platinum Investment M anagement Limited and Factset Research Systems. Fund inception date is 10 November 2003. R ef er t o disclaimer slide at t he end o f t he present at io n f o r
22   inf o rmat io n o n f und perf o rmance calculat io n and t he index. Platinum does not invest by reference to the weightings of the index. The index is provided as a reference only. P ast
     perf o rmance is no t a reliable indicat o r o f f ut ure ret urns.
Platinum International Health Care Fund
     Performance and drawdown summary since inception to 31 May 2021

                                                                                                          3 months       6 months           1 year          3 years       5 years         7 years           10 years   Since inception
                                                                                                             (%)            (%)              (%)            (% p.a.)      (% p.a.)        (% p.a.)          (% p.a.)       (% p.a.)

                                          Platinum International Health Care Fund                              2.8             9.3           22.4            20.7            17.5           17.9              17.9            11.6
                                          MSCI AC World Health Care net index (AUD)                            8.7             5.2             2.2           14.2            10.4           13.3              16.2              9.5

                                                   80%                                                                                                                                                                        800%
                                                              Platinum International Health Care Fund drawdown (LHS)
                                                                                                                                                                                                                              700%
                                                              MSCI AC World Health Care net index (AUD) drawdown (LHS)
                                                   60%                                                                                                                                                                        600%
                                                              Platinum International Health Care Fund cumulative returns (RHS)
                                                                                                                                                                                                                              500%
                                                              MSCI AC World Health Care net index (AUD) cumulative returns (RHS)

                                                                                                                                                                                                                                      Cumulative return
                                                   40%                                                                                                                                                                        400%
                                        Drawdown

                                                                                                                                                                                                                              300%
                                                   20%                                                                                                                                                                        200%
                                                                                                                                                                                                                              100%
                                                    0%                                                                                                                                                                        0%
                                                                                                                                                                                                                              -100%
                                                   -20%                                                                                                                                                                       -200%
                                                                                                                                                                                                                              -300%
                                                   -40%                                                                                                                                                                       -400%
                                                       2003           2005                2007               2009               2011                 2013              2015               2017                2019

     Source: Platinum and Factset Research Systems. R ef er t o disclaimer slide at t he end o f t he present at io n f o r inf o rmat io n o n t he f und index perf o rmance calculat io n and t he
23   index. Drawdown shows the cumulative loss at a point in time from the point of the immediately preceding performance high. Platinum does not invest by reference to the weightings of the index. The
     index is provided as a reference only. P ast perf o rmance is no t a reliable indicat o r o f f ut ure ret urns.
Platinum International Health Care Fund
     Long & short contribution to performance as at 31 May 2021

                                           1 year                                                                                          Average exposure %                                                                Contribution %

                                        Long Positions                                                                                                                      87.6                                                                   26.3
                                        Short Positions                                                                                                                     (3.4)                                                                  (1.9)
                                        Cash & FX                                                                                                                           15.9                                                                   (0.3)
                                        Total                                                                                                                             100.0                                                                    24.1

                                           3 year                                                                                          Average exposure %                                                                Contribution %

                                        Long Positions                                                                                                                      86.4                                                                   86.5
                                        Short Positions                                                                                                                     (3.9)                                                                  (2.4)
                                        Cash & FX                                                                                                                           17.5                                                                   (1.1)
                                        Total                                                                                                                             100.0                                                                    83.0

                                           5 year                                                                                          Average exposure %                                                                Contribution %

                                        Long Positions                                                                                                                      86.1                                                                 143.0
                                        Short Positions                                                                                                                     (2.9)                                                                  (2.0)
                                        Cash & FX                                                                                                                           16.8                                                                   (0.9)
                                        Total                                                                                                                             100.0                                                                  140.2

     Source: Platinum. The table represents the contribution to the fund’ s return of long and short securities, for the specified time period, taking into account direct and indirect securities and derivative positions. 'Cash & FX' represents the contribution to the fund's return of
24   physical cash and currency derivatives. Sectors are defined using the GICS framework. P ast perf o rmance is no t a reliable indicat o r o f f ut ure ret urns.
Platinum International Health Care Fund
     Fund exposure for the period 31 May 2011 to 31 May 2021

       100%

         90%
                                                                                                                                                                                                                                                                Long exposure
         80%                                                                                                                                                                                                                                                    82.3%

         70%
                                                                                                                                                                                                                                                                Net exposure
                                                                                                                                                                                                                                                                79.9%
         60%

         50%

         40%

         30%

         20%

         10%

           0%
                2011                 2012                  2013                  2014                  2015                  2016                   2017                  2018                  2019                  2020                  2021

     Source: Platinum. Exposure represents the fund’ s exposure over the specified period as a % of the fund’ s net asset value, to direct and indirect long and short securities and derivative positions. Refer to disclaimer slide at the conclusion of the presentation for information
25   on long/short exposure. Actual exposures may be changed from time to time by Platinum.
Platinum International Health Care Fund
     Long regional exposure for the period 31 May 2011 to 31 May 2021

       50%

       45%
                                                                                                                                                                                                                                                        North
                                                                                                                                                                                                                                                        America
       40%                                                                                                                                                                                                                                              33.4%

       35%
                                                                                                                                                                                                                                                        Europe
                                                                                                                                                                                                                                                        22.4%
       30%

       25%                                                                                                                                                                                                                                              Asia Ex Japan
                                                                                                                                                                                                                                                        11.3%
       20%

       15%                                                                                                                                                                                                                                              Oceania
                                                                                                                                                                                                                                                        11.0%

       10%

                                                                                                                                                                                                                                                        Other
         5%                                                                                                                                                                                                                                             4.2%

         0%
              2011                 2012                  2013                  2014                  2015                  2016                  2017                  2018                   2019                  2020                  2021

     Source: Platinum. Exposure represents the fund’ s long exposure to the relevant countries/regions over the specified time period as a % of the fund’ s total asset value, taking into account direct and indirect long securities and derivative positions. Actual exposures may be
26   changed from time to time by Platinum.
Platinum International Health Care Fund
     Long position concentration as at 31 May 2021

                                100%

                                90%
                                                                                                                                                                                                                  80.7%   82.3%
                                80%

                                                                                                                                                                       68.7%
                                70%
          Cumulative exposure

                                60%

                                50%                                                          47.5%

                                40%

                                30%              27.8%

                                20%

                                10%

                                 0%
                                                   Top                                         Top                                                                       Top                                       Top      All
                                                    10                                          25                                                                        50                                        75      86

     Source: Platinum. Cumulative exposure represents the fund's exposure to the top largest long positions in the portfolio (which includes long direct and indirect securities and derivatives) as a % of the
27   fund's gross market value.
Platinum International Health Fund
     Top 10 holdings as at 31 May 2021

                                                                                                                                        Market             Debt           Price-to-              Earnings        Price-to- Dividend
                                                                                                                  Holding
                                      Company                       Country               Sector                                 Capitalisation           (NTM*,        earnings ratio             Yield          book       yield
                                                                                                                     %
                                                                                                                                       (US$bn)            US$bn)           (NTM*)                 (NTM*)           ratio    (NTM*)

                                      SpeeDx                        Australia             Health Care                 5.0                         n/a        n/a                 n/a                 n/a              n/a            n/a

                                      Takeda
                                                                    Japan                 Health Care                 3.8                       53.6        28.9               19.4x                5.2%             1.2x           4.8%
                                      Pharmaceutical

                                      Sanofi                        France                Health Care                 3.5                      134.1         7.2               13.3x                7.5%             1.7x           3.8%

                                      Bayer AG                      Germany               Health Care                 2.7                       61.8        45.6                8.4x               11.9%             1.7x           4.0%

                                      CStone Pharma                 China                 Health Care                 2.6                         2.0       -0.3                neg                  neg             4.4x           0.0%

                                      Almirall                      Spain                 Health Care                 2.3                         3.1        0.3                29x                 3.4%             1.9x           1.4%

                                      Telix
                                                                    Australia             Health Care                 2.1                         1.0        0.0                neg                  neg             16x            0.0%
                                      Pharmaceutical
                                      Quanterix
                                                                    United States         Health Care                 1.9                         1.9       -0.2                neg                  neg             7.9x            n/a
                                      Corporation
                                      Gilead Sciences,
                                                                    United States         Health Care                 1.9                       82.9        16.5                9.5x               10.5%             4.6x           4.3%
                                      Inc.

                                      Syneos Health Inc             United States         Health Care                 1.9                         9.2        2.3               19.2x                5.2%             2.8x           0.0%

                                        *NTM: Next twelve months

28   Source: Platinum and Factset Research Systems. Dividend and earnings are Factset mean consensus estimates for the NTM . M arket capitalisation is the public market value of the company’ s listed equity. Sectors are defined using the GICS framework.
Platinum International Health Care Fund
     Top positions as at 31 May 2021: #1 SpeeDx (5%)

                                       Investment case in brief                                                                                    3 year price movement
                                                                                                                                                      1.0
                                          SpeeDX is an Australian-based molecular
                                                 diagnostics company with offices in
                                                 London and the US, and distributors
                                                 across Europe.

                                          The company specialises in diagnostic
                                                 solutions that transcend detection to offer
                                                 comprehensive information for improved
                                                                                                                                                       -
                                                 patient management.

                                          SpeeDX is unlisted for now, but given its                                                            Market Capitalisation                      Debt
                                                                                                                                                                                                                    Earnings per share (EPS)
                                                 impressive science and product pipeline,                                                             (US$bn)                          (NTM*, US$bn)
                                                                                                                                                                                                                    growth (2 year consensus
                                                                                                                                                                                                                           per annum)
                                                 we were able to take a position with some
                                                                                                                                                            n/a                               n/a                                  n/a
                                                 confidence of a good outcome.

                                                                                                                                               Price-to-earnings ratio                                                      Dividend yield
                                                                                                                                                                                    Price-to-book ratio
                                                                                                                                                       (NTM*)                                                                   (NTM*)

                                                                                                                                                            n/a                               n/a                                  n/a
                                                                                                                                               *NTM: Next twelve months

     Source: Platinum and Factset Research Systems. Dividend and earnings are Factset mean consensus estimates for the NTM . 2 year EPS growth is calculated as the annualised growth of the company’ s EPS from its last fiscally reported figure to the Factset consensus
29   estimate for the fiscal year 2 years later. M arket capitalisation is the public market value of the company’ s listed equity. The market commentary reflects Platinum’ s views and beliefs at the time of preparation, which are subject to change without notice. No representations
     or warranties are made by Platinum as to their accuracy or reliability.
Platinum International Health Care Fund
     Top positions as at 31 May 2021: #2 Takeda Pharmaceutical (3.8%)

                                       Investment case in brief                                                                                    3 year price movement
                                                                                                                                                  5,200
                                          Japanese pharma company Takeda is
                                                 unusual among its peers for its outward                                                          4,800
                                                 focus and willingness to acquire assets
                                                 offshore. Its recently announced                                                                 4,400

                                                 acquisition of Shire is an example.                                                              4,000

                                          The company has a 70 country footprint,                                                                3,600

                                                 helping it attract over 50 alliances with
                                                                                                                                                  3,200
                                                 other companies globally.

                                          Investor scepticism regarding cost cutting                                                           Market Capitalisation                      Debt
                                                                                                                                                                                                                    Earnings per share (EPS)
                                                 initiatives and a temporary lack of late                                                             (US$bn)                          (NTM*, US$bn)
                                                                                                                                                                                                                    growth (2 year consensus
                                                                                                                                                                                                                           per annum)
                                                 stage 3 trial drugs gave us the chance to
                                                                                                                                                          53.6                               28.9                                  -3%
                                                 buy this company at undemanding
                                                 valuations.
                                                                                                                                               Price-to-earnings ratio                                                      Dividend yield
                                                                                                                                                                                    Price-to-book ratio
                                                                                                                                                       (NTM*)                                                                   (NTM*)

                                                                                                                                                         19.4x                               1.2x                                 4.8%
                                                                                                                                               *NTM: Next twelve months

     Source: Platinum and Factset Research Systems. Dividend and earnings are Factset mean consensus estimates for the NTM . 2 year EPS growth is calculated as the annualised growth of the company’ s EPS from its last fiscally reported figure to the Factset consensus
30   estimate for the fiscal year 2 years later. M arket capitalisation is the public market value of the company’ s listed equity. The market commentary reflects Platinum’ s views and beliefs at the time of preparation, which are subject to change without notice. No representations
     or warranties are made by Platinum as to their accuracy or reliability.
Platinum International Health Care Fund
     Top positions as at 31 May 2021: #3 Sanofi (3.5%)

                                       Investment case in brief                                                                                    3 year price movement
                                                                                                                                                      93
                                          French pharmaceutical giant, notable for
                                                 its strong positions in diabetes medicine,                                                           88
                                                 vaccines and in emerging markets.
                                                                                                                                                      83

                                          This 'boring' pharma company has a solid                                                                   78
                                                 vaccine division and exposure to emerging
                                                 markets                                                                                              73

                                                                                                                                                      68
                                          There have been changes in the
                                                 management that should provide further
                                                 benefits over time.                                                                                                                                                Earnings per share (EPS)
                                                                                                                                                Market Capitalisation                      Debt
                                                                                                                                                                                                                    growth (2 year consensus
                                                                                                                                                      (US$bn)                          (NTM*, US$bn)
                                                                                                                                                                                                                           per annum)

                                                                                                                                                         134.1                                7.2                                  9%

                                                                                                                                               Price-to-earnings ratio                                                      Dividend yield
                                                                                                                                                                                    Price-to-book ratio
                                                                                                                                                       (NTM*)                                                                   (NTM*)

                                                                                                                                                         13.3x                               1.7x                                 3.8%
                                                                                                                                               *NTM: Next twelve months

     Source: Platinum and Factset Research Systems. Dividend and earnings are Factset mean consensus estimates for the NTM . 2 year EPS growth is calculated as the annualised growth of the company’ s EPS from its last fiscally reported figure to the Factset consensus
31   estimate for the fiscal year 2 years later. M arket capitalisation is the public market value of the company’ s listed equity. The market commentary reflects Platinum’ s views and beliefs at the time of preparation, which are subject to change without notice. No representations
     or warranties are made by Platinum as to their accuracy or reliability.
Platinum International Health Care Fund
     Top positions as at 31 May 2021: #4 Bayer AG (2.7%)

                                       Investment case in brief                                                                                    3 year price movement
                                                                                                                                                      95
                                          Bayer has had significant litigation risk
                                                 associated with the stock pertaining to                                                              84
                                                 glyposphate toxicity. Underlying this issue,
                                                 an opportunity has been brewing Bayer’s                                                              73

                                                 pharma division.                                                                                     62

                                          This was signalled to us in the form of                                                                    51

                                                 board changes, especially with old guard
                                                                                                                                                      40
                                                 members of the board with pharma
                                                 expertise leaving and the hiring of
                                                 business development powerhouse                                                                                                                                    Earnings per share (EPS)
                                                                                                                                                Market Capitalisation                      Debt
                                                 Marianne De Backer from Johnson &                                                                    (US$bn)                          (NTM*, US$bn)
                                                                                                                                                                                                                    growth (2 year consensus
                                                                                                                                                                                                                           per annum)
                                                 Johnson.
                                                                                                                                                           61.8                              45.6                                  0%

                                          Relative to the outcomes of prior litigation
                                                                                                                                               Price-to-earnings ratio                                                      Dividend yield
                                                 crisis such as the Vioxx scandal for Merck,                                                           (NTM*)
                                                                                                                                                                                    Price-to-book ratio
                                                                                                                                                                                                                                (NTM*)
                                                 the market had punished Bayer sufficiently
                                                 in our view allowing us the opportunity to                                                                8.4x                              1.7x                                 4.0%
                                                                                                                                               *NTM: Next twelve months

     Source: Platinum and Factset Research Systems. Dividend and earnings are Factset mean consensus estimates for the NTM . 2 year EPS growth is calculated as the annualised growth of the company’ s EPS from its last fiscally reported figure to the Factset consensus
32   estimate for the fiscal year 2 years later. M arket capitalisation is the public market value of the company’ s listed equity. The market commentary reflects Platinum’ s views and beliefs at the time of preparation, which are subject to change without notice. No representations
     or warranties are made by Platinum as to their accuracy or reliability.
Platinum International Health Care Fund
     Top positions as at 31 May 2021: #5 CStone Pharma (2.6%)

                                       Investment case in brief                                                                                    3 year price movement
                                                                                                                                                      16
                                          CStone is a Shanghai-based clinical-stage
                                                 biopharmaceutical company focusing on                                                                14
                                                 developing and commercializing novel
                                                 immuno-oncology and molecularly                                                                      13

                                                 targeted therapies for the treatment of                                                              11
                                                 cancers.
                                                                                                                                                        9

                                          The company uses a hybrid model that
                                                                                                                                                        8
                                                 combines internal drug discovery and
                                                 external partnership for long-term growth.
                                                                                                                                                                                                                    Earnings per share (EPS)
                                                                                                                                                Market Capitalisation                      Debt
                                          The pipeline has a nice mix of drug                                                                        (US$bn)                          (NTM*, US$bn)
                                                                                                                                                                                                                    growth (2 year consensus
                                                                                                                                                                                                                           per annum)
                                                 candidates targeting both novel and
                                                                                                                                                            2.0                               -0.3                                 n/a
                                                 clinically validated targets to support
                                                 sustainable product launches.
                                                                                                                                               Price-to-earnings ratio                                                      Dividend yield
                                                                                                                                                                                    Price-to-book ratio
                                                                                                                                                       (NTM*)                                                                   (NTM*)

                                                                                                                                                            neg                              4.4x                                 0.0%
                                                                                                                                               *NTM: Next twelve months

     Source: Platinum and Factset Research Systems. Dividend and earnings are Factset mean consensus estimates for the NTM . 2 year EPS growth is calculated as the annualised growth of the company’ s EPS from its last fiscally reported figure to the Factset consensus
33   estimate for the fiscal year 2 years later. M arket capitalisation is the public market value of the company’ s listed equity. The market commentary reflects Platinum’ s views and beliefs at the time of preparation, which are subject to change without notice. No representations
     or warranties are made by Platinum as to their accuracy or reliability.
Platinum International Health Care Fund
     Top positions as at 31 May 2021: #6 Almirall (2.3%)

                                       Investment case in brief                                                                                    3 year price movement
                                                                                                                                                      18
                                          Founded in 1943, Spanish pharmaceutical
                                                 company Almirall researches, develops,                                                               16
                                                 manufactures and markets its own
                                                 medicines as well as offering a portfolio of                                                         14

                                                 licensed products.                                                                                   13

                                          Almirall has particular strength in                                                                        11

                                                 treatments for dermatological conditions
                                                                                                                                                        9
                                                 such as psoriasis and acne and has
                                                 recently announced the acquisition of
                                                 Allergan's US dermatology portfolio.                                                                                                                               Earnings per share (EPS)
                                                                                                                                                Market Capitalisation                      Debt
                                                                                                                                                                                                                    growth (2 year consensus
                                                                                                                                                      (US$bn)                          (NTM*, US$bn)
                                                                                                                                                                                                                           per annum)
                                          We bought the stock as we saw potential
                                                                                                                                                            3.1                               0.3                                 10%
                                                 for margin expansion from new product
                                                 launches despite lacking a blockbuster
                                                                                                                                               Price-to-earnings ratio                                                      Dividend yield
                                                 drug, with milestone payments and                                                                     (NTM*)
                                                                                                                                                                                    Price-to-book ratio
                                                                                                                                                                                                                                (NTM*)
                                                 possible royalties from a deal with
                                                 AstraZeneca supporting valuation.                                                                          29x                              1.9x                                 1.4%
                                                                                                                                               *NTM: Next twelve months

     Source: Platinum and Factset Research Systems. Dividend and earnings are Factset mean consensus estimates for the NTM . 2 year EPS growth is calculated as the annualised growth of the company’ s EPS from its last fiscally reported figure to the Factset consensus
34   estimate for the fiscal year 2 years later. M arket capitalisation is the public market value of the company’ s listed equity. The market commentary reflects Platinum’ s views and beliefs at the time of preparation, which are subject to change without notice. No representations
     or warranties are made by Platinum as to their accuracy or reliability.
Platinum International Health Care Fund
     Top positions as at 31 May 2021: #7 Telix Pharmaceutical (2.1%)

                                       Investment case in brief                                                                                    3 year price movement
                                                                                                                                                      4.6
                                          Telix, based in Melbourne, is a global
                                                 biopharmaceutical company focused on                                                                 3.8
                                                 the development of diagnostic and
                                                 therapeutic products.                                                                                3.0

                                                                                                                                                      2.2
                                          Telix’s molecularly targeted radiation
                                                 products employ a radioactive isotope to                                                             1.4

                                                 attach to either an antibody or small
                                                                                                                                                      0.6
                                                 molecule that targets delivery to tumour
                                                 cells in kidney, prostate or brain cancer.
                                                                                                                                                                                                                    Earnings per share (EPS)
                                                                                                                                                Market Capitalisation                      Debt
                                          We were able to buy this well-funded                                                                       (US$bn)                          (NTM*, US$bn)
                                                                                                                                                                                                                    growth (2 year consensus
                                                                                                                                                                                                                           per annum)
                                                 Australian biotech junior at attractive
                                                                                                                                                            1.0                               0.0                                  n/a
                                                 valuations as it has been somewhat
                                                 overlooked by the market since listing in
                                                                                                                                               Price-to-earnings ratio                                                      Dividend yield
                                                 late 2017.                                                                                            (NTM*)
                                                                                                                                                                                    Price-to-book ratio
                                                                                                                                                                                                                                (NTM*)

                                                                                                                                                            neg                               16x                                 0.0%
                                                                                                                                               *NTM: Next twelve months

     Source: Platinum and Factset Research Systems. Dividend and earnings are Factset mean consensus estimates for the NTM . 2 year EPS growth is calculated as the annualised growth of the company’ s EPS from its last fiscally reported figure to the Factset consensus
35   estimate for the fiscal year 2 years later. M arket capitalisation is the public market value of the company’ s listed equity. The market commentary reflects Platinum’ s views and beliefs at the time of preparation, which are subject to change without notice. No representations
     or warranties are made by Platinum as to their accuracy or reliability.
Platinum International Health Care Fund
     Top positions as at 31 May 2021: #8 Quanterix Corporation (1.9%)

                                       Investment case in brief                                                                                    3 year price movement
                                                                                                                                                      79
                                          Quanterix is a medical devices and
                                                 diagnostics company with strength in the                                                             66
                                                 manufacture of super-sensitive equipment
                                                 for the detection of bio-markers critical in                                                         53

                                                 disease diagnosis.                                                                                   40

                                          The company's Single Molecule Array                                                                        27

                                                 (Simoa) technology platform uses single
                                                                                                                                                      14
                                                 molecule measurements to access
                                                 previously undetectable proteins.
                                                                                                                                                                                                                    Earnings per share (EPS)
                                                                                                                                                Market Capitalisation                      Debt
                                          We got the chance to buy given the                                                                         (US$bn)                          (NTM*, US$bn)
                                                                                                                                                                                                                    growth (2 year consensus
                                                                                                                                                                                                                           per annum)
                                                 company's limited life as a listed company
                                                                                                                                                           1.9                                -0.2                                 n/a
                                                 and our appreciation of the impact of the
                                                 company's devices in research
                                                                                                                                               Price-to-earnings ratio                                                      Dividend yield
                                                 applications.                                                                                         (NTM*)
                                                                                                                                                                                    Price-to-book ratio
                                                                                                                                                                                                                                (NTM*)

                                                                                                                                                           neg                               7.9x                                  n/a
                                                                                                                                               *NTM: Next twelve months

     Source: Platinum and Factset Research Systems. Dividend and earnings are Factset mean consensus estimates for the NTM . 2 year EPS growth is calculated as the annualised growth of the company’ s EPS from its last fiscally reported figure to the Factset consensus
36   estimate for the fiscal year 2 years later. M arket capitalisation is the public market value of the company’ s listed equity. The market commentary reflects Platinum’ s views and beliefs at the time of preparation, which are subject to change without notice. No representations
     or warranties are made by Platinum as to their accuracy or reliability.
Platinum International Health Care Fund
     Top positions as at 31 May 2021: #9 Gilead Sciences, Inc. (1.9%)

                                       Investment case in brief                                                                                    3 year price movement
                                                                                                                                                      88
                                          A large biotechnology company with a
                                                 virology focus (HIV and HCV) as well as                                                              82
                                                 growing cell therapy division in oncology.
                                                                                                                                                      76

                                          Rapid success of its anti-HCV drugs was                                                                    70
                                                 also the company's weakness. Gilead is
                                                 gradually progressing its pipeline while at                                                          64

                                                 the same time looking for external
                                                                                                                                                      58
                                                 opportunities.

                                          Significant management changes have                                                                  Market Capitalisation                      Debt
                                                                                                                                                                                                                    Earnings per share (EPS)
                                                 now happened and a new CEO is now in                                                                 (US$bn)                          (NTM*, US$bn)
                                                                                                                                                                                                                    growth (2 year consensus
                                                                                                                                                                                                                           per annum)
                                                 charge to prepare the company for the
                                                                                                                                                           82.9                              16.5                                  -3%
                                                 next cycle.

                                                                                                                                               Price-to-earnings ratio                                                      Dividend yield
                                                                                                                                                                                    Price-to-book ratio
                                                                                                                                                       (NTM*)                                                                   (NTM*)

                                                                                                                                                           9.5x                              4.6x                                 4.3%
                                                                                                                                               *NTM: Next twelve months

     Source: Platinum and Factset Research Systems. Dividend and earnings are Factset mean consensus estimates for the NTM . 2 year EPS growth is calculated as the annualised growth of the company’ s EPS from its last fiscally reported figure to the Factset consensus
37   estimate for the fiscal year 2 years later. M arket capitalisation is the public market value of the company’ s listed equity. The market commentary reflects Platinum’ s views and beliefs at the time of preparation, which are subject to change without notice. No representations
     or warranties are made by Platinum as to their accuracy or reliability.
Platinum International Health Care Fund
     Top positions as at 31 May 2021: #10 Syneos Health Inc (1.9%)

                                       Investment case in brief                                                                                    3 year price movement
                                                                                                                                                      89
                                          Syneos Health is a leading contract
                                                 research organization (CRO) providing a                                                              79
                                                 full range of Phase I to Phase IV clinical
                                                 development services for                                                                             69

                                                 biopharmaceutical and medical device                                                                 59
                                                 companies.
                                                                                                                                                      49

                                          The company connects customers, clinical
                                                                                                                                                      39
                                                 research sites and patients to accelerate
                                                 the delivery of new medicines to market.
                                                                                                                                                                                                                    Earnings per share (EPS)
                                                                                                                                                Market Capitalisation                      Debt
                                                                                                                                                                                                                    growth (2 year consensus
                                                                                                                                                      (US$bn)                          (NTM*, US$bn)
                                                                                                                                                                                                                           per annum)
                                                                                                                                       0
                                                                                                                                                           9.2                                2.3                                 21%

                                                                                                                                               Price-to-earnings ratio                                                      Dividend yield
                                                                                                                                                                                    Price-to-book ratio
                                                                                                                                                       (NTM*)                                                                   (NTM*)

                                                                                                                                                         19.2x                               2.8x                                 0.0%
                                                                                                                                               *NTM: Next twelve months

     Source: Platinum and Factset Research Systems. Dividend and earnings are Factset mean consensus estimates for the NTM . 2 year EPS growth is calculated as the annualised growth of the company’ s EPS from its last fiscally reported figure to the Factset consensus
38   estimate for the fiscal year 2 years later. M arket capitalisation is the public market value of the company’ s listed equity. The market commentary reflects Platinum’ s views and beliefs at the time of preparation, which are subject to change without notice. No representations
     or warranties are made by Platinum as to their accuracy or reliability.
Disclaimer
     Platinum Investment Management Limited ABN 25 063 565 006 AFSL 221935, trading as Platinum Asset Management ("Platinum") is the responsible entity of the Platinum International Health Care
     Fund (the "Fund"). The Fund’s latest Product Disclosure Statement (the "PDS") provides details about the Fund. You can obtain a copy of the PDS from Platinum’s website www.platinum.com.au, or by
     contacting Investor Services on 1300 726 700 (Australian investors only), or 0800 700 726 (New Zealand investors only), or 02 9255 7500, or via invest@platinum.com.au. This information is general in
     nature and does not take into account your specific needs or circumstances. You should consider your own financial position, objectives and requirements and seek professional financial advice before
     making any financial decisions. Numerical figures have been subject to rounding. Platinum does not guarantee the performance of the Fund, the repayment of capital or the payment of income. The
     market commentary reflects Platinum’s views and beliefs at the time of preparation, which are subject to change without notice. No representations or warranties are made by Platinum as to their
     accuracy or reliability. To the extent permitted by law, no liability is accepted by Platinum for any loss or damage as a result of any reliance on this information.

     Unless otherwise expressly stated, Investment returns are calculated using the Fund’s NAV unit price (i.e. exclude a buy/sell spread) for C Class and P Class (as indicated), and represent the combined
     income and capital returns for each of these unit classes in the specified period. All returns are pre-tax, net of fees and costs and assume the reinvestment of distributions. The investment returns
     shown are historical and no warranty can be given for future performance. Past performance is not a reliable indicator of future returns.

     Any reference to long positions in this presentation means a position which the portfolio holds in an attempt to benefit from an increase in value of the underlying security of the position. Any reference to
     short positions means a position in which the portfolio holds in an attempt to benefit from a decrease in value of the underlying security of the position. Accordingly, long positions represent the fund’s
     exposure to exposure to long securities and long securities/index derivative positions, and short positions represent the fund’s exposure to short securities and short securities/index derivative positions,
     each as a percentage of the market value of the Fund’s portfolio.

     Where the returns are calculated relative to the MSCI Indices, it should be noted that prior to 31 December 1998, the gross MSCI Index was used as the net MSCI Index did not exist. MSCI data has
     been sourced from RIMES Technologies. The MSCI information may only be used for your internal use, may not be reproduced or redisseminated in any form and may not be used as a basis for or a
     component of any financial instruments or products or indices. None of the MSCI information is intended to constitute investment advice or a recommendation to make (or refrain from making) any kind
     of investment decision and may not be relied on as such. Historical data and analysis should not be taken as an indication or guarantee of any future performance analysis, forecast or prediction. The
     MSCI information is provided on an “as is” basis and the user of this information assumes the entire risk of any use made of this information. MSCI, each of its affiliates and each other person involved
     in or related to compiling, computing or creating any MSCI information (collectively, the “MSCI Parties”) expressly disclaims all warranties (including, without limitation, any warranties of originality,
     accuracy, completeness, timeliness, non-infringement, merchantability and fitness for a particular purpose) with respect to this information. Without limiting any of the foregoing, in no event shall any
     MSCI Party have any liability for any direct, indirect, special, incidental, punitive, consequential (including, without limitation, lost profits) or any other damages. (www.msci.com)

39
You can also read