Plugin USER MANUAL Ingenuity Pathway Analysis - QIAGEN Digital Insights
←
→
Page content transcription
If your browser does not render page correctly, please read the page content below
Ingenuity Pathway Analysis
           Plugin
         USER MANUAL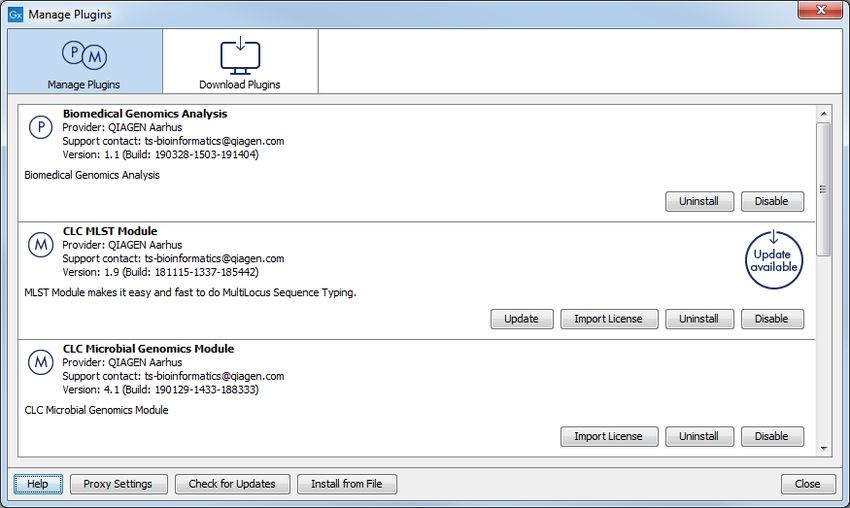
User manual for
Ingenuity Pathway Analysis 22.0.1
Windows, macOS and Linux

June 2, 2022
This software is for research purposes only.

QIAGEN Aarhus
Silkeborgvej 2
Prismet
DK-8000 Aarhus C
Denmark

Contents

1 Introduction                                                                                     4

2 Uploading data to IPA using the Pathway Analysis tool                                             6
   2.1 Error handling . . . . . . . . . . . . . . . . . . . . . . . . . . . . . . . . . . . . .    10

3 Import Expression Data                                                                           12
   3.1 Metadata and expression data matrix . . . . . . . . . . . . . . . . . . . . . . . .         14

4 Ingenuity Pathway Analysis workflows                                                             16
   4.1 Analyze Count Matrix and Upload Comparisons to IPA . . . . . . . . . . . . . . . .          16
        4.1.1 Running the Analyze Count Matrix and Upload Comparisons to IPA Workflow 17
   4.2 Analyze Expression Data and Upload Comparisons to IPA . . . . . . . . . . . . . .           20
        4.2.1 Running the Analyze Expression Data and Upload Comparisons to IPA
              Workflow . . . . . . . . . . . . . . . . . . . . . . . . . . . . . . . . . . . .     21

5 Analyzing Data in IPA                                                                            24

6 Install and uninstall plugins                                                                    26
   6.1 Installation of plugins . . . . . . . . . . . . . . . . . . . . . . . . . . . . . . . . .   26
   6.2 Uninstalling plugins . . . . . . . . . . . . . . . . . . . . . . . . . . . . . . . . . .    27

                                                 3
Chapter 1
Introduction
The Ingenuity Pathway Analysis plugin provides the ability to upload Statistical comparison data
generated using the RNA-Seq tools from CLC Genomics Workbench to Ingenuity Pathway Analysis
(IPA). In addition it provides support for import of expression data provided as a count matrix.
IPA provides valuable biological insight into the results of gene expression experiments by un-
covering enriched signaling and metabolic pathways, activated and inhibited upstream regulators
and effects on downstream diseases, functions, and phenotypes. IPA can visualize at the isoform
level for human genes.
The plugin comes with two tools and two template workflows (figure 1.1):
Figure 1.1: IPA plugin tools and workflow when installed in the CLC Genomics Workbench Toolbox.
• The Pathway Analysis tool uploads statistical comparison data (generated by the tool
Differential Expression for RNA-Seq) to IPA. The Pathway Analysis tool has been implemented
to succeed on many aspects such as usage of the new IPA API, stability, error handling,
and user feedback during the upload process. The tool will output one or more Statistical
Comparison tracks.
• The Import Expression Data tool which handles import of expression count data provided
as a data matrix and produces an expression track per entry in the table. The tool is
4CHAPTER 1. INTRODUCTION 5
workflow enabled and requires metadata. It handles import of raw counts, TPM and RPKM.
• The template workflow Analyze Expression Data and Upload Comparisons to IPA, which
takes expression data as input. The workflow analyzes them using the RNA-Seq Analysis
tools, and submits the comparisons to IPA using the Pathway Analysis tool.
• The template workflow Analyze Count Matrix and Upload Comparisons to IPA, which takes
an expression matrix as input. The workflow imports the counts and analyzes them using
the RNA-Seq Analysis tools, and submits the comparisons to IPA using the Pathway Analysis
tool.
It is possible to use gene and transcript based RNA-Seq experiments as basis for the analysis,
but also microarrays from Illumina and Affymetrix are supported. You can also upload small RNA
based experiments (Statistical Comparison Table format) where the seeds are most appropriate
to upload.
Once the experiment data are ready, it is possible to annotate with any of the supported statistics:
• Transformed and normalized foldchange
• Baggerley's test
• Kal's Z test
• ANOVA
• edgeRChapter 2
Uploading data to IPA using the Pathway
Analysis tool
Launch the Pathway Analysis tool from the toolbox:
Toolbox | Ingenuity Pathway Analysis | Pathway Analysis
Use one or several statistical comparison(s) as input ( ) (figure 2.1), and click Next.
Figure 2.1: Select a statistical comparison to analyze.
Under Set configuration (figure 2.2), you get the following options:
IPA server location Select the IPA server relevant for your account.
IPA user login Click the Log in button to open a new browser (or new tab) where you can log in.
This gives the workbench permission to upload data to IPA on your behalf.
Project Name This will be the name of the project in IPA once created. {1} will be substituted
with a date stamp. It is also possible to create a custom project name by typing in the
desired name in this field.
Upload only / Upload and analyse Select "Upload only", if you only wish to create a dataset in
IPA. Select "Upload and analyse", if you want to create an analysis from the dataset as
well.
6CHAPTER 2. UPLOADING DATA TO IPA USING THE PATHWAY ANALYSIS TOOL 7
Figure 2.2: Configure the tool to upload and potentially analyze the statistical comparison data in
IPA.
Click Next to go to the next wizard step (figure 2.3).
In this wizard step, the cutoff values for what should be uploaded to IPA can be specified. Only
features that pass the cutoffs that have been specified at this step will be sent to IPA and be
part of the dataset that can be seen in IPA.
Under Set upload parameters you get the following options:
Ignore features with mean expression values below This value is used to filter genes/tran-
scripts before uploading them to IPA. Features with values below this limit will not be
uploaded.
Upload rows with value = Minimum absolute fold change for feature to be uploaded.
Features with a fold change/log2 ratio below this number will not be uploaded. It is possible
to choose between different types of fold changes: Fold change, and log2 -ratio.
Upload Summary This summary shows how many features the tool will upload to IPA for each
statistical comparison. The values are updated, when the user changes any of the upload
parameters. In this way, the user can easily check the effect of the filtering (for instance to
avoid setting the filters such that no features will be uploaded)
If you had selected "Upload only" in the first step, click Finish to start the tool. But if you had
selected "Upload and analyze", click Next to see the dialog shown in figure 2.4.
Under Set analysis parameters, you get the following options:CHAPTER 2. UPLOADING DATA TO IPA USING THE PATHWAY ANALYSIS TOOL 8
Figure 2.3: Configure the parameters for uploading the data to IPA.
Maximum of group mean expression analysis filter | Analysis cutoff Minimum group mean ex-
pression value for feature (gene or transcript) to be used in analysis. Features with a
group mean expression value below this number will be uploaded, but will be ignored in the
analysis.
p-Value | Analysis cutoff Maximum p-value for feature (gene or transcript) to be used in analysis.
Features with a p-value above this number will be uploaded, but will be ignored in the
analysis. It is possible to choose between different types of p-values: Standard, Bonferroni,
and FDR. Note that when a feature has a standard p-Value but a missing Bonferroni or FDR
p-Value, then these missing p-Values will be set to 1.0.
Fold change | Analysis cutoff Minimum absolute fold change for feature to be used in analysis.
Features with a fold change/log2 ratio below this number will be uploaded, but will be
ignored in the analysis. It is possible to choose between different types of fold changes:
Fold change, and log2 -ratio.
Fold change | Automatically calculate fold change cutoff Automatically calculate fold change
when uploading observation. The fold change cutoff will be set so that the number of
features to include in the analysis gets as close to the targeted number as possible (see
below). When this option is used, it is not necessary to set the "Fold change | Analysis
cutoff", since it is automatically calculated by the tool for each statistical comparison.
When using this option, the fold change analysis cutoff can be different for each statistical
comparison.CHAPTER 2. UPLOADING DATA TO IPA USING THE PATHWAY ANALYSIS TOOL 9
Figure 2.4: Set the parameters for the analysis of the data in IPA.
Fold change | Target number of analysis features Enabled only when using automatically calcu-
lated fold change. The fold change cutoff will be set so that the number of features to
include in the analysis gets as close to the targeted number as possible
Upload and analysis summary This summary shows how many features the tool will upload to
IPA for each statistical comparison, and how many features that will be included in each
analysis. The values are updated when the user changes any of the analysis parameters.
In this way, the user can easily check the effect of the filtering (e.g. avoid setting the filters
such that no features will be analyzed).
The Upload and analysis summary table at the bottom of the dialog warns the user when too
restrictive filters have been set (figure 2.5).
Click Next to choose the reference as seen in figure 2.6.
The reference can be:
Ingenuity Knowledge Base (Genes only)
Uploaded dataset The data uploaded will be analyzed using itself as a reference.
Click Finish to start the tool.CHAPTER 2. UPLOADING DATA TO IPA USING THE PATHWAY ANALYSIS TOOL 10
Figure 2.5: A warning highlight in red analyses for which the cutoff is too restrictive.
Figure 2.6: Choose the reference to be used for the analysis of the data in IPA.
2.1 Error handling
Concurrent IPA sessions
When submitting data to IPA, the upload may fail, if several sessions are established concurrently
using the same username. This can happen when the IPA application is running while data isCHAPTER 2. UPLOADING DATA TO IPA USING THE PATHWAY ANALYSIS TOOL 11 being uploaded using the IPA tool, or if the IPA tool is part of a workflow with several IPA uploads running at the same time. To deal with this issue, the IPA tool has a retry functionality, such that the upload is attempted again, if it failed due to a problem with concurrent sessions. The waiting time between retry attempts is increased with a random factor for each attempt, to avoid that two processes continue to block each other. Upload multiple statistical comparisons If the IPA tool encounters an error when uploading multiple statistical comparisons, it will in most case continue uploading the remaining statitsical comparisons. However, if the tool gets one of the errors below, it stops uploading immediately, because it cannot expect that they will be resolved before the next upload: • Login error (invalid or expired login secret) • User agreement not accepted • License expired • Upload limit exceeded • Analysis limit exceeded
Chapter 3

Import Expression Data

Import Expression Data enables import of individual expression tracks from an expression data
matrix. The data matrix needs to be constructed to conform with the following formatting:

   • The matrix should be constructed in Excel or csv format.

   • Columns represent samples and rows represent genes. See figure 3.1 for an example of
     correct formatting.

   • Feature ID (gene ID or transcript ID) should be in the first column and samples in the
     following.

   • Only one feature ID is supported. It should be unique, i.e. Ensembl or geneID, not a
     mixture. Features that are non-unique will be ignored.

   • Three types of expression values are supported: Raw counts, TPM, an RPKM. Only one of
     these values should be supplied. We recommend to use raw counts when available.

   • If the matrix has been filtered for low count entries before upload, the provided calculation
     of TPM or RPKM needs to be on the filtered matrix as well, otherwise the counts will not be
     properly translated.

   • Import of other normalization types are not supported.

To launch the Import Expression Data tool, go to:
Toolbox | Ingenuity Pathway Analysis | Import Expression Data
Figure 3.2 shows the Import Expression Data dialog.
In the Expression Data section of the dialog that opens, first select the data matrix by using the
Browse button.
Select the expression values that matches the expression data type. All value types must be
non-negative values:

   • Counts

   • TPM

                                               12
CHAPTER 3. IMPORT EXPRESSION DATA 13
Figure 3.1: RPKM count matrix using Ensembl gene names and representing 4 samples in a Tumor
Normal design.
• RPKM
When selecting TPM or RPKM, the expected minimum count must be specified. The value must
be the smallest count value that was present in the expression matrix when calculating the TPMs
or RPKMs values. In unfiltered data this value will typically be 1 (default).
Under References, specify how expression values were generated. This is for defining whether
it was generated as a gene or transcript matrix as well as to specify how the TPM/RPKM were
calculated.
• Genes with accompanying transcripts Matches imported values against genes. Transcripts
are used for identifying exon length when translating between counts and TPM/RPKM.
• Genes Matches imported values against genes. Gene length are used when translating
between counts and TPM/RPKM.
• Transcripts Matches imported values against transcripts and uses exon length when
translating between counts and TPM/RPKM.
The key is that you specify the Gene and mRNA tracks that were used to generate the expression
values. When selecting Genes with accompanying transcripts as parameter you can choose to
calculate expression for genes without transcript. This will result in the generation of a transcript
that is expected to have the length of the full gene. Enabling this option allows calculation of
TPM and RPKM when counts have been supplied.
At the bottom of the dialog, specify whether unmatched genes or transcripts should be included
or ignored, or if the analysis should fail.
The Import Expression Data tool outputs one expression track per samples.CHAPTER 3. IMPORT EXPRESSION DATA 14
Figure 3.2: Parameters available in the Import Expression Data tool. Select the Table file containing
the expression matrix and select the type of data matching the values in the file (in this case it
contains count data). Add references to import against appropriate gene or transcript annotations.
Select how to handle unmatched genes or transcripts.
3.1 Metadata and expression data matrix
The expression data matrix can be accompanied with metadata in the form of another Excel
or CSV file. A header row must be present in the expression matrix to link the sample to the
identifier in the metadata. The link needs to be an exact match.
Importing metadata is however optional.
• When running in a workflow It is possible to skip metadata import and still iterate over the
samples, in which case the iteration will be for each imported expression track. If the import
connects to tools that requires metadata, e.g., Differential Expression for RNA-Seq, then
metadata is required. Note that importing metadata directly from the Import Expression
Data tool is only available when running in a workflow.
• When running tool first import the expression tracks and then create and associate
metadata using the Import Metadata tool.
For an example of a metadata table that matches the expression matrix described above, see
figure 3.3.CHAPTER 3. IMPORT EXPRESSION DATA 15
Figure 3.3: Metadata describing the samples from figure 3.1.
An example of a workflow using the Import Expression Data tool is described in the next section.Chapter 4
Ingenuity Pathway Analysis workflows
Ingenuity Pathway Analysis Plugin includes two workflow, Analyze Count Matrix and Upload
Comparisons to IPA and Analyze Expression Data and Upload Comparisons to IPA. The workflow
takes expression data provided either as single samples or as a expression matrix, and analyzes
them using the tools in the RNA-Seq Analysis folder. It then submits the comparison to IPA using
the Pathway Analysis tool.
You find the workflows among the Template Workflows in the toolbox, lower right corner of the
CLC Genomics Workbench. The workflow is located in the Ingenuity Pathway Analysis Workflow
folder as shown in figure 4.1 below:
Figure 4.1: Location of the template workflows in the Toolbox.
4.1 Analyze Count Matrix and Upload Comparisons to IPA
The workflow Analyze Count Matrix and Upload Comparisons to IPA imports expression data from
an Expression count matrix, and analyzes them using the tools in the RNA-Seq Analysis folder. It
then submits the comparison to IPA using the Pathway Analysis tool.
The purpose of the workflow is to make it as easy as possible for the user to get from Sample
to Insight. The user only has to provide the expression count matrix, sample metadata as well
as mRNA and Genes as input, and the workflow performs import, statistical analyses and data
interpretation using capabilities available via CLC Genomics Workbench and IPA.
Opened in the workflow editor, the workflows looks like this (see figure 4.2 below):
The expression data from the count matrix data are imported by the Import Expression Data tool
that splits each sample into a track. The expression tracks are then sent to three tools:
• Create Heat Map for RNA-Seq The tool creates a two dimensional heat map of expression
16CHAPTER 4. INGENUITY PATHWAY ANALYSIS WORKFLOWS 17
Figure 4.2: Layout of the Analyze Count Matrix and Upload Comparisons to IPA workflow.
values. Each column corresponds to one sample, and each row to a feature (a gene or a
transcript). The samples and features are both hierarchically clustered.
• Differential Expression for RNA-Seq The tool performs a statistical differential expression
test for a set of Expression Tracks. It's outputs are used as inputs for the IPA tool and for
Create Venn Diagram for RNA-Seq (see below).
• PCA for RNA-Seq The tool creates a PCA plot, which is a projection of a high-dimensional
dataset (where the number of dimensions equals the number of genes or transcripts) onto
two of three dimensions. This helps in identifying outlying samples for quality control, and
gives a feeling for the principal causes of variation in a dataset.
The outputs from the tools are saved in the chosen output folder for the workflow. The outputs
from the Differential Expression for RNA-Seq tool are furthermore used for processing by these
two tools:
• Pathway Analysis The tool uploads the comparisons to IPA. See chapter 2 for details.
• Create Venn Diagram for RNA-Seq The tool makes it possible to compare two or more
statistical comparison tracks. The Venn diagram comparison visualizes the overlap between
the differentially expressed genes or transcripts in the selected statistical comparison
tracks. The genes considered to be differentially expressed can be controlled by setting
appropriate p-value and fold change thresholds.
4.1.1 Running the Analyze Count Matrix and Upload Comparisons to IPA Workflow
The workflow can be started from the toolbox, or by using the Launch button ( ).
In the first step choose the reference data, if default is selected no elements are configured and
you will have to fill in the desired reference elements in the next two steps. Note, that you should
be very specific with the chosen reference data that needs to match the genes in the Expression
matrix that is imported, otherwise you might lose genes that cannot be matched on import.CHAPTER 4. INGENUITY PATHWAY ANALYSIS WORKFLOWS 18
Next select the tables file with the expression data and specify what type of count data you
provide (raw count, TPM or RPKM are allowed) as well as how they were processed. Finally,
select the metadata table. See figure 4.3.
Figure 4.3: Selecting table file to import including specifying type of value (Gene/TPM/RPKM) and
Gene/Transcript, as well as choosing the location of the sample metadata file.
Metadata is required for organization of the imported counts and essential to the experimental
design in the Differential Expression for RNA-Seq tool. In addition it and can be used to
add extra layers of insight in the Create Heat Map and PCA for RNA-Seq tools. To learn
more about how to create a metadata table, how to import a metadata table, or how to
associate data elements with metadata, see http://resources.qiagenbioinformatics.com/manuals/
clcgenomicsworkbench/current/index.php?manual=Metadata.html.
Following this, the parameters for the Differential Expression for RNA-Seq need to be specified,
see figure 4.4.
Specify the following
Test differential expression due to Select the factor to be tested for differential expression.
while controlling for Select the factor to be controlled for.
Comparisons Select groups to be compared. It is possible to choose between "Across groups",
"All group pairs", and "Against control group".
Control group If "Against control group" was selected in "Comparisons", a control group must
be selected.
In the next step, the parameters for the Pathway Analysis tool need to be set. Setting the
parameters in a workflow context is not as user-friendly as when run stand-alone, because the
parameters from the different pages are grouped on the same page in workflow execution. To
help clarify this, it is indicated in figure 4.5 which parameters pertain to the IPA upload, and
which pertain to the IPA analysis.CHAPTER 4. INGENUITY PATHWAY ANALYSIS WORKFLOWS 19 Figure 4.4: Set up the Differential Expression analysis by selecting metadata and choosing parameters. In the final step, standard result handling is performed: The selected parameters can be previewed, and an output location must be chosen.
CHAPTER 4. INGENUITY PATHWAY ANALYSIS WORKFLOWS                                                20

Figure 4.5: Selecting the Pathway Analysis tool parameters for upload to IPA and analysis in IPA.

4.2    Analyze Expression Data and Upload Comparisons to IPA
The workflow Analyze Expression Data and Upload Comparisons to IPA takes expression data as
input, and analyzes them using the tools in the RNA-Seq Analysis folder. It then submits the
comparison to IPA using the Pathway Analysis tool.
The purpose of the workflow is to make it as easy as possible for the user to get from Sample
to Insight. The user only has to provide expression data as input, and the workflow generates
all available statistical analyses and data interpretation capabilities available via CLC Genomics
Workbench and IPA.
Opened in the workflow editor, the workflows looks like this (see figure 4.6 below):
The expression tracks are sent to three tools:

   • Create Heat Map for RNA-Seq The tool creates a two dimensional heat map of expression
     values. Each column corresponds to one sample, and each row corresponds to a feature
     (a gene or a transcript). The samples and features are both hierarchically clustered.

   • Differential Expression for RNA-Seq The tool performs a statistical differential expression
     test for a set of Expression Tracks. Its outputs are used as inputs for the IPA tool and for
     Create Venn Diagram for RNA-Seq (see below).

   • PCA for RNA-Seq The tool creates a PCA plot, which is a projection of a high-dimensional
     dataset (where the number of dimensions equals the number of genes or transcripts) onto
CHAPTER 4. INGENUITY PATHWAY ANALYSIS WORKFLOWS 21
Figure 4.6: Layout of the Analyze Expression Data and Upload Comparisons to IPA workflow
two of three dimensions. This helps in identifying outlying samples for quality control, and
gives a feeling for the principal causes of variation in a dataset.
The outputs from the tools are saved in the chosen output folder for the workflow. The outputs
from the Differential Expression for RNA-Seq tool are furthermore used for processing by these
two tools:
• Pathway Analysis The tool uploads the comparisons to IPA. See chapter 2 for details.
• Create Venn Diagram for RNA-Seq The tool makes it possible to compare two or more
statistical comparison tracks. The Venn diagram comparison visualizes the overlap between
the differentially expressed genes or transcripts in the selected statistical comparison
tracks. The genes considered to be differentially expressed can be controlled by setting
appropriate p-value and fold change thresholds.
4.2.1 Running the Analyze Expression Data and Upload Comparisons to IPA Workflow
The workflow can be started from the toolbox, or by using the Launch button ( ).
Choose the expression data to be analyzed and uploaded (see figure 4.7).
Figure 4.7: Selecting input parameters in the IPA plugin workflow.CHAPTER 4. INGENUITY PATHWAY ANALYSIS WORKFLOWS 22
Following this, the parameters for the Differential Expression for RNA-Seq need to be specified
(see figure 4.8):
Figure 4.8: Selecting parameters for Differential Expression for RNA-Seq.
Metadata table Select a metadata object that associates the selected input objects to metadata
used by the RNA-Seq analysis.
Test differential expression due to Select the factor to be tested for differential expression.
Comparisons Select groups to be compared. It is possible to choose between "Across groups",
"All group pairs", and "Against control group".
Control group If "Against control group" was selected in "Comparisons", a control group must
be selected.
An example of a metadata table is shown in figure 4.9.
Figure 4.9: An example of a metadata table.
Metadata is required when defining the experimental design in the Differential Expression for
RNA-Seq tool, and can be used to add extra layers of insight in the Create Heat Map and
PCA for RNA-Seq tools. To learn more about how to create a metadata table, how to import
a metadata table, or how to associate data elements with metadata, see http://resources.
qiagenbioinformatics.com/manuals/clcgenomicsworkbench/current/index.php?manual=Metadata.html.
In the next step, the parameters for the Pathway Analysis tool need to be set. Setting the
parameters in a workflow context is not as user-friendly as when run stand-alone, because theCHAPTER 4. INGENUITY PATHWAY ANALYSIS WORKFLOWS 23 parameters from the different pages are grouped on the same page in workflow execution. To help clarify this, it is indicated in figure 4.10 which parameters pertain to the IPA upload, and which pertain to the IPA analysis. Figure 4.10: Selecting the Pathway Analysis tool parameters for upload to IPA and analysis in IPA. In the final step, standard result handling is performed: The selected parameters can be previewed, and an output location must be chosen.
Chapter 5
Analyzing Data in IPA
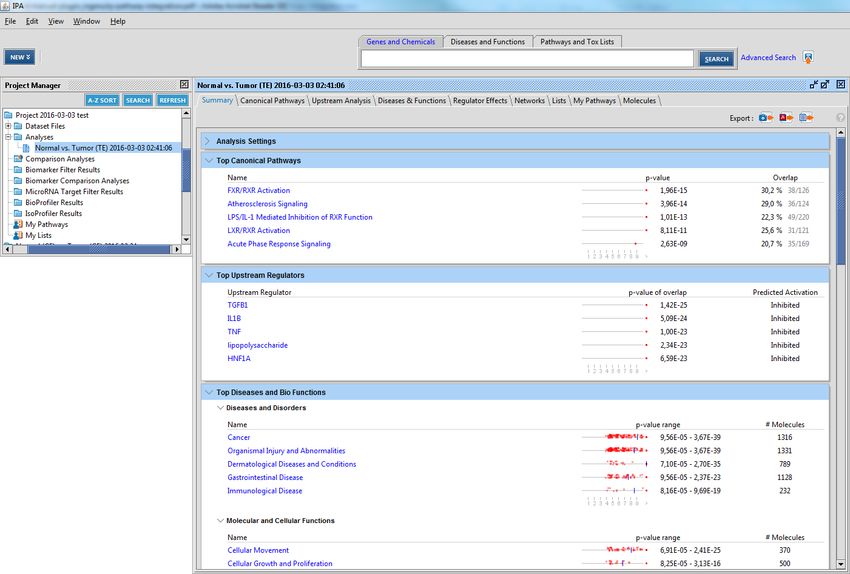
Ingenuity Pathway Analysis enables you to analyze and visualize RNA-Seq datasets, eliminating
the obstacles between data and biological insight. For example, IPA can predict upstream
regulation and downstream outcomes from your expression data, and identify relevant signaling
and metabolic pathways. Figure 5.1 shows a newly opened analysis in IPA.
Figure 5.1: The first window when opening an analysis in IPA
Figure 5.2 shows some of the visual capabilities of IPA.
For more information about IPA, please visit https://digitalinsights.qiagen.com/
products-overview/discovery-insights-portfolio/analysis-and-visualization/
24CHAPTER 5. ANALYZING DATA IN IPA 25
Figure 5.2: Another IPA application screenshot
qiagen-ipa/.Chapter 6
Install and uninstall plugins
Ingenuity Pathway Analysis is installed as a plugin.
6.1 Installation of plugins
Note: In order to install plugins and modules, the CLC Workbench must be run in administrator
mode. On Windows, you can do this by right-clicking the program shortcut and choosing "Run as
Administrator". On Linux and Mac, it means you must launch the program such that it is run by
an administrative user.
Plugins and modules are installed and uninstalled using the Workbench Plugin Manager. To open
the Plugin Manager, click on the Plugins ( ) button in the top Toolbar, or go to the menu option:
Utilities | Manage Plugins... ( )
The Plugin Manager has two tabs at the top:
• Manage Plugins An overview of your installed plugins and modules is provided under this
tab.
• Download Plugins Plugins and modules available to download and install are listed in this
tab.
To install a plugin, click on the Download Plugins tab (figure 6.1). Select a plugin. Information
about it will be shown in the right hand panel. Click on the Download and Install button to install
the plugin.
Accepting the license agreement
The End User License Agreement (EULA) must be read and accepted as part of the installation
process. Please read the EULA text carefully, and if you agree to it, check the box next to the
text I accept these terms. If further information is requested from you, please fill this in before
clicking on the Finish button.
Installing a cpa file
26CHAPTER 6. INSTALL AND UNINSTALL PLUGINS 27 Figure 6.1: Plugins and modules available for installation are listed in the Plugin Manager under the Download Plugins tab. If you have a .cpa installer file for Ingenuity Pathway Analysis, you can install it by clicking on the Install from File button at the bottom of the Plugin Manager. If you are working on a system not connected to the internet, plugin and module .cpa files can be downloaded from https://digitalinsights.qiagen.com/products-overview/ plugins/using a networked machine, and then transferred to the non-networked machine for installation. Restart to complete the installation Newly installed plugins and modules will be available for use after restarting the software. When you close the Plugin Manager, a dialog appears offering the opportunity to restart the CLC Workbench. 6.2 Uninstalling plugins Plugins and modules are uninstalled using the Workbench Plugin Manager.To open the Plugin Manager, click on the Plugins ( ) button in the top Toolbar, or go to the menu option: Utilities | Manage Plugins... ( ) This will open the Plugin Manager (figure 6.2). Installed plugins and modules are shown under the Manage Plugins tab of the Plugins Manager. To uninstall a plugin or module, click on its entry in the list, and click on the Uninstall button. Plugins and modules are not uninstalled until the Workbench is restarted. When you close the Plugin Manager, a dialog appears offering the opportunity to restart the CLC Workbench. Disabling a plugin without uninstalling it If you do not want a plugin to be loaded the next time you start the Workbench, select it in the
CHAPTER 6. INSTALL AND UNINSTALL PLUGINS                                                 28

Figure 6.2: Installed plugins and modules are listed in the Plugins Manager under the Manage
Plugins tab.

list under the Manage Plugins tab and click on the Disable button.
You can also read