PORT OF BRISBANE RESPONSE TO THE INQUIRY INTO NATIONAL FREIGHT SUPPLY CHAIN PRIORITIES - JULY 2017
←
→
Page content transcription
If your browser does not render page correctly, please read the page content below
PORT OF BRISBANE RESPONSE TO THE
INQUIRY INTO NATIONAL FREIGHT SUPPLY
CHAIN PRIORITIES
JULY 2017
1.0        Approach .................................................................................................................................................... 3
  2.0        Priority Issues ............................................................................................................................................ 3
     2.1 What constitutes the Port of Brisbane? ........................................................................................................ 3
  3.0        What is moving where, why and how? ...................................................................................................... 5
     3.1 Key Port Infrastructure.................................................................................................................................. 5
     3.2 Quay Line - containers ................................................................................................................................. 5
     3.3 Brisbane Multi-modal Terminal (BMT) Intermodal Terminal) ....................................................................... 6
     3.4 Road Infrastructure and Access ................................................................................................................... 7
     3.5 Rail Access and Capacity ........................................................................................................................... 10
  4.0        Freight Data Gaps.................................................................................................................................... 13
     4.1 Collection of Data ....................................................................................................................................... 13
  5.0        Urban Growth Pressures ......................................................................................................................... 14
  6.0        Port Corridor Pressures ........................................................................................................................... 14
     6.1 Port Rail Connection (PRC) ....................................................................................................................... 14
     6.2 Cross River Rail (CRR) .............................................................................................................................. 15
     6.3 Bigger Ships/Channel Deepening .............................................................................................................. 15
     6.4 Dredging and Land Reclamation ................................................................................................................ 17
     6.5 The Future Port Expansion (FPE) Area ..................................................................................................... 19
     6.6 Post Completion of the FPE ....................................................................................................................... 20
  7.0        Supply Chain Integration and Regulation ................................................................................................ 20
     7.1 Supply Chain Integration ............................................................................................................................ 20
     7.2 Regulation .................................................................................................................................................. 20
     7.2.1 Coastal Shipping ..................................................................................................................................... 21
     7.2.2 Regulation of Heavy Vehicles ................................................................................................................. 21
     7.3 Empty Container Management ................................................................................................................... 22
  8.0        Changing Technology .............................................................................................................................. 22
  9.0        Capacity Forecasting ............................................................................................................................... 23
     9.1 Ability to meet forecast demand ................................................................................................................. 24
  10.0       Key drivers of Change for Use in Scenario Planning .............................................................................. 24
  11.0       A national freight performance network ................................................................................................... 27
  12.0       Summary.................................................................................................................................................. 28

Page 2 | 24 July 2017 | Response to the Inquiry into National Freight Supply Chain Priorities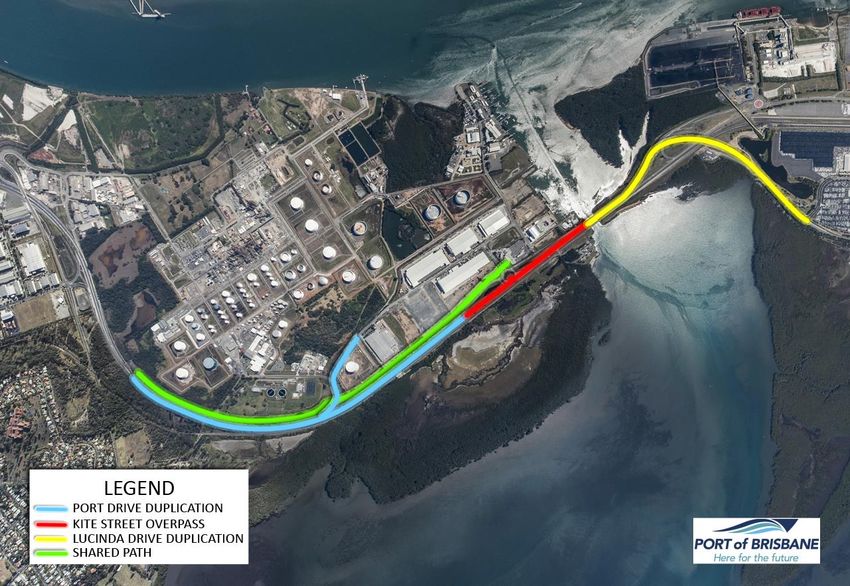
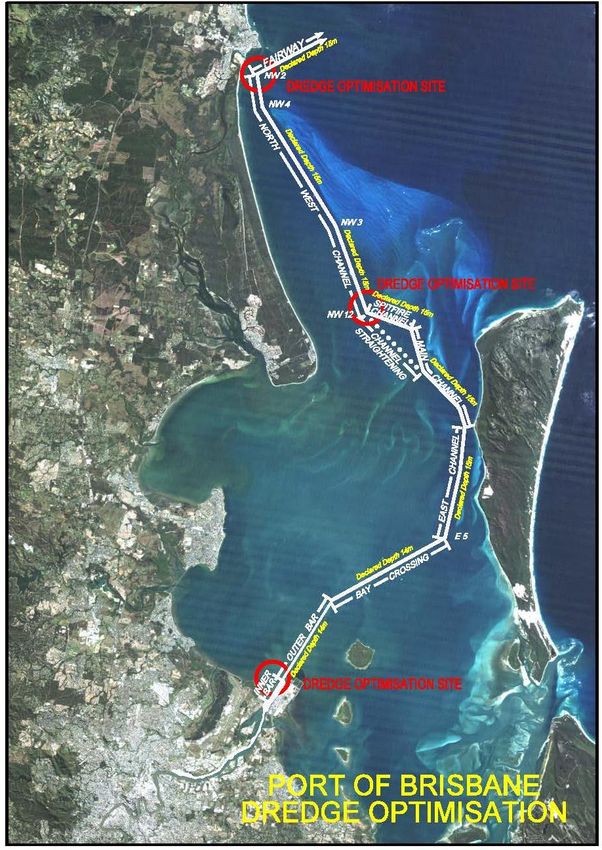
Freight and Supply Chain Inquiry
Department of Infrastructure and Regional Development
GPO Box 594
CANBERRA CITY ACT 2601

Email: freightstrategy@infrastructure.gov.au

28 July 2017

Dear Minister

Port of Brisbane Response to the Inquiry into National Freight Supply Chain Priorities
The Port of Brisbane Pty Ltd (PBPL) welcomes the opportunity to comment on, and contribute to, the May 2017 Discussion
Paper on the Inquiry into National Freight Supply Chain Priorities. The Government’s decision to develop a National Freight
and Supply Chain Strategy provides an unparalleled opportunity to articulate the challenges confronting the nations’ supply
chains and set out practical steps to deal with them.

PBPL comments on the Discussion Paper are set out below.

1.0      Approach
PBPL’s approach is not to replicate previous submissions and to only highlight issues from these submissions relevant to
this Inquiry. This applies particularly to Coastal Shipping and Inland Rail.

2.0      Priority Issues
The issues which are the greatest priority for the Port of Brisbane and are relevant to the national Freight and Supply
Chain Strategy (the ‘Strategy’) are the Port Rail Connection from Acacia Ridge to the Port (an extension of Inland Rail) and
the need to accommodate bigger ships.

2.1 What constitutes the Port of Brisbane?

As a confluence point for land and sea freight transport, the Port handles approximately $50 billion of trade per year including
> 1.2 million containers, >240,000 motor vehicles and large volumes of wet and dry bulk and general cargo.

The Port of Brisbane incorporates a total of ~1,860.5ha of wet and dry land, designated for industrial, commercial and
environmental / buffering purposes. These lands include estates in the suburbs of Port of Brisbane (Port Bris, Port Central and
Port Gate), Lytton (Port West), Pinkenba and Bulwer Island (Port North) and Colmslie (see Figure 1). Collectively, these
estates host 30 operating berths over more than 8.2km of quay line.

Page 3 | 24 July 2017 | Response to the Inquiry into National Freight Supply Chain Priorities
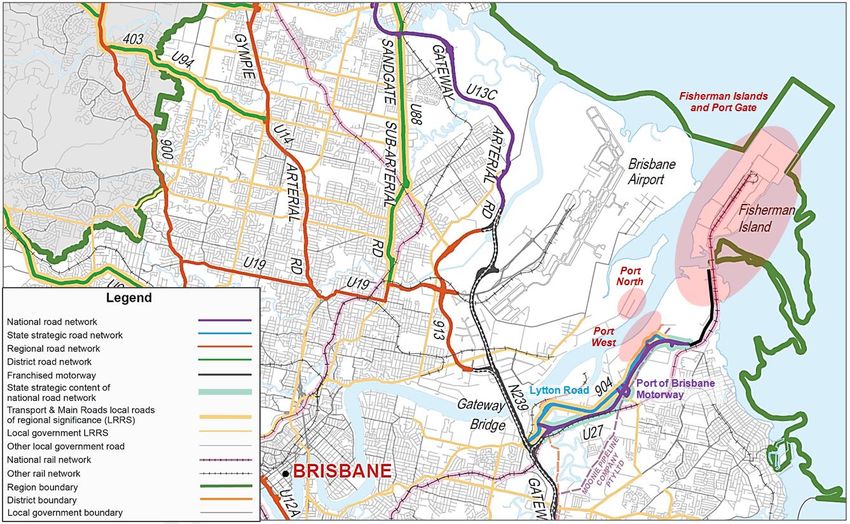
Figure 1. Port of Brisbane Locality Plan
The Port is approximately 24km from the city’s Central Business District and features world-class cargo handling capabilities
and warehousing facilities. The port provides an interface between rail, road and sea transport (including the Brisbane
Multimodal Terminal (BMT)) and over the past 40 years has benefited from infrastructure investment exceeding $2 billion.
Operationally, ‘Port Limits’ (see Figure 1.2) extend geographically beyond PBPL’s ‘core port lands’ from Caloundra to the
southern tip of Moreton Island and some 16km up the Brisbane River to Breakfast Creek. They include the:
Shipping channels in Moreton Bay, which are dredged where necessary to ensure a minimum depth of 15m below LAT
(Lowest Astronomical Tide)
Channels, swing basins and berth pockets at Fisherman Islands and Luggage Point (channel, swing basin and most
berths dredged to a minimum depth of 14m below LAT)
Page 4 | 24 July 2017 | Response to the Inquiry into National Freight Supply Chain Priorities
Channels upriver of Fisherman Islands, which are dredged to a minimum depth of 9.1m The Port of Brisbane is one of Australia’s fastest growing and most diverse ports. The port primarily serves the communities of Queensland and northern New South Wales and is recognised as a strategic asset of national importance that provides critical links to world markets. The port is centred within one of Australia’s fastest growing urban areas, South East Queensland (SEQ). This region comprises 11 local government authorities and is the focus of the Queensland Government’s SEQ Regional Plan (SEQRP) which sets out a broad framework for managing growth, change, land use and development to 2031. SEQ is expected to experience continued strong population growth during this period and beyond. This underlying population growth supports the port’s strong trade forecasts and the need for continued infrastructure investment and development at the Port of Brisbane. The port is located at the entrance to the Brisbane River, on the edge of the Moreton Bay Marine Park. Being a ‘river-mouth port’ provides the strategic advantage of separating Brisbane Core Port Land from residential and other sensitive land uses. The closest residential properties to port activities on the south-side of the river are a kilometre away in Wynnum North while on the north-side of the river, the Pinkenba community is approximately 500m from the nearest port lands. Such separation is further supported by substantial buffer areas. PBPL seeks to preserve these strategic advantages and reinforce the precinct- based approach to land use planning captured in the LUP. One of the key planning advantages of the Port of Brisbane is that nearly all core port infrastructure areas within the Port of Brisbane, particularly at Fisherman Islands, are almost entirely surrounded by water or buffered by other parcels of Brisbane Core Port Land. A key feature of PBPL’s strategic planning is the minimisation of amenity concerns between core port infrastructure and residential or other sensitive uses, primarily through maintaining adequate buffering between these land uses (including ~635ha of Brisbane Core Port Land zoned as ‘Open Space’, ‘Conservation/Buffer’ or ‘Buffer/Investigation’). It is anticipated that Brisbane City Council’s planning will continue to support this key strategic planning element, while also reinforcing the importance of the port in terms of the local, regional and state economy. 3.0 What Is Moving Where, Why And How? 3.1 Key Port Infrastructure The Port of Brisbane provides a range of infrastructure and facilities which are an essential component of all import/export (IMEX) supply chains. They key components are: a shipping channel, quay line for ships to be loaded and unloaded, terminals for handling IMEX cargo, road and rail infrastructure, an intermodal terminal (Brisbane Multi-modal terminal (BMT). These are explained below. 3.2 Quay Line - Containers The Port of Brisbane currently has quay line capacity of 8 x 300m dedicated container berths, comprising approximately 2,460 metres of quay line. These are allocated to DP World (wharves 4 to 7), Patrick Stevedores (wharves 8 to 10) and Brisbane Container Terminals, operated by Hutchinson Port Holdings (wharves 11 & 12). The level of utilisation of each of these wharves is currently well below capacity, meaning that substantial growth can be accommodated before additional infrastructure is required. A number of productivity factors are used to determine the container capacity of the port i.e, quay line, terminal, and landside productivity factors. Combining trade and productivity targets, the capacity of the current and planned infrastructure of Berths 4-12 (comprising 2,460m of quay line) is considerable. With expected growth and high productivity (2,000 TEUs per quay line metre), existing capacity would not be reached until beyond 2040, which would then require a further berth from that date. The capacity of the port, based on the remaining available quay line and likely productivity levels (utilising current technology), shows capacity running out in approximately 2040. It should be noted that increasing productivity from 1,600 TEUs per quay line metre to 2,000 TEUs per quay line metre extends the sufficiency of already-committed quay line an extra 14 years (based on long-term trade growth assumptions). The wharves are necessarily integrated with the terminal operations immediately adjacent to the wharves. As additional berth and terminals are required, the land immediately behind the wharves will be preserved to ensure that this integration can occur. Page 5 | 24 July 2017 | Response to the Inquiry into National Freight Supply Chain Priorities
The current container wharves at the Port of Brisbane have significant inbuilt capacity, meaning PBPL does not need to invest
in new infrastructure to achieve greater TEU numbers for a considerable period. Rather, stevedores will need to invest in
infrastructure to enable greater TEUs per quay line metre. PBPL has clauses in its lease agreements with stevedores to
ensure that this happens.
The staging of developments is such that the next wharf and terminal development, in line with the expectations above, will be
required beyond 2040, necessitating the preservation of future wharf and terminal space.

3.3 Brisbane Multi-modal Terminal (BMT) Intermodal Terminal)
The Brisbane Multi-modal Terminal (BMT) is an open access intermodal terminal providing an interface between rail/road and
the container terminal operations at the Port of Brisbane. The BMT has two side-by-side 900m rail sidings and a dual gauge
through-line which are linked with the Queensland rail network. The BMT is an ‘off dock’ facility, in that there is a short road
leg between the BMT and the stevedores. Trucks transport full containers to the stevedores and empty containers from the
container parks to the BMT.

Containerised trade through the BMT comes solely from north and far north Queensland. In 2016/17, 85% of containers
moved on rail were export-related (empty containers for packing and full containers for export).

Cargos generated from SEQ are generally not transported by rail due to higher costs and lower efficiencies. In the longer
term, towards the end of this plan timeframe, the lack of land for additional intermodal activities, combined with increased road
congestion may drive the movement of additional containers onto rail, which may warrant the need for intermodal hubs (e.g. at
locations that could include Bromelton, Ebenezer, Charlton Wellcamp etc.). This may also result in logistical solutions to
attract additional cargos from SEQ to use rail instead of road. This would require further investigation in conjunction with the
relevant government agencies. There is also a possibility that new container trains may commence services from SW Qld
(Goondiwindi/Oakey/Wellcamp) in the near term.

As more cargo is handled on rail, due to road congestion and an expanding hinterland, additional rail paths will become
necessary. The economies of transporting cargoes by rail improve with increased competition and rail paths, leading to
increased utilisation and lower costs. The development of a dedicated/segregated rail freight corridor to the port will be vital in
this regard.

Based on current conditions at the BMT, there is sufficient capacity in the current facility to meet the needs of the port until
there is significantly increased rail capacity on the rail network and therefore increased services (the BMT’s capacity is
>250,000 TEU per annum). There is 4ha of land located adjacent to the BMT which could be developed to cater for additional
demand if required. The facility has the ability to accommodate 900m trains without breaking up and up to 1,800m trains by
breaking and shunting or 1200m trains with infrastructure changes.

The existing Fisherman Islands rail loop is the smallest gauge rail loop in Queensland and requires a higher level of
maintenance because of its size. A maximum rail loop of 180m radius is achievable when required. Presently there is land
reserved for an expanded rail loop, with tenure arrangement in place with Queensland Rail Ltd to allow a transition to the new
loop. The land is temporarily being used for container and cargo storage and handling.

In the future should coal exports increase substantially, additional rail infrastructure such as rail marshalling sidings and an
additional unloading facility may be required. The marshalling provision cannot be accommodated on Fisherman Islands due
to existing land uses and leases, however it is possible that a single additional rail line could be accommodated on the bay
side of the existing rail corridor (from the Boat Passage through to Pritchard Street).

Page 6 | 24 July 2017 | Response to the Inquiry into National Freight Supply Chain Priorities
3.4 Road Infrastructure and Access
Approximately 97% of the port’s container trade is presently handled by road, making this form of transport a key
consideration in the development of current and future land use. Road transport within SEQ presently remains the most
effective and cost efficient mode of transporting export and import containers to and from the port, That said, given that road
congestion in SEQ is predicted to increase in the short to medium term, rail’s mode share must increase (particularly where
improved rail freight infrastructure and services are provided).

The Port of Brisbane Motorway (PoBM) is the key road corridor connecting the port to the National Highway system (see
Figure 2). This recently completed road is motorway standard with two lanes in each direction, posted at 90km/hr. and is
managed by DTMR using sophisticated computer systems to monitor traffic. It connects the Gateway Motorway to Port Drive
and also services a number of other adjacent industrial areas.

Figure 2 Local Transport System Interface

The Department of Transport and Main Roads (DTMR)-managed PoBM is the key road transport linkage for the port and is
vital for trade. With its connection to the recently upgraded Gateway Motorway and the motorway network beyond, improved
road transport linkages are available to most of the major industrial areas in Brisbane and to the port’s hinterland.

In accordance with its lease requirements (yet several years ahead of demand), PBPL is presently linking the second stage of
the PoBM to Fisherman Islands via the funding and management of a $110M upgrade to Port Drive (see figure 3 below). This
will provide a four lane motorway-standard connection, an overpass over a major roundabout, and a new bridge with capacity
to accommodate the heaviest vehicles. It is expected to be completed in mid-2018.

Page 7 | 24 July 2017 | Response to the Inquiry into National Freight Supply Chain Priorities
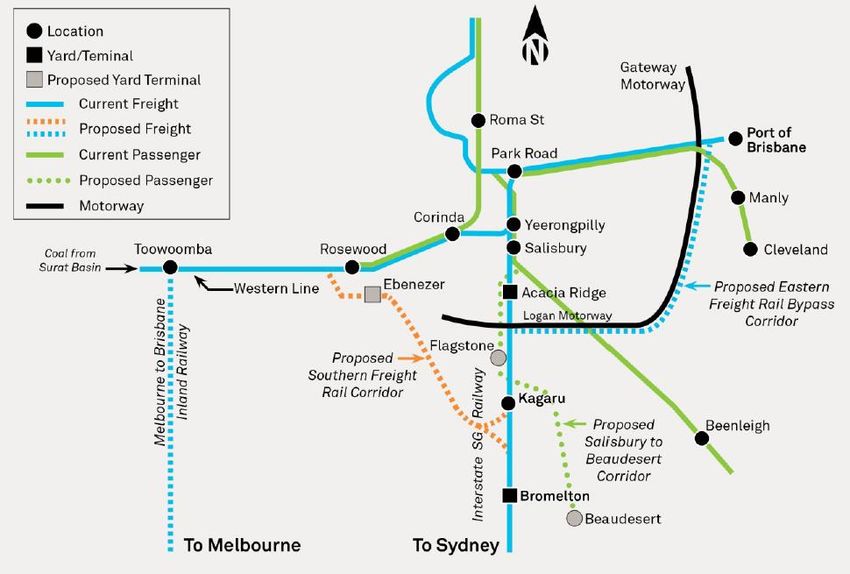
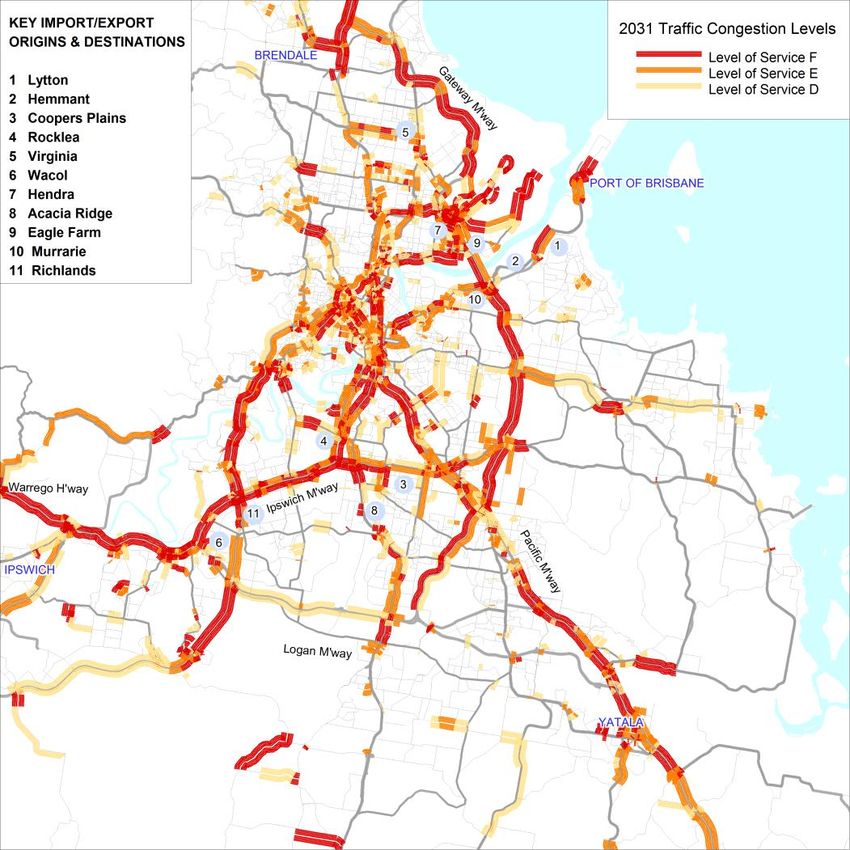
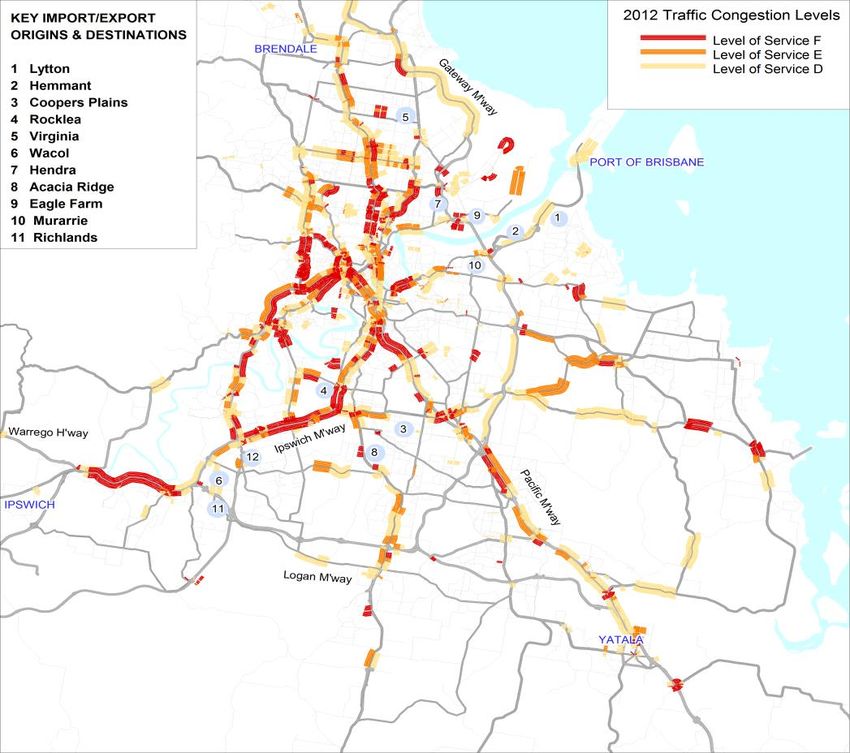
Figure 3: Port of Brisbane Pty Ltd’s $110 million Port Drive Upgrade.

While the PoBM is a vast improvement on the previous access to the Port (i.e. along Lytton Road), traffic congestion is
already being seen at the south-bound confluence with the Gateway Motorway.

Based on projections for container trade alone (see figure 13) considerable growth in truck movements to and from the port is
expected over the next 20 – 25 years

Figure 4: Projected Container Trade and Truck Movements at the Port of Brisbane

Notwithstanding improvements to regional road networks, changes in trucking technology and/or mode shifts to rail and
coastal shipping, such growth is likely to result in very heavy road traffic congestion (see figures below where the Level of
Service is described on a range from A - being ‘free flow’ conditions to F - being very heavy congestion (Austroads 2009)).

Page 8 | 24 July 2017 | Response to the Inquiry into National Freight Supply Chain Priorities
The 2013 PBPL/Queensland Transport and Logistics Council (QTLC) Import/Export Logistics Chain Study identified the
following:
The existing road transport network currently experiences significant congestion at various times of the day
(particularly the morning peak period).
Commuter periods impact on major road performance, principally to/ from the CBD.
Industrial areas, including the Port can have longer periods of higher activity during the day.
Key routes likely to experience periods of congestion in the short-term include:
- Toowoomba Range crossing
- Ipswich Motorway
- Gateway Motorway
- Port Drive
Key routes used by Port traffic which may be impacted by congestion by 2040 include the:
- Pacific Motorway
- Ipswich Motorway
- Warrego Highway
- Gateway Motorway (existing two-lane carriageway sections)
Page 9 | 24 July 2017 | Response to the Inquiry into National Freight Supply Chain PrioritiesFigures 5 and 6: Estimated Level of Service for Brisbane and Adjacent Regions 2012 and 2031 While the recently completed PoBM, and soon to be delivered Port Drive upgrade, will provide significant benefits to the port and its supply chain, road capacity will need to be monitored and maintained to accommodate longer-term demand (see further discussion about this in relation to the national freight performance network). 3.5 Rail Access and Capacity Freight throughput at the Port of Brisbane is growing. By 2040, the port is expected to be handling up to 4 million TEU. However, without dedicated freight rail access to the Port, pressure will increase on existing landside infrastructure, including the broader road and rail network. The current freight line to the port shares the same corridor as a number of Brisbane’s metropolitan passenger rail services (the Metro). The potential to maintain and/or grow rail freight using this line is constrained as a result of the increasing frequency of passenger rail services. The result is Australia’s poorest performing freight rail share at less than 3% of intermodal freight (see figure 7). Without significant improvements to the existing line and/or the development of a new dedicated freight rail corridor, productivity will decline due to increased road congestion, transport costs will increase and these factors could potentially constrain trade growth through the Port of Brisbane. Page 10 | 24 July 2017 | Response to the Inquiry into National Freight Supply Chain Priorities
Figure 7: Continuing Low Rail Mode Share

Figure 8: Port Rail Network (Existing and Indicative Proposed

PBPL strongly supports the preservation of a dedicated/segregated freight rail corridor to the port which may link with the
Federal Government’s Inland Rail project; a 1700km dedicated freight network linking Melbourne to Brisbane that is presently
being planned for development over the next decade by the Australian Rail Track Corporation (ARTC).

The Port of Brisbane requires dedicated freight rail infrastructure to handle increasing numbers of containers but also to
service the growth potential of the key agriculture and resource sectors throughout regional Queensland and New South

Page 11 | 24 July 2017 | Response to the Inquiry into National Freight Supply Chain Priorities
Wales. Once complete, a dedicated freight rail connection to the Port of Brisbane can link to a national freight rail network,
providing greater access and modal choice between Australia’s ports. Ultimately, these projects will transform freight transport
on Australia’s east coast. Containerised rail export potential through the Port of Brisbane is predominantly primary products
(e.g. meat, grain and cotton) but, due to rail capacity / infrastructure constraints, the volume of such trade is presently
restricted as is the potential to carry imported products by rail.
The key rail constraints are:
Passenger volume growth in, and conflicts with, the Brisbane metropolitan network especially the impact of passenger
timetables moving to 15 minute intervals (passenger trains are given priority over freight under State government
Legislation)
Restrictive axle-loading limits that reduce freight train load capacity / payload
Existing restrictions on freight train lengths
Seasonal fluctuations in demand for agricultural bulk rail services (e.g. Reductions in grain train sets)
Restrictions on larger locomotives and the inability to carry 9’6” ‘high cube’ containers on the western line due to
restrictive tunnel clearances
Restrictions on bulk coal movements resulting from the limitation of range crossing infrastructure / path slots (that would
open up exports through Brisbane from the Surat Basin), and conflict with non-coal traffic
The competitive prices and flexibility to move cargo via road as opposed to rail potentially stifles modal shift
Rolling upgrades of road infrastructure alone are not seen as providing a long-term solution for the region’s freight transport
challenges due to:
The capital and higher maintenance cost of road infrastructure
The negative environmental impacts of road transport
Increased overall logistics costs associated with road usage (particularly when the true costs of road usage are factored
in)
Safety issues of increasing freight on road
(Ultimately) increasing congestion at pinch-points even with continual expansion
In line with global transport trends, South East Queensland must plan for a more balanced appropriate modal share for its
landside logistics function. The existing transport network does not have the capacity to meet the future freight task in the
long-term due to the expected strong, long-term growth in trade.
As a consequence, PBPL initiated a detailed pre-feasibility study in 2013 to investigate the need and priority for a dedicated
freight rail corridor connecting the Port of Brisbane, South East Queensland and the regions to ensure Brisbane and
Queensland continue to grow and remain domestically and internationally competitive. There are four strong rationales for the
Port Rail Connection (PRC):
Reduces growing congestion problems in South East Queensland by dealing with the growing freight task which ultimately
enables better long-term planning in Brisbane that will also deliver:
- improved road safety
- reduced road capital and maintenance costs
- reduced greenhouse emissions
- the potential to provide better inner-city residential amenity and passenger train services by removing freight rail
traffic from inner-city areas
Creates the viable, efficient, long-term route to market that the region’s agricultural industry needs to compete successfully
in the future global marketplace as demand for Australia’s food exports increases.
Unlocks the significant potential for thermal coal exports in the southern Surat, Ipswich and Clarence-Moreton Basins as
well as providing a significant funding source for the development of the (PRC).
Enables the development of the Melbourne to Brisbane Inland Rail to create a truly national rail freight network with the
ability to improve the efficiency of container movements on the Eastern Seaboard by solving a key freight bottleneck for
containers travelling to or through Brisbane. It also has the potential to increase competition between ports.
Page 12 | 24 July 2017 | Response to the Inquiry into National Freight Supply Chain PrioritiesCase Study – The Impact of the Imbalance between spending on roads and rail. There appears to be significant imbalance between expenditure on road and rail infrastructure, with roads the winner. This has contributed to the gradual decline in the number of containers transported to the Port from the west on the western and south western lines, to the extent that it is now zero. At the same time improvements on roads has allowed high productivity vehicles (HPVs) with bigger payloads to access the network and get access to the Port. For example, the ability of the 30m 4TEU A double HPV to access the Port of Brisbane from as far away as Goondiwindi and Moree in Northern NSW has proved a major productivity gain for the transport of containerised grain and cotton to the Port of Brisbane for export, because an A double can transport two heavy 20 ft grain containers and two 40 ft heavy cotton containers, compared with previous vehicles (B doubles and semi-trailers), which are only able to carry one 20 ft grain container or one 40 ft cotton container. These vehicles have been approved access to the Gore Highway, the Cunningham Highway, the Warrego Highway, as well as the Ipswich, Logan, Gateway, and Port Motorways in order to get to the Port. Although the performance of these vehicles has been comprehensively assessed, they have been granted access to the above roads and motorways because these roads have been upgraded to 4 lanes (two in each direction – except for the Cunningham Highway) and can safely accommodate a longer vehicle. This is the result of significant expenditure of funds on road infrastructure in SEQ over the last few years. It is therefore no surprise that rail is no longer used for the transport of these commodities from the west and south west. Evidence for this imbalance is provided in the April 2016 Grattan Institute Report “Roads to Riches – Better Transport Investment”. For the period 2005-6 to 2014-15, “Road investment has been notably high in Queensland, both in freight and passenger terms, and not simply because Queensland has a larger road network”. (P27). In addition the DTMR QTRIP investment breakdown of 2 August 2016 indicates that the four year (2016/17 to 2019/20) total of road and rail expenditure is $17.526m on roads and $2.476m on the QR network. Rail gets 12%. 4.0 Freight Data Gaps The 2016 NTC Report “Who moves what where” identified a gap in rail data caused by rail operators being reluctant to provide data on a commodity specific level, likely because of concerns about confidentiality. This problem extends to track owners (at least in Qld). They also get limited information from their above rail customers (at least in Qld) beyond tonne/kilometre figures. If they are unable to access more detailed freight data from their customers, it is not surprising governments can’t. However this issue extends well beyond rail data. The Container Logistics study carried out by PBPL in 2013 required access to container origin and destination data, which was provided by the stevedores and transport operators, and to a lesser extent shipping lines and container parks. The study was carried out by an independent consultancy and required both the privacy and confidentiality of data to be preserved. Had an independent firm not been used, it is highly unlikely industry would have been prepared to provide the data, even though individual businesses would not be identified. The same situation would apply to other major ports which have carried out similar container logistics origin/destination studies. For this study, PBPL was provided with access to ABF data (with some difficulty). ABF data was vital because it enabled container origin/destination data, especially for imports, obtained from other sources (mainly transport operators) to be validated. The NTC has only recently announced that the ABS and the NTC have negotiated access to ABF IMEX data on a more regular basis. It is not clear how this data will be able to be accessed, especially by Ports. Nevertheless it is a positive development. A Grattan Institute Report (mentioned earlier) stated that 20% of road freight (measured in tonne kilometres) occurs within the four cities with major container ports, however it also stated that it could not be valued because the data is not available. A sizeable proportion of this will be IMEX freight. The ABF data would enable at least the IMEX portion of it to be valued. 4.1 Collection of Data Much of the freight data which is so essential for transport planning is held by the private sector and it is often reluctant to provide it to governments because of concerns about commercial confidentiality. Aside from legislation, one way to solve this would be to establish an independent body (or utilise an existing one) to receive, de-identify and distribute private sector data to government agencies who need it. It could be set up to handle freight data for both the Commonwealth and the States, or each state could set up its own body (or use an existing one) and link it o the Commonwealth. Page 13 | 24 July 2017 | Response to the Inquiry into National Freight Supply Chain Priorities
It is understood that this model applies in other countries, and could be applied here as well.
5.0 Urban Growth Pressures
Urban growth, such as the sun-belt migration experienced in SEQ over recent decades, is simultaneously a key driver of
economic growth and (where poorly managed) a potential constraint on port capacity.
Where a port’s footprint (including shipping channels, wharves, berth pockets and swing basins, port land, surrounding buffers
and landside freight transport linkages) is not strategically accommodated in local and regional planning, unfettered urban
growth can:
constrain existing freight corridors thus leading to congestion, compromised road safety, increased road maintenance
costs, increased greenhouse emissions and reduced economic efficiency. While such impacts are of notable concern
to ports and port related industries they also have the potential to collectively reduce a region’s liveability.
restrict the ability to physically and politically accommodate new transport infrastructure (e.g. new rail infrastructure)
through the burgeoning fabric of a cityscape.
simultaneously reduce the amenity of higher-order land uses (e.g. residential areas and public realm) and industrial
areas where incompatible activities are not appropriately or effectively segregated and/or buffered.
In order to address these challenges, PBPL has:
developed close working relationships with Brisbane City Council (BCC) and a variety of State regulatory agencies in
jointly delivering local and regional land use planning strategies aimed at recognising the port’s primacy as a regional
industrial and freight hub;
sought recognition of the ports existing and future transport infrastructure corridor requirements in BCC’s City Plan
and the SEQ Regional Plan 2009-2031;
through, its own Land Use and Master Plans sought to accommodate growth while preserve industrial amenity via
integrated port buffering strategies;
sought to achieve the broader planning principles outlined in such government initiatives as the National Ports
Strategy (2010), the Australian Infrastructure Plan (2015), Moving Freight (2013), the Coastal Management Plan
(2014), the Queensland Ports Strategy 2014 and the State Infrastructure Plan 2016.
The pressures of urban growth have a significant impact on the Port of Brisbane. This was clearly demonstrated in the 2013
supply chain investigation by PBPL/(QTLC). Of the full and empty containers (975,000 TEUs in 2012 – now >1.2M TEU)
tracked along the Port’s logistics chains, 95% (97% in 2016/17) of all import/export containers were transported on road (with
the balance transported by rail to and from the BMT – primarily from the Darling Downs (this service has since ceased),
central Queensland and Townsville). Of the containers transported by road:
Import Containers
About 25% are unpacked in or near the Port
Over 60% unpacked in Brisbane, the majority being within 40km of the Port,
Over 90% are unpacked in Brisbane or adjacent regions, the majority being within 100km of the Port
Export Containers
About 30% are packed in or near the Port
Over 40% are packed in Brisbane, most being within 40km of the Port
About 75% are packed in Brisbane or adjacent regions, the majority being within 100km of the Port
About 25% are packed in other Queensland regions (e.g. Darling Downs, and a small percentage are packed in
Northern NSW)
The container movements by road to importers and from exporters used most sections of the major road network in and
beyond Brisbane. Significant congestion occurred on a number of road sections in 2012. The quality of the road network and
the capacity of rail to meet the growing freight task (where rail can be utilised in metropolitan and regional areas) are critical to
the Port’s ability to optimise freight efficiency by road.
As indicated earlier in the Grattan Institute report (page 29), the importance of urban freight is evidenced by the fact that 20%
of Australia’s road freight (measured in tonne kilometres) occurs within the four cities with major container ports: Sydney,
Melbourne, Brisbane, and Fremantle (this is further discussed below).
6.0 Port Corridor Pressures
6.1 Port Rail Connection (PRC)
As noted above, the current freight rail access to Port of Brisbane is constrained by a range of factors including low
Page 14 | 24 July 2017 | Response to the Inquiry into National Freight Supply Chain Prioritiesinfrastructure standards (axle loads, train length and structure clearances), and availability of train paths. Train path constraints are a combination of needing to share trackage on sections of the freight routes through the Brisbane metro system, and the severe capacity constraints on the main freight link across the Toowoomba Range. Rail has struggled to provide an effective service for agricultural products from the Darling Downs region, exported through Brisbane, with road significantly increasing its share of this market. Major investments in the road network, and the upgrading of the major road links to the Port for A-Double high productivity vehicles, has significantly contributed to this loss of rail mode share for these contestable freights. The Melbourne – Brisbane Inland Rail project offers a game changer in respect of the major rail infrastructure limitations on the existing narrow gauge network from the south west to Brisbane (Acacia Ridge). This provides for a significant increase in axle load and maximum train length, and elimination of the vertical clearance constraints to permit high-cube containers and double stacking. The Inland Rail Business Case relies on a significant uplift in railed freight volumes for export through the Port of Brisbane. This includes coal, bulk grain, and containerised grain, meat and cotton exports. There is also an expectation that new, more remote intermodal terminals in South East Queensland (e.g. at Bromelton, Ebenezer and Toowoomba) will result in viable rail port shuttles. The current Inland Rail project planning stops at the southern entry to Acacia Ridge. Planning for the rail link from Acacia Ridge to the port has yet to arrive at a definitive future-proofing to meet the future rail freight traffic demand. The existing route provides for dual gauge, but shares track sections with the Brisbane Citytrain passenger services, has infrastructure limitations (train length and height clearances), and is capacity constrained. It is subject to the priorities of the passenger network operation, with freight curfews during the weekday AM and PM passenger peaks, and a track maintenance and asset renewals closure regime optimised to suit passenger operations. This includes night time closures and extended week-end shutdowns to undergo programmed maintenance and asset renewal activities. It also includes a number of level crossings, including the high volume crossings at Cavendish Road and Kianawah Road. On 9 May 2017, the Federal Government included $8.4 billion in its 2017/18 budget to deliver the Melbourne to Brisbane Inland rail project. While PBPL supports the project, we also support the development of a dedicated freight rail connection from the Inland Rail project to the Port. In our view, it is necessary to ensure long-term future trade growth does not negatively impact Brisbane’s liveability – if the containers don’t come by rail, they will ultimately come by road The Minister for Transport, Darren Chester has recently said that the Commonwealth is keen to work with the Queensland Government on how best to move freight from Acacia Ridge to the Port of Brisbane, which involves initial planning on the most efficient way to get to the Port. That work is likely to involve a corridor assessment, and we hope both levels of government can work together to make that happen as soon as possible. There is still no timeframe for when this assessment will be undertaken. If the Port is not be constrained by reduced rail and road capacity in the future, the Port Connection needs to be constructed in conjunction with Inland Rail. Measures to preserve the corridor should be initiated now, as the PRC will likely be required within 10 or 15 years, depending on the impact of Cross River Rail (CRR) and the level of congestion on the urban road network. The impetus for preservation of this corridor now has been highlighted by a July 2017 Infrastructure Australia Report “Corridor Protection – Planning and Investing for the Long Term” which estimated savings of about $66 m in projects costs from protection and early acquisition. PBPL supports the finding of the Report that a national framework of corridor protection is required to guide coordinated and meaningful action by all levels of government. 6.2 Cross River Rail (CRR) There is an additional rationale for the Port Connection – Cross River Rail (CRR). CRR is a major rail project which is designed to provide a significant increase in passenger rail capacity in SEQ. It comprises the proposed construction of new tunnels under the Brisbane River, a number of new stations, and rail upgrades in the Brisbane metropolitan area. The recent Queensland State budget allocated $2bn towards the project. CRR will have a negative impact on freight rail capacity, especially for trains from the west and south west, which are required to use the urban network to get to and from the Port. CRR proposes no increase in capacity for freight trains from the west and south west, which, given mooted increases in the number of passenger trains (the rationale for CRR), will effectively reduce capacity for both narrow gauge and standard gauge freight trains. The Port Connection solves this problem, as it will allow freight trains travelling to the Port from the west and south to avoid the urban network completely. 6.3 Bigger Ships/Channel Deepening Increasing trade is driving increased shipping efficiencies, with longer, wider and deeper vessels being built to service this demand. PBPL is currently experiencing demand from shipping lines to accommodate up to 8,500 TEU vessels ( a 8,500 Page 15 | 24 July 2017 | Response to the Inquiry into National Freight Supply Chain Priorities
TEU vessel recently successfully docked at the Port). Over the next 30 years the maximum size of vessels will increase
further: potentially up to 13,500 TEU, neo-panamax vessels. This will drive required improvements to the shipping channel
and swing basin(s).
The need to accommodate bigger ships is not confined to the Port of Brisbane given that most container ships call at all
the major Australian Ports (Sydney, Melbourne, Fremantle). Therefore this is an important consideration for the Strategy,
because if inaction results in vessel restrictions, especially on the eastern seaboard, the economic impact is likely to be
significant.
These changes have implications for dredging (and the disposal of dredge spoil) and the need to optimise future channel,
berth and swing-basins.
Access to the Port of Brisbane is via Moreton Bay, where deep-water channels are a minimum 280m wide from Fairway
Beacons to Entrance Beacons, and the minimum depth is 15m LAT. Pilotage is compulsory for ships over 50m length
overall.
Maintaining deep-water access to the port via the channels in Moreton Bay is required to safely accommodate future trade
with larger vessels. It is essential that PBPL provides appropriate channel width and depth, berth and swing-basin
arrangements as part of its Port Access Strategy.
Port access channel initiatives include the widening, deepening and realignment of the shipping channel.
It is proposed to widen and realign the Spitfire Channel, which will shorten the overall length of the channel and remove two
sharp turns. The Spitfire Channel forms part of the 90km navigational shipping channel, which stretches from the northern tip
of Bribie Island to the mouth of the Brisbane River. PBPL has secured approvals to remove a total of 15 million m 3 of sand
from the Spitfire Channel over a 15 year period (approval issued in 2006 and amended and renewed in 2012). Presently there
is approximately 7.8 million m3 of this approval remaining. Based on current assumptions, the existing development approvals
require review in around 11 years. Sand removed will be subsequently used in the reclamation of the FPE and land
improvements at Port North.
The Harbour Master and Brisbane Marine Pilots have indicated that current pilot practices can require ships to navigate
outside the bounds of the declared shipping channel in parts of the North West Channel in certain circumstances. It is
proposed as part of the channel optimisation work (discussed below) to modify/realign the shipping channel to better
accommodate vessel manoeuvring and to both optimise natural depth and dredging requirements.
As mentioned, the aim for optimisation of the main shipping channel to Fisherman Islands is to progressively accommodate
larger vessels (initially up to 8,500TEU) entering and exiting the Port on commercially viable tidal windows. This may require
some truncation of the corners and relatively minor adjustments in the North West Channel. Beyond these initial requirements,
the deepening of the Bar Cutting and Fisherman Islands’ existing Swing Basin (currently declared at 14m) and some selective
channel deepening (beyond existing 15m declared depths) will be required. Allowing for larger cruise vessels at a new,
adjacent deep-water berth and terminal is also viewed as a high priority in this regard.
A new Swing Basin is also likely to be required as part of this channel deepening project due to the length of the larger
container vessels, which will not be able to swing in the current Swing Basin if vessels are at the Port North Common User
Berth and Caltex berths. A second swing basin is being advocated by MSQ for this purpose and the area opposite berth 10
has been identified should this be required. Further study of these requirements may be required in the medium term to
determine future needs for a second swing basin in the Fisherman Islands precinct.
Once modelling results have been verified, to optimal access for 8,500 TEU ships, new operational rules and dynamic
systems will need to be implemented by the Harbour Master.
Initial investigations have confirmed that subject to minor dredging and modifications in the North West channel, it will be
possible that the larger 8,500TEU container vessels may be able to utilise the existing channel (subject to some realignment)
on limited tidal windows. PBPL is therefore finalising additional studies with the Harbour Master and pilots to assess this
possibility and/or to identify the extent of any deepening required.
When deepening is required, one of the risks this project presents is the dredgeability of the indurated sand located in the
North West Channel. A dredging trial has recently been conducted (December 2014) to determine with more certainty the
ability to dredge this material and its engineering properties. Understanding these will inform future dredging costs, the
optimal amount of deepening and the disposal strategy for the material.
The Bar Cutting/Swing Basin deepening work could potentially be undertaken by the company’s own dredger (TSHD Brisbane
or a replacement), but the North West Channel would be required to be undertaken by a contract dredger because of the
potential volume to be removed and the hardness of the indurated sand. The deepening work in the Bar Cutting and Swing
Basin would be timed to suit the program of the company’s dredger and the phasing of reclamation paddocks’ availability. The
material from the Bar Cutting dredging is suitable for bund strengthening works and is critical in terms of the timing and
availability of relevant parts of the FPE land for development.
Monitoring and investigation of future channel depth is an ongoing safety and environmental requirement and involves:
More detailed dredging investigations
Developing a greater appreciation of industry demand and the progressive trend toward the use of larger cargo ships
Page 16 | 24 July 2017 | Response to the Inquiry into National Freight Supply Chain Priorities The ongoing reviews of how changes in channel depth will impact upon the FPE reclamation program
Ensuring the minimisation of any adverse environmental impacts associated with additional dredging activity. In the
event that additional channel deepening may be pursued, the relevant state and federal approvals would be sought in
accordance with all relevant legislation (including requirements to engage / consult with the community).
The timing of any deepening work will in part be dependent on the demand for larger vessels servicing Australia. This
demand is expected to come primarily from larger container vessels but may also result from coal and wet bulk. The impact of
any change on the FPE Reclamation Program will need to be assessed because most of the material from the deepening
project is placed ashore into the FPE.
Figure 9 Channel Optimisation Dredged Investigation Sites
In a MSQ Report (2008), utilisation of the existing channel was estimated to be at between 20-30%, with 2,500 movements
per annum. Currently the port still has around 2,500 port calls per annum. As container ships generally get larger, this level of
shipping movements is not expected to grow significantly, which means that there is more than adequate capacity for at least
the next 30 years before we could anticipate any channel congestion impeding efficient port access.
Other initiatives include investigations to incrementally deepen river channels by targeting high points at the Lytton Rocks
precinct using PBPL’s Ken Harvey grab dredger. The objective of these investigations is to obtain greater under keel
clearance in the river channels if possible.
A critical aspect of maintaining Port access is maintaining a dredge material disposal area for material dredged from channel
maintenance, channel deepening and development of new berths.
PBPL is currently working with Maritime Safety Queensland and industry experts to finalise the deployment of an under-
keel management system that will significantly improve the navigability of the Port of Brisbane shipping channel. It is
intended to introduce this system in 2017/18. It is expected to allow greater channel access for bigger ships and
negate/delay the need for the channel to be deepened.
6.4 Dredging and Land Reclamation
Page 17 | 24 July 2017 | Response to the Inquiry into National Freight Supply Chain PrioritiesCurrently, material dredged during maintenance of the port’s channels in the Brisbane River (including the Bar Cutting) is used
as the initial filling layers in the FPE to create new land which will be used in the future for port related development. The river
frontage of the FPE will ultimately be developed as shipping terminals and new berths will be dredged along this frontage.
The exact timing for such uses will depend on demand as trade growth continues.
In addition, PBPL currently possesses conditional approvals to place up to 5 million m 3 of suitable dredge material at the Mud
Island disposal site until 2023 (see diagram below).. Under these approvals all dredged material must be sampled and tested
in accordance with the 2009 National Assessment Guidelines for Dredging (NAGD) and only material determined to be
suitable for ocean disposal is placed at Mud Island in accordance with the conditions of.
The purpose of these approvals is to accommodate for the Mud Island placement of low risk material thereby maintaining the
FPE for material unsuitable for ocean disposal in accordance with the NAGD (either contaminated or not yet tested – i.e. flood
material). This arrangement:
provides PBPL with sufficient State-sanctioned capacity/flexibility to deal with seasonal variations in sediment loads
(up to and including major flood event sediment deposition)
extends the ‘working life’ of the FPE as a dedicated site for dredged material placement (including material unsuitable
for ocean placement)
avoids the alternative scenario where PBPL and the State would need to seek and sanction time and resource
consuming Temporary Emissions Licenses
Figure 10: Mud Island Dredged Material Placement Area
These factors highlight the importance of the Mud Island disposal arrangements in PBPL’s longer-term planning for
sustainable dredged material placement and emergency response to flood events and as such highlights the importance of
this arrangement being secured permanently (i.e. beyond 2023).
Page 18 | 24 July 2017 | Response to the Inquiry into National Freight Supply Chain Priorities6.5 The Future Port Expansion (FPE) Area
Figure 11: Future Port Expansion (FPE)
The FPE (see diagram above) is divided into a series of paddocks that:
Require the construction of internal walls within the outer rock wall formations
Are progressively filled and surcharged to create areas that will eventually be used for port-related development
Primarily use material sourced from capital and maintenance dredging in the Brisbane River and Moreton Bay
It takes approximately 10 years from the commencement of dredged material placement in a paddock, to have land in a
geotechnical state capable of supporting port-related industrial development.
PBPL has developed a reclamation model in-house to take into account various drivers and provide an estimate of the life of
the FPE based on the numerous factors discussed. Its primary function is to guide the shorter term reclamation and ground
improvement activities and inform longer term planning. It is reviewed annually and updated taking into account actual
reclamation and ground improvement activities completed during the year.
PBPL’s port reclamation modelling takes into account factors including:
The anticipated volumes of river material to be dredged (i.e. ~450,000m3 per annum (accounting for flooding events)
until 2026 then reducing notably due to fulfilment of dredging obligations upstream of Pinkenba)
The anticipated volume of material to be dredged by deepening the main shipping channel. High estimate of volume
to be accommodated with the FPE are more than 4M cubic metres
The receiving capacity of each FPE paddock (including surcharge requirements, ground improvement timings and
the requirements for channel deepening)
Obtaining relevant approvals to place suitable material (i.e. select maintenance material, capital material from the bar
cutting and future berth pockets), at the Mud Island Placement Area.
The requirements for future channel deepening and berth development (e.g. Berths 13-16 at Fisherman Islands)
Based on the factors above, it is anticipated that the FPE could be managed to enable it to receive dredged material from port
operations until at least ~2045. This date is subject to change, as land reclamation rates may need to be increased to cater
for additional land demand for port industry.
Page 19 | 24 July 2017 | Response to the Inquiry into National Freight Supply Chain PrioritiesDespite this capacity, a critical issue for the port remains the ongoing need to have a site for disposing / handling of the maintenance dredge material from the river. In this regard, strategies are currently being investigated to prolong the life of the FPE as a dredged material placement site, while accommodating envisaged demand for additional port land. These strategies include raising the level of the land as much as possible and maximising the capacity of approved offshore disposal locations (e.g. the site at Mud Island). Another factor is the timing of demand for port land to service the anticipated growth in trade volumes. Although accelerated demand needs to be considered relative to the competing need to preserve/optimise dredged material disposal capacity, if land demand slows there are potential benefits in delaying reclamation activities with regard to delaying cargo, preserving disposal capacity and not hindering land take up. Therefore, land demand needs to be carefully modelled so as to optimise land reclamation to meet demand on a ‘just in time’ basis. Should the timing for development of additional infrastructure, such as berths 13-16 and channel deepening change, and/or approvals for placing dredged berth material at Mud Island not be renewed beyond 2023, then the capacity of the FPE could be consumed at a much faster rate. 6.6 Post Completion of the FPE To mitigate a key strategic risk, various strategies have been identified for the disposal / handling of material once the FPE can no longer be used for this purpose. Final conclusions on this issue will not be determined for some time, as implementation of a deliberate strategy is some years away and future environmental management requirements are presently unknown. As the current placement strategies are expected to meet the needs of the port for the medium term, PBPL in consultation with government will continue to develop and refine strategies for material placement beyond this time in accordance with our general obligations under the lease from the State of Queensland. Such investigations will consider the options outlined above in addition to monitoring the emergence of new technologies and commercial opportunities associated with the use of dredged materials. 7.0 Supply Chain Integration and Regulation 7.1 Supply Chain Integration Whilst the physical movement of freight along both domestic and international supply chains in Australia is probably efficient, the lack of supply chain visibility across transport modes generates inefficiencies and costs to freight owners and end users /customers alike. This is largely because of poor, inefficient or incompatible interfaces between systems and organisations within supply chains, over-reliance on manual transactions, and lack of data standards and interoperability between systems, which results in loss of visibility and increased costs. This has been demonstrated in a recent project undertaken by Austroads “Investigating the potential benefits of enhanced end to end supply chain visibility” This not a major problem for integrated supply chains which have effectively removed the interfaces by internalising them eg, international freight forwarders which control the movement of import cargo from overseas origin through to destination DCs in Australia. However most supply chains comprise a number of independent entities which are required to interface with each other to meet freight owners’ requirements. The inefficiencies of import/export (IMEX) container supply chains are a particular manifestation of this issue, because of the number of organisations involved (eg, importers, exporters, forwarders, customs brokers, stevedores, shipping lines, road and rail transporters, container parks), and the involvement of regulators such as ABF and Quarantine. These inefficiencies can be overcome by a Port Community System (PCS) or Port Information System, which when developed, becomes a key piece of port infrastructure, albeit IT infrastructure. The technology to develop a PCS exists now. The Port of Brisbane is investigating the development of a PCS to assist its stakeholders to reduce supply chain costs, especially for exporters. 7.2 Regulation There are two areas of regulation which are adversely affecting the Port and its supply chains: coastal shipping and the regulation of heavy vehicles. Page 20 | 24 July 2017 | Response to the Inquiry into National Freight Supply Chain Priorities
You can also read