Positive Energy District (PED) Selected Projects Assessment, Study towards the Development of Further PEDs - UPV/EHU
←
→
Page content transcription
If your browser does not render page correctly, please read the page content below
Environmental and Climate Technologies
2021, vol. 25, no. 1, pp. 281–294
https://doi.org/10.2478/rtuect-2021-0020
https://content.sciendo.com

      Positive Energy District (PED) Selected Projects
      Assessment, Study towards the Development of
                       Further PEDs
                                Sofia RUEDA CASTELLANOS1∗, Xabat OREGI2
             1Faculty  of Engineering, University of Mons, 9 Rue de Houdain 7000, Mons, Belgium
 1University    of the Basque Country UPV/ EHU, Plaza Ingeniero Torres Quevedo 1-1 48013 Bilbao, Spain
  1Department     of Mechanical Engineering, Heriot-Watt University, UK EH14 4AS, Edinburgh, Scotland
     2CAVIAR    Research Group, Department of Architecture, University of the Basque Country UPV/EHU,
                                 Plaza Oñati, 2, 20018, San Sebastián, Spain

      Abstract – Positive Energy District (PED) is a relatively new concept from which many
      projects are planned, however, only a few cases are currently close to be materialized,
      therefore, in this study the PED projects in operation and in implementation process in
      existing districts are gathered in order to serve as a base for future PEDs. In this sense, certain
      points of each selected project are highlighted due to their relevance within the project
      development and their replicability potential. Furthermore, intending to learn from the
      experience of the assessed case-studies, this paper aims to understand the current situation
      regarding PED implementation to simplify the development of further PEDs.

      Keywords – Energy performance of buildings; Positive Energy District (PED); PED solutions;
      Smart Cities; Positive Energy Block (PEB); urban energy transition

1.     INTRODUCTION
  Jointly with the population growth in cities, environmental and energy challenges are
increasing. From this perspective, the necessity for a significant decrease in greenhouse gas
emissions, the increment of the share for renewable energy and the improvement in energy
efficiency are targeted through energy and climate goals. In this sense, European Union (EU)
member states have set an energy saving target of 30 % to be reached by 2030 in addition to
the commitment to decrease the greenhouse gas (GHG) emissions by 80–95 % by 2050 [1].
Furthermore, the European Directive EPBD (Energy performance of buildings directive)
requires all new buildings from 2021 to be nearly zero-energy buildings (NZEB) [2].
Moreover, at the city scale, for example, Limerick, Ireland aims to become by 2050 a Positive
Energy City [3] and Turku, Finland aims to be carbon neutral by 2029 and climate positive
from then onwards [4].
  Furthermore, in order to tackle issues in cities, initiatives are available at different scales,
buildings, city-blocks, neighborhoods and districts [5]. The approach of this paper is at the
district scale. Despite the fact that buildings account for nearly 40 % of final energy

∗Corresponding author.
E-mail address: sofirc7@hotmail.com
©2021 Sofia Rueda Castellanos, Xabat Oregi.
This is an open access article licensed under the Creative Commons Attribution License (http://creativecommons.org/   281
licenses/by/4.0).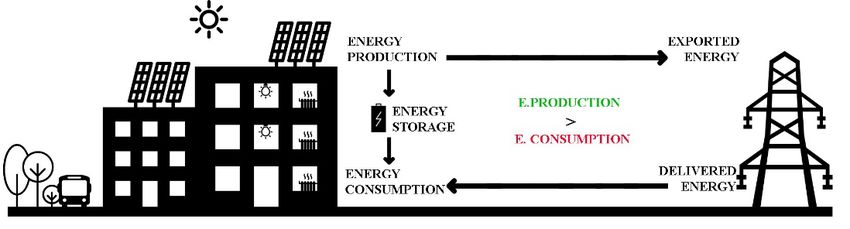
Environmental and Climate Technologies
 ____________________________________________________________________________ 2021 / 25
consumption [6], in districts, buildings should not be seen as individual systems, to focus on
the district level means to gather entities (citizens, buildings, mobility, electricity grid,
infrastructure, etc.). In this paper the Positive Energy District (PED) will be addressed.
  A PED consists of several buildings (new, retrofitted or a combination of both) that actively
manage their energy consumption and the energy flow between them and the wider energy
system. PEDs have an annual positive energy balance [7] which means that it is an area where
energy production is higher than energy consumption.In addition to buildings, other urban
infrastructure are included, such as waste and water management, parks, open spaces and
public lighting, as well as transport [8]. Fig. 1 illustrates the PED definition in an attempt to
ensure its comprehension.

                                   Fig. 1. Graphical explanation of a PED.

  Furthermore, a PED includes aspects such as the management of local Renewable Energy
Sources (RES) which are the main energy generation source of PEDs. Another important
point is that when a district produces more energy than it consumes the surplus energy can be
either stored locally or exported, in case of export a connection to the power grid in order to
sell energy if there is a surplus or, to buy energy when their own is not enough is needed [8].
Moreover, energy generation techniques, increased deployment of smart e-mobility, building
retrofitting, smart energy grids, ICT (Information and Communications Technology), and
energy efficiency are also comprehended in the PED.
  PED is a concept that, at the present moment, in existing neighborhoods, is only theoretical,
since none of the PED projects have been completely implemented nor an operational annual
energy balance has been reached.
  Currently, there are two programs that target PED: The Program on PEDs and
Neighborhoods (PED Program) coordinated by JPI (Joint Programming Initiative) Urban
Europe in association with SET (Strategic Energy Technology) Plan Action 3.2 on Smart
Cities [7] with the purpose to support the planning, deployment and replication of 100 PEDs
by 2025 [10] and ‘Horizon 2020’ EU Research and Innovation program followed by ‘Horizon
Europe’ (2021–2027) [6], [11].
  Regarding the research on the PED concept, an important quantity of studies have been
carried out in recent papers [6]–[13]. Conversely, in practice, many PED projects are in
planning stage in places such as Pietralata PED in Rome, Italy [12]. Moreover, there are 21
PED projects [13] that are currently being implemented such as ATELIER in Amsterdam and
Bilbao [12].
  This paper will be focused on assessing only the PED projects that meet two challenges.
The first one is to be implemented in a preexisting neighborhood and the second one is to
have started the project within 2018 or before and estimate to end it by 2024 or before. From

                                                                                             282
Environmental and Climate Technologies
____________________________________________________________________________ 2021 / 25
this perspective, the selected projects are the first PED projects running, thus possibly the
most developed PEDs. In this framework, it is possible to learn from their experiences, and
therefore serve as a base for future PEDs.
This study is organized as follows. An introduction including the PED concept in the
present section, followed by Section 2, where the methodology for analizing the case-studies
is defined. Section 3 identifies the PED projects to be examined; which are: COOPERaTE;
+CityxChange (Positive City ExChange) and Making City. Section 4 integrates and compares
the PED projects of the last section. And the final section (Section 5) synthesizes the findings
in the PED projects assessed that could be profited to develop future PEDs.
2. METHODOLOGY AND ANALYSIS FRAMEWORK PED
With the objective of analyzing the case-studies and making a PED comparison, the
following parameters are considered: project area, land use, tools for energy evaluation, Key
Performance Indicators (KPI) and energy data. Furthermore, solutions for the implementation
of a PED are also assessed; for this, three areas are analyzed: 1) improvement in energy
efficiency of buildings, e.g., the enhanced building envelope, 2) RES (Renewable Energy
Sources) to be implemented in the district, and 3) energy storage technologies.
3. PED PROJECTS ANALYSED
In the following sections, the selected PED projects listed in Table 1 will be described and
assessed as a means to be taken as good practices towards the development of futures PEDs.
Moreover, this paper only presents projects in existing neighborhoods and only the first
projects running, due to the information availability and the progress achieved within time.
TABLE 1. PED PROJECTS IN IMPLEMENTATION PHASE OR OPERATING IN EUROPE [12]–[14]
Phase Project name District City, Country
In operation 2012– CIT Bishopstown campus Cork, Ireland
COOPERaTE
2015 The Bouygues Challenger campus Guyancourt, France
+CityxChange Georgian district Limerick, Ireland
(Positive City
In implementation ExChange) Sluppen-Tempe, Brattøra, Gløshaugen Trondheim, Norway
process 2018–2023
Groningen North and South distrcts Groningen, Netherlands
Making-City
Kaukovainio Oulu, Finland
3.1. CIT Bishopstown campus, Cork, Ireland
The CIT (Cork Institute of Technology) Campus Bishopstown is a neighborhood where
three main buildings can be found: NIMBUS, Leisure world (Sports center), and Parchment
square (Student accommodation). The input, implemented services and main output of the
case-study are shown in Table 2 with the purpose to have an overview of the project.
For CIT Bishopstown demonstration site there were some constraints that did not make
possible to consider a full year reporting period. Nevertheless a 1-week (13th to 17th February
2015) reporting period that corresponds to high heating demand was assessed. In addition, a
1-week period during summer and an intermediate week were also considered.
283Environmental and Climate Technologies
____________________________________________________________________________ 2021 / 25
TABLE 2. INPUT, IMPLEMENTED SERVICES AND OUTPUT IN BISHOPSTOWN [14], [15]
Input Implemented services Output
− Weather forecasts − An optimization engine capable − A comparison between a
− Energy price forecasts of exchanging information that baseline and a reported period
considers energy profiles for regarding energy of the
− Energy Contracts neighborhood
working and nonworking days
− Real-time neighborhood load forecasts and a method of − Real-time visualization of the
monitoring of consumption, including Parchment Square in consumption and local
storage and local generation demand response. production
− 12-month historical data of − Real-Time Actuation of − Hourly energy demand
the neighborhood/buildings Optimized Set-Points forecast in day ahead mode
(setpoints, time of (Supervisory Control Service) (kWh)
operation, temperatures, − Decision Support Service
energy consumption etc.) − Yearly energy grid demand
(anonymized data) − Analysis Service for Building forecast (MWh)
Upgrade − Hourly power generation
− Thermal and electrical load
forecasts − Optimization of Power forecast in day ahead mode
Purchases Versus On-Site (kW)
− NICORE, Intel system and
Generation: This process makes − Optimal schedule for
the NIM to determine day-
possible to make the right electrical and heating system
ahead forecasts for the
decision between importing
electrical and thermal − Optimal set-points for local
power from the grid and using
consumption generation system and storage
the local generation.
components
− Energy cost savings (%, €)
Regarding the individual building features in CIT Bishopstown, in Nimbus building the
CHP (Combined Heat and Power) set-points were optimized based upon the electrical and
thermal consumption from the previous day’s forecast [14]. Similarly, in the Leisure world
building (Sports center) the heating load was a constant base load due to the presence of a
swimming pool; for this reason the CHP could operate widely. On the other hand, Parchment
square (the Student accommodation building) implemented an energy optimization algorithm
that allows the battery to be charged when the grid tariff is low and discharged when the tariff
is high [14]. The information on the buildings was gathered to obtain the total values for the
whole district.
Finally, the points to be checked for future PEDs after CIT Bishopstown campus, Cork,
Ireland case-study experience are addressed in the next paragraphs.
It has been found that the optimization system service was the fundamental energy service
to reduce costs. Whereby optimization of power purchases from the grid versus on-site
generation allows the battery to be charged when the grid tariff is low and discharged when
the tariff is high. In short, the optimization system service strategy proved to be able to bring
up to 11 % of economic savings, therefore, it could be useful for further saving strategies in
PED developments.
Moreover, in future PEDs a point to be checked is the possibility to sell energy to the grid
or not, this was one of the main barriers for CIT Bishopstown goals since the energy injected
into the grid was not currently rewarded.
Furthermore, it has been found that the possibility to perform yearly analysis and
measurements must also be assessed. From this perspective, in Cork demo site, there were
some limitations regarding information access, therefore it was not possible to perform a
yearly analysis when for PEDs an annual balance is required. As a replacement, the
measurements took place during one week of summer and one week of winter.
284Environmental and Climate Technologies
____________________________________________________________________________ 2021 / 25
The last point to take into account while looking at this case study as a good practice for
developing PEDs is the fact that CIT Bishopstown district, had as main goal to achieve energy
cost savings. Therefore, the decrease in energy consumption and the increase of local renewable
energy generation were neglected in relation to the relevance of the main economic goal.
3.2. Challenger campus, Guyancourt, France
A similar approach to the previous case-study, is addressed in the present section since both
cases were part of COOPERaTE project. The Challenger campus case-study has features that
Cork did not have such as a cooling system intervention (that had as a result a 70 % decrease
in the consumption), battery storage management and PV (Photovoltaic) panels [14], [15].
In this sense, it was possible to sell energy to the grid when the PV production exceeded
consumptions. On the other hand, the possibility to reach 15 % energy cost savings on the
energy bill was found.
Moreover, some of the KPI used were Total energy consumption (GWh/y), Local energy
generation (GWh/y), Energy savings (%, MWh), CO2 emission reduction (kgCO2, %), Energy
and cost of energy sold to grid (MWh) and Energy cost savings (%, €). Whereby 4 % energy
saving was obtained, in contrast to the Bishopstown campus case-study where no energy
saving was achieved [14], [15]. On the other hand, the district inhabitants are able to follow
in real time the consumption of the site and the nature of energy flows, meaning that they can
know if the energy is coming from the solar panels , the grid or the batteries through a mobile
application.
Finally, the observed aspects for future PEDs after the present case-study experience are
summarized in this paragraph. Challenger campus, Guyancourt, France highlight is located
in the demand-response service integrated the energy market with the aim to generate
possibilities according to the energy prices, consumption, generation and storage.
Similarly, there was the possibility to sell energy to the grid to obtain economic benefits.
Moreover, profitable tools for further PED projects could be the integration of different ICT
platforms as well as the KPIs and the possibility to assess them in an annual period. In
addition, the user awareness system that allows the inhabitants to know the source of energy
supply through their smartphones is also spotlighted in an effort to stimulate the participation
of the inhabitants in the energy system implemented.
3.3. Georgian district, Limerick, Ireland
Within the frame of Horizon 2020, +CityxChange project selected Limerick as one of two
cities to go from 3 Positive Energy Blocks (PEB) 2024 to PEDs by 2030. In Limerick,
Georgian Innovation District a 3D model was built from a footprint file provided by the city
to complete the preexisting information from Open Street Maps, together with other sources.
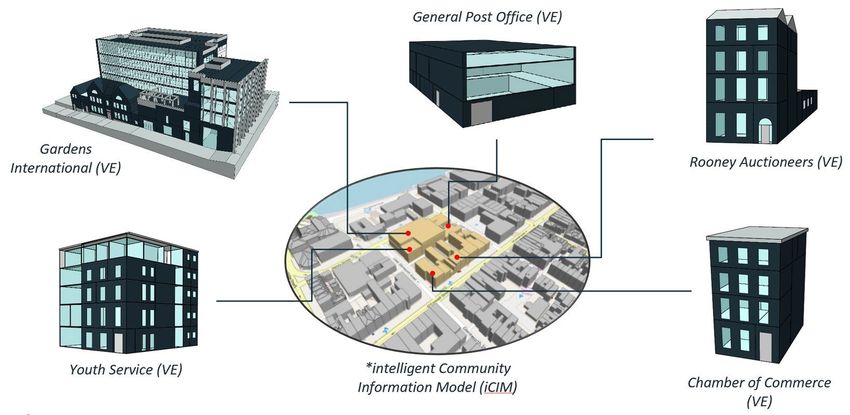
Afterwards 3 blocks were selected to target energy positiveness. As a next step, one block
was selected to firstly become energy positive whereby 5 buildings were selected to be
prosumers [21] due to their high energy efficiency and inhabitants and owners willing to
participate in the project, these buildings are gathered in Fig. 2.
285Environmental and Climate Technologies
____________________________________________________________________________ 2021 / 25
Fig. 2. First city block selected to become energy positive in Georgian district, Limerick [16].
Within the Digital Twin 5 steps to simulate the achievement of the PED were followed:
1. 3D Model. The first step is the creation of a Digital Twin of each building, where data
from the buildings such as the energy bills was used. In addition, the software allowed
to fill the missing data with a Machine Learning regression algorithm to be able to
obtain the annual energy consumption in kWh/m2/year).
2. Improve operational efficiency of the building. Within the 3D model, simple
operational energy efficiency measures were identified. The measures could be
implemented at little or no cost for instance heating controls, individual room
thermostats and reduction of the DHW (Domestic Hot Water) supply temperature. If
the Gardens International building LEED (Leadership in Energy and Environmental
Design) is not taken into account, energy saving of 13 % over baseline across the other
four buildings combined is possible to be obtained [16].
3. Shallow retrofit measures. Building airtightness, upgrades to LED (light-emitting
diodes) lighting systems and dimming controls and boiler upgrades. Together the
operational improvements and these measures have as a result a savings of up to 31 %
excluding the LEED building.
4. Deep renovation measures. Insulation, window retrofit and change of the gas boiler to
an air to water heat pump. When added in conjunction with 3 first stages, the savings
are estimated to 64 % without including the LEED building.
5. Local Renewable Energy Generation. PV panels on two thirds of the roof surface
which covered 14 % of the remaining energy demand of the block were simulated
within the Digital Twin. All of these measures together were estimated to reduce the
total electricity demand for the block from 1.79 GWh/y to 0.6 GWh/y, which is a
reduction of 66.5 %. Moreover a tidal turbine in the nearby river aims to produce
1.0 GWh/y, enabling the block to produce 0.4 GWh/y in total and therefore become a
Positive Energy Block (PEB) [16].
On the other hand, some of the assessed KPIs are: RES share, Increase of total RES, RES
storage Increase in energy storage (MWh), RES efficiency (kWh sqm y), RES integration
(GWh electric / thermal energy of new RES integration), RES flexibility Peak load reduction
286Environmental and Climate Technologies
____________________________________________________________________________ 2021 / 25
(%), Greenhouse gas emissions (Tonnes CO2eq y), Optimized self-consumption (District
level production/total energy consumption), Reduction in energy grid investment compared
to planned investments, Increased uptake of EVs (Electric Vehicles) (%), Decrease in
payback period and Annual return of investment [3].
The remarkable points of Georgian district, Limerick, Ireland regarding the profitability to
achieve PEDs in further projects are the 5 staged achievable percentages of energy saving.
Whereby diverse measures were applied in to be able to obtain approximately 65 % of energy
savings. Moreover, the idea to add up a tidal turbine that in this case would enable the
positiveness of the district [3].
3.4. Sluppen-Tempe, Brattøra, Gløshaugen , Trondheim, Norway
Trondheim was chosen to be one of the leading cities for +CityxChange project together
with the last case-study in Limerick. The project is divided in 3 demonstration areas:
Sluppen-Tempe is an area composed of offices, public buildings and dwellings, in addition,
a new school, a health and welfare center and dwellings are planned to be built. On the other
hand, Brattøra area is integrated by the city’s harbour, the office building ‘Powerhouse’,
which is a Positive Energy Building with BREEAM (Building Research Establishment
Environmental Assessment Method) with outstanding certification, the Business College of
Trondheim BI, hotels, museums, convention center and sports facilities. All of them
connected by an energy management system based solely on electricity. In addition,
apartment buildings and the Trondheim Station Centre are planned to be built. The third
demonstration area is Campus NTNU (Norwegian University of Science and Technology)
Gløshaugen which is composed by seven buildings whereby schools, office buildings and the
new Valgrinda ZEB Flexible Lab are integrated. NTNU is also in the process of building a
new city campus. A remarkable point is that Gløshaugen has its own concession area for both
district heating and electricity and has its own Microgrid [17]. Finally, the Interconnection of
the 3 PEBs in the above-mentioned demonstration areas is planned to arrive to a PED as well
as the case-study in Limerick.
3.5. Groningen North and Groningen South districts, Groningen, Netherlands
Two districts aim to be transformed into PEDs, Groningen North and Groningen South
Districts. Both are integrated by residential and public buildings, high-rises, industrial and
tertiary buildings specifically the Energy Academy Europe Building, Nijestee Highrise 1 and
2, 3 Terraced houses, Mediacentrale, Powerhouse and a Sports complex. To implement the
PED diverse measures are being applied.
Firstly, building retrofitting. Secondly, RES deployment, such as geothermal energy with
heat pumps, a biogas plan in one of the buildings and a large surface of PV panels and solar
thermal energy. The surplus of thermal energy produced aim to be stored and used during
energy demand peaks. A remarkable point is the cycling and electric mobility whereby a
cycling lane will be turned into a ‘SolaRoad’ by the integration of solar panels in its surface
able to produce around 60 000 kWh yearly [18]. Additionally, Smart charging stations for
EVs connection to the grid will be tested and then further scaled.
It is estimated that Groningen North PED will export 70 MWhe/y of electricity and will
import 5.5 MWhth/y of thermal energy (natural gas), for a total balance in primary energy
units of 170 MWhp/y exported outside the district. On the other hand, Groningen Southeast
PED will export 250 MWhth/y of thermal energy and will import 80 MWhe/y of electricity
287Environmental and Climate Technologies
____________________________________________________________________________ 2021 / 25
for a total balance in primary energy of 97 MWhp/y exported outside the district. Thus, both
districts are estimated to have a positive annual energy balance [18].
To summarize, the points to highlight in Groningen, Netherlands PED project are the
building retrofitting coupled with diversified RES. Whereby the consideration of the
geothermal district heating system together with heat pumps fed as well with PV , solar
thermal and biogas is a particularity to spotlight. Additionally, the PV cycling lane is another
innovative strategy within the PED project context. Moreover, another important remark is
that the PEDs in Groningen estimate the ‘positiveness’ regarding the energy exported outside
the districts.
3.6. Kaukovainio, Oulu, Finland
The measures to be applied are to connect the five buildings of the district, four residential
and one shopping mall, to the district heating. Moreover, to add a high performant heat pump
in the shopping mall whereby the heat sources are exhaust air, excess heat from refrigeration,
district heating return water and uncovered solar collectors.
Furthermore, more measures to be applied are to retrofit the residential buildings. From this
perspective PV panels have already been installed on the roofs and on exterior walls of an
apartment building. Similarly, geothermal energy aims to be used for seasonal storage to
support the district heating system and for winter the energy would be stored in thermal
energy tanks. Moreover, soil aim to be used as thermal storage where the incoming fresh air
is preheated using the soil under the building as thermal storage with the objective of saving
energy. Furthermore, tube-type heat exchanger from the wastewater to the incoming cold
water as heat recover aim to save heating energy of hot tap water. Additionally, EVs charging
stations aim to be implemented. By implementing the measures 50 % reduction in total energy
consumption has been estimated by [19].
The annual positive energy balance is planned to be reached due to the surplus on the energy
production of high-performance heat pumps. Oulu PED will export 1020 MWhth/y of thermal
energy through the district heating and will import 518 Mwhe/y of electricity, for a total
balance in primary units (PE) of 80 MWhp/y exported to outside the district, as a leans to
have a positive annual energy balance [18]. In short, similarly to Groningen, in Oulu
technologies such as district heating, geothermal energy, heat pumps, PV and Evs are being
implemented.
The Phases of Making City PED projects (Groningen and Oulu) [20].
1. City Needs Diagnosis energy and land use planning. City needs and priorities are
analyzed regarding the city level indicators. Moreover, Energy Demand modelling is
part of the identification of main needs and priorities.
2. Resource Availability and Identification of PED Concept Boundary. Natural resources
to be deployed as RE plus preliminary PED studies.
3. Linking to Solution. The technologies tested in Oulu & Groningen are assessed in this
stage.
4. Barriers / Enablers of PED Solutions. Ideas to overcome the barriers are given to build
a feedback loop mechanism though dialogue between technical designers, citizens and
local authorities.
5. Detailing solutions in Solution Cards. To describe the solution together with the
economic aspects and the timing to apply the solution, as well as the expected impacts
[20].
288Environmental and Climate Technologies
____________________________________________________________________________ 2021 / 25
4. PED PROJECTS COMPARISON
The information of the projects described in Section 3 is gathered, simplified and compared
in the present section. Similitudes and discrepancies within the selected PED projects aim to
be found through comparative tables. In Table 3 aspects such as the project surface, the land
use, the tools to be utilized to evaluate the energy performance and the KPI of the selected
projects are compared.
TABLE 3. DATA COMPARISON OF SELECTED PED PROJECTS
City, Cork, Ireland Guyancourt, Limerick, Trondheim, Groningen, Oulu,
country France Ireland Norway Netherlands Finland
District CIT Challenger Georgian Sluppen Groningen Kaukovainio
Bishopstown campus district Brattøra North and
campus South
Project COOPERaTE +CityxChange Making City
Status In operation Implementation process 2018–2023
Project area n/a 67 000 m2 15 000 m2 n/a 45 000 m2 40 000 m2
Land use University Offices Office 68 % Residential Residential Residential:
campus Parking Residential 27 % Office and public 3 hectares
Student 12 % 19 % buildings, 75 %
accommodation Social Commercial high-rises, Other:
Sport center housing 5.5 % industrial Commercial
10 % Shopping and tertiary 1 hectare
Commercial 13 % Hotel buildings 25 %
10 % 7 % Other
28 %
Tools for NICORE, Intel Optimization Digital twin n/a Open source
energy system, NIM engine by IESVE, code
evaluation for day-ahead Forecasting Intelligent platforms.
forecasts in tool Community Python,
energy Demand Information machine
consumption response Model learning
Optimization (iCIM)) tools, non-
Embix
engine [14], module for [16]. Vendor lock
[15]. approach.
energy
storage [14],
[15].
Key Energy: RES share increase, RES Building and energy:
Performance Total energy consumption storage Increase in e. storage Reduction in annual final
Indicators (kWh/day) (MWh), RES efficiency energy consumption, RE
(KPI) (kWh/m2/y)), RES integration production, Annual CO2
Local energy generation
(kWh/day) (GWh el/th of new RES emission reduction, Peak load
integration), RES flexibility reduction, Balance in PE
Max. power demand (kW) Peak load reduction(%) , (Primary Energy) (MWhp/y
Max. power grid power demand Greenhouse gas emissions exported)
(kW) (Tonnes CO2eq/y), Optimized
ICT: Availability of real time
Environment: self-consumption (District data Improved interoperability
Energy savings (%, kWh) level production/total energy between systems, # of smart
consumption), Reduction in
CO2 emission reduction (%, kg apps developed using open
energy grid investment data platforms
CO2)
compared to planned
Share of local and renewable investments, Increased uptake E-mobility:
energy generation (%)
289Environmental and Climate Technologies
____________________________________________________________________________ 2021 / 25
Economics: of EVs (%), Decrease in # of public EV charging
Energy and cost of energy sold payback period and ROI [3]. stations, RE use, CO2
to grid (MWh) emission y reduction, kWh
Energy cost savings (%, €) [14], recharged in the EV charging
[15]. stations [19].
Table 3 shows how the assessed district areas go from 15 000 m2 to 67 000 m2 surface. The
main land uses are university campuses, offices and residential areas. Concerning the tools
for energy evaluation, optimization engines, 3D modelling tools and programming platforms
are used in the selected PED projects. On the other hand, for the KPIs Energy consumption/
generation, RES deployment, Greenhouse gas emissions, mobility and economic indicators
are evaluated within the selected projects.
Conversely, since the central idea of a PED is to have a positive energy balance, Table 4
compares the energy consumption, energy generation and total energy balance in each one of
the assessed projects.
TABLE 4. SELECTED PED PROJECTS ENERGY DATA COMPARISON
City, country Cork, Guyancourt, Limerick, Trondheim Netherlands, Oulu,
Ireland France Ireland , Norway Groningen Finland
District CIT Challenger Georgian Sluppen Groningen Kaukovainio
Bishopstown campus district Brattøra North and
campus South
Project COOPERaTE +CityxChange Making City
Energy 5884 11.8 1.79 GWh/y n/a n/a n/a
Consumption kWh/day GWh/y (Block 1)
(GWh) Estimated to
be reduced to
0.6 GWh/y
Energy 0.000927 el 2.53 1.00 n/a 0.07 electric 1.02 th
Generation 0.001403 th 0.25 thermal
(GWh/y)
Total balance n/a n/a +0.40 n/a North district +0.08 PE
consumption/g +0.17 PE
eneration South district
(GWh/yr) +0.097 PE
Reference [14], [15] [14], [15] [16] – [18] [18]
Table 4 shows the expected surplus of energy, however, the measurements for Groningen
and Oulu was performed in (GWh/y) of primary energy therefore a units assurance would be
needed in order to compare. In addition, it is important to remark that the energy balances are
only an estimation since the projects are still in implementation process.
In contrast, Table 5 summarizes the measures that aim to be implemented in the assessed
PED projects. They are categorized in 3 sections: The technologies that aim to improve the
energy efficiency of the buildings, the RESs planned to be deployed and the Energy Storage
systems.
From this perspective, regarding the improvement in the energy efficiency of buildings the
measure applied in the majority of the PED projects is an enhanced envelope/ insulation
followed by real-time measuring of consumption and heating controls reduction of the DHW
supply temperature with heat recovery, as shown in Table 5. From this first point, energy
management system (Neighborhood / Building) and boiler upgrades were also utilized by half
of the projects.
290Environmental and Climate Technologies
____________________________________________________________________________ 2021 / 25
On the other hand, regarding the RESs the technologies most utilized are Heat Pumps and
PV. Finally, concerning the Energy storage solutions, EV, V2G (Vehicle to Grid) and V2B
(Vehicle to Building) concepts including smart charging stations implementation are the
major solution in the projects followed by batteries and thermal storage as shown in Table 5.
TABLE 5. MEASURES TO BE IMPLEMENTED WITHIN THE EVALUATED PED PROJECTS
Implemented CIT Challenger Georgian Sluppen North and Kaukova
measure or Bishopstown campus, district, Brattøra South inio,
technology campus, Guyancourt, Limerick, Trondheim, districts, Oulu,
Cork, France Ireland Norway Groningen, Finland
Ireland Netherlands
PED project COOPERaTE +CityxChange Making City
Improvement in energy efficiency of buildings
Demand response x x
Energy x x x
management
system
(Neighborhood /
Building)
Heating controls x x x x
Reduction of the
DHW supply
temp, heat
recovery
Smart thermostats x x
per room
Real-time x x x x
measuring of
consumption
Heat distribution x x
between the
buildings on site
Enhanced x x x x x
envelope/
insulation
Boiler upgrades x x x
Renewable Energy Sources (RES)
CHP (Combined x x
Heat and Power)
Photovoltaic (PV) x x x x x
Solar thermal x
Heat Pumps (HP) x x x x x
Tidal turbine x
Waste digestion x x
Geothermal x x
Waste heat x x
District Heating x x x
291Environmental and Climate Technologies
____________________________________________________________________________ 2021 / 25
Energy Storage technologies
Batteries x x x
Thermal storage x x x
Water tank. Phase
Change Material
(PCM).
Optimization x x
service for storage
management
EV, V2G, V2B x x x x
(Electric
Vehicle,Vehicle to
Grid, Vehicle to
Building)
5. CONCLUSIONS
PEDs could be defined as an area that has an annual positive energy balance. Nevertheless,
none of the PED projects assessed in this paper produce more energy than the energy they
consume since most of them are still in implementation process. Therefore, the first
conclusion of this paper is that there are no PEDs materialized in existing neighborhoods at
the moment.
Subsequently, in this study, the selected PED projects were analyzed in order to learn from
them and use them as a base in future PEDs. From this perspective, the findings of each
project are summarized in the following paragraphs.
CIT Bishopstown campus, Cork, Ireland case-study assess each building individually. On
the other hand, to implement an optimization system service has proved to have as a result
the reduction of energy costs. Diversely, the KPIs to assess the energy, environment and
economic performance of the districts chosen by this PED project seem to be profitable for
further projects. Moreover, to perform measurements of the indicators in an annual way is
important to stick to the PED definition. Similar beneficial points were extracted from the
COOPERaTE project in Challenger campus, Guyancourt, France.
The remarkable points found in the Georgian district, Limerick, Ireland case-study are the
stages (improvement of operational efficiency of the building, shallow retrofit measures and
deep renovation measures) whereby approximately 65 % of energy savings could be reached.
Additionally, regarding energy generation, a tidal turbine aims to be implemented to reach a
positive energy balance, consequently, it would be the main technology to be learned from.
Finally, concerning this case-study as a part of +CityxChange project the KPI might be
convenient to be used as a base in future PED projects.
About Groningen, the Netherlands PED project, the highlights are on the diversified RES
that feeds the district heating system. Additionally, the PV cycling lane is an innovative
strategy within the PED project context. Moreover, Kaukovainio, Oulu, Finland, as well as
Groningen in the Netherlands, estimate the balance in primary energy units exported outside
the district.
Section 4 condenses and contrasts the most relevant aspects found within the assessed PEDs
for the development of further PED projects. The project surface, the land use, the tools to be
utilized to evaluate the energy performance and the KPI of the selected projects are firstly
compared. Concerning the tools for energy evaluation; optimization engines, 3D modelling
292Environmental and Climate Technologies
____________________________________________________________________________ 2021 / 25
tools and programming platforms are used in the selected PED projects. On the other hand,
for the KPIs evaluated are mainly Energy consumption/ generation, RES deployment,
Greenhouse gas emissions, mobility and economic indicators.
Finally, a summary of the measures that aim to be implemented in the assessed PED projects
is categorized in 3 sections: The technologies that aim to improve the energy efficiency of
the buildings, the RESs planned to be deployed and the Energy Storage systems. Whereby,
the measures applied in the majority of the PED projects are an enhanced envelope/ insulation,
the implementation of Heat Pumps, PV energy and EV as shown in Table 5. Also, the
preexistence of a District Heating system as well as the Smart grids concept where the
possibility to sell energy to the grid and bidirectionality are relevant for the future PEDs.
ACKNOWLEDGEMENT
The authors thank the Department of Architecture and the Vicerrectorate for Research of the University of the Basque
County UPV/EHU for the financial support given for this research.
REFERENCES
[1] Oregi X., Hermoso N., Prieto I., Izkara J. L., Mabe L., Sismanidis P. Automatised and georeferenced energy
assessment of an Antwerp district based on cadastral data. Energy and Buildings 2018:173:176–
94. https://doi.org/10.1016/j.enbuild.2018.05.018
[2] Directive (EU) 2018/844, 2018. European Parliament and of the Council of 30 May 2018 amending Directive
2010/31/EU on the energy performance of buildings and Directive 2012/27/EU on energy efficiency. Official Journal
of European Union 2018 L 156/75.
[3] +CityxChange, Co-creating Positive Energy Districts, with Integrated Planning and Design, a Common Energy Market
& CommunityxChange, +Limerick, Limerick City and Country Council. [Online]. [Accessed 20.01.2021]. Available
https://www.limerick.ie/sites/default/files/media/documents/2019-09/Positive_CityxChange_Limerick_Brochure.pdf
[4] Häkkinen T., Ala-Juusela M., Mäkeläinen T., Jung N., Drivers and benefits for district-scale energy refurbishment.
Cities 2019:94:80–95. https://doi.org/10.1016/j.cities.2019.05.019
[5] Sharifi A., Dawodu A., Cheshmehzangi A. Neighborhood Sustainability Assessment Tools: A Review of Success
Factors. Journal of Cleaner Production 2021:293:125912. https://doi.org/10.1016/j.jclepro.2021.125912
[6] Lindholm O., Rehman H., and Reda F. Positioning Positive Energy Districts in European Cities. Buildings 2021:11(1):
19. https://doi.org/10.3390/buildings11010019
[7] European Commission. CORDIS, Smart Cities and Communities, 2018. [Online]. [Accessed: 05.10.2020] Available:
https://cordis.europa.eu/programme/id/H2020_LC-SC3-SCC-1-2018-2019-2020
[8] Ala-Juusela M., Crosbie T., Hukkalainen M. Defining and operationalizing the concept of an energy positive
neighbourhood. Energy Conversion and Management 2016:125:1:133–140.
https://doi.org/10.1016/j.enconman.2016.05.052
[9] Integrated Set+-Plan, SET-Plan Action 3.2 Implementation Plan Europe to become a global role model in integrated,
innovative solutions for the planning, deployment, and replication of Positive Energy Districts, 2018. [Online].
[Accessed: 05.10.2020] Available: https://setis.ec.europa.eu/system/files/setplan_smartcities_implementationplan.pdf
[10] Bossi, S., Gollner Ch., Theierling S. Towards 100 Positive Energy Districts in Europe: Preliminary Data Analysis of
61 European Cases. Energies 2020:13:22:6083. https://doi.org/10.3390/en13226083
[11] European commission. Horizon Europe 2020. [Online]. [Accessed 24.01.2021]. Available:
https://ec.europa.eu/info/horizon-europe_en
[12] The Joint Programming Initiative (JPI) Urban Europe and The Strategic Energy Technology (SET) Plan, Europe
towards Positive Energy Districts First update February 2020 A compilation of projects towards sustainable
urbanization and the energy transition, 2020. [Online]. [Accessed: 24.01.2021]. Available: https://jpi-
urbaneurope.eu/wp-content/uploads/2020/06/PED-Booklet-Update-Feb-2020_2.pdf
[13] Magrini A., Lentini G., Cuman S., Bodrato A., Marenco L. From nearly zero energy buildings (NZEB) to positive
energy buildings (PEB): The next challenge - The most recent European trends with some notes on the energy analysis
of a forerunner PEB example. Developments in the Built Environment 2020:3:100019.
https://doi.org/10.1016/j.dibe.2020.100019
293Environmental and Climate Technologies
____________________________________________________________________________ 2021 / 25
[14] Boudon, M., Helguen E. L., De Tommasi L., Bynum J., Kouramas K., Ridouane E.H. Chapter Seven – Real Life
Experience – Demonstration Sites. In Energy Positive Neighborhoods and Smart Energy Districts, edited by A. Monti
et al., Academic Press 2017:227–50. https://doi.org/10.1016/B978-0-12-809951-3.00007-7
[15] Boudon M., De Tommasi, L., Bynum J., Mortureux C. COOPERATE Deliverable D5.3 Report on the global energy
savings for the COOPERaTE sites 2015, [Online]. [Accessed: 17.01.2021]. Available:
https://www.researchgate.net/publication/313081835_Report_on_the_global_energy_savings_for_the_COOPERaTE
_sites
[16] Limerick City & County Council, Limerick Positive Energy Block 2020. [Online]. [Accessed 17.01.2021]. Available:
https://www.iesve.com/icl/case-studies/9468/limerick-positive-energy-block
[17] Integrated Environmental Solutions Virtual Environment. Trondheim. Creating a greener energy positive city [Online],
[Accessed 17.01.2021] Available: https://www.iesve.com/cityxchange/trondheim
[18] Vélez F., de Torre Minguela C., Sanz C. Cities transformation through Positive Energy Districts: MAKING-CITY.
[Online]. [Accessed: 17.01.2021]. Available: http://makingcity.eu/wp-
content/uploads/2020/09/CARTIF_MakingCity_ICSC-CITIES_2019.pdf
[19] Känsälä K., VTT, Positive Energy Districts Making City Project 2019. [Online], [Accessed 17.01.2021] Available
https://www.ouka.fi/documents/486338/18348977/8+H2020+Making-
City_Klaus+K%C3%A4ns%C3%A4l%C3%A4.pdf/1264cb04-dd73-4fe7-8f54-bc5aaf869dac
[20] Alpagut B. Akyürek Ö., Miguel Mitre E.; Positive Energy Districts Methodology and Its Replication
Potential. Proceedings 2019:20(1):8. https://doi.org/10.3390/proceedings2019020008
[21] Integrated Environmental Solutions Virtual Environment +CityxChange. [Online]. [Accessed 17.01.2021]. Available:
https://www.iesve.com/cityxchange
294You can also read