PRELIMINARY OBSERVATIONS IN THE AFTERMATH OF THE NOVEMBER 30, 2018 ANCHORAGE, ALASKA EARTHQUAKE - SOM
←
→
Page content transcription
If your browser does not render page correctly, please read the page content below
SK I D M O R E, OW IN GS & MERRILL LLP
O N E F RO NT ST REET
SA N F RA N CISCO, CA 9 4 111

PRELIMINARY OBSERVATIONS IN THE AFTERMATH OF THE
NOVEMBER 30, 2018 ANCHORAGE, ALASKA EARTHQUAKE
Samantha Walker, PE and Patrick Murren, SE

Keywords

earthquake
seismic
structural
engineering

Abstract

In the days following the November 30, 7.0M Anchorage earthquake, SOM engineering team Samantha Walker
and Patrick Murren deployed to Alaska on a reconnaissance effort to chronicle building performance, view
damaged buildings, and collaborate with the structural and earthquake engineering communities at large. The
team spent several days in Anchorage and south-central Alaska documenting the visible damage via exterior
building assessments, walkthroughs with building owners and tenants, and onsite observations where ground
failures occurred. This paper documents the team’s observations, describes the seismology of south-central
Alaska, and provides context for the team’s findings in relation to the Good Friday Earthquake of 1964. In
collaboration with local structural and geotechnical engineers, the information gathered is being shared with
the Earthquake Engineering Research Institute (EERI) reconnaissance teams in support of the organization’s
mission to mitigate earthquake risk around the world.

The authors previously collaborated on reconnaissance efforts (Diaz, et al.) in the wake of the 2017 Central
Mexico earthquakes. SOM has organized reconnaissance teams in the aftermath of several other major
earthquakes, including the 1985 Mexico City earthquake, the 1989 Loma Prieta earthquake, the 1994
Northridge earthquake, the 1995 Kobe earthquake, and the 2008 Sichuan earthquake. The objectives of these
trips are: to observe damage and apparent building behavior; to try to understand and explain the reasons for
observed damage; and to share the information gathered with other building professionals, researchers, and
organizations in order to improve the state of knowledge on building performance in earthquakes so that cities
can be made more resilient in the face of these natural disasters.

1.0 Introduction

In order to evaluate the performance of structures during the Anchorage earthquake of November, 2018, it is
instructive to compare it against observations from the Good Friday Earthquake of 1964. A brief description of
the geography, building stock, and soil characteristics of Anchorage is also instructive in providing context for
the team’s observations.

1.1 Context From 1964 Alaska Earthquake

To understand the performance of structures in the November 2018 Anchorage earthquake, it is instructive
to revisit observations from the 1964 Good Friday Earthquake, a 9.2M event that still registers as the
second largest recorded ground motion (trailing only the 9.5M Chile earthquake of 1960). The southern
coast of Alaska roughly parallels the tectonic boundary between the Pacific and North American Plates. The
Pacific Plate moves northward and, for most of this boundary, is subducted by the North American Plate
on which Alaska sits. The tectonic stress build-up in Alaska is compounded by a form of torsional shear
along the southeast coast of the state where the tectonic boundary is oriented as a strike-slip, rather than

© SKIDMORE, OWINGS & MERRILL LLP 2019                                                                     PG 1/23
subduction interface (Alaska Earthquake Center). While Alaska is subjected to frequent earthquakes along
both boundaries, the 1964 earthquake was a subduction event that occurred at a depth of 15 miles with an
epicenter in the Prince William Sound, approximately 75 miles east of Anchorage (Brocher, USGSa).

One of the defining characteristics of the 1964 earthquake was the substantial uplift experienced along
stretches of the Alaska coast and subsequent subsidence experienced inland over a range of hundreds of
miles. Land between the epicenter and the plate boundary offshore was uplifted on the order of several feet,
including several areas where previously submerged portions of the seafloor were left exposed. This uplift also
caused a large tsunami that resulted in heavy damage to coastal communities and deaths along the Alaska
shoreline and as far away as northern California (Brocher, USGSa). It is noteworthy, however, that a tsunami
did not occur in Anchorage either in 1964 or in 2018, as the city is sheltered in a low-tsunami risk area of the
southern coast (Municipality of Anchorage).

Fig. 1: Map of Alaskan plate tectonics showing the epicenter of the 1964 earthquake and regions of ground uplift or subsidence (Map Credit: USGS)

There were very few ground motion recording stations in Alaska in 1964, but it is generally established that
shaking in Anchorage lasted for a duration of over four minutes. Substantial structural damage occurred
in Anchorage, including the notable collapses of the control tower at the Anchorage airport, a department
store, and mid-rise apartment buildings in the downtown area. However, the effects of the earthquake in
Anchorage were perhaps most notably manifested in myriad dramatic ground failures, including landslides,
settlement and resulting grabens, and lateral spreading. Ground failures along 4th Street and L Street in the
heart of downtown resulted in approximately 10 feet of settlement and heavily damaged all structures in the
immediate vicinity. Most dramatically, the entire Turnagain Heights neighborhood, situated on coastal bluffs in
the western portion of the city, was destroyed by a cascading series of landslides (USGSa). Today, this area is
home to a coastal trail and greenspace fittingly named Earthquake Park.

© SKIDMORE, OWINGS & MERRILL LLP 2019                                                                                                   PG 2/23
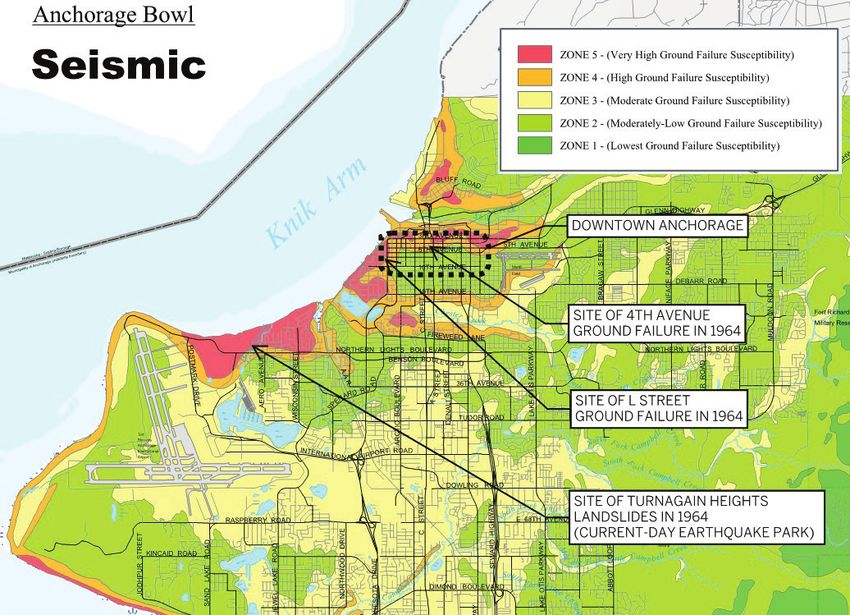
Fig. 2: Ground settlement and resulting graben along 4th Street,        Fig. 3: Landslide near L Street in downtown Anchorage with collapsed
downtown Anchorage (Photo Credit: US Army via USGSa)                    mid-rise building in the background (Photo Credit: USGSa)

Fig. 4: A cascading series of landslides along the coast at Turnagain
Heights in west Anchorage. Today, this area is a greenspace with no
housing. It is fittingly named Earthquake Park.
(Photo Credit: USGSa)

1.2 Geography, Building Stock, & Soil Characteristics of Anchorage

A brief description of the geography, building stock, and soil characteristics of Anchorage is also instructive
in providing context for the team’s observations. Anchorage is Alaska’s largest city with over 400,000
residents in the metropolitan area. The city is located on the southeast shore of the end of the Knik Arm, part
of the Cook Inlet of the Gulf of Alaska. The city is bounded by the Cook Inlet (west) and its Knik (north) and
Turnagain Arms (south), with the Chugach Mountains nearby to the east. The downtown area is situated in
the northern part of the city along the Knik Arm and a smaller body of water, Ship Creek. The downtown area
has a variegated building stock ranging from 1-2 story wood frame, masonry, and concrete structures to steel
and concrete mid-rise buildings and several high-rises over 200 feet tall. The city is generally oriented in a
north-south direction, with construction becoming more low-rise residential and commercial moving south
toward Turnagain Arm, though there are high-rise and mid-rise structures located in midtown Anchorage. From
observations on the ground, examination of building plans, and discussions with local engineers, it was evident
that a variety of structural systems are implemented in mid-rise and high-rise construction, including steel
moment frames, steel concentric braced frames, and reinforced concrete shear walls.

The typical soil profile in downtown Anchorage comprises two primary layers: a layer of gravel approximately
50 feet thick underlain by a thicker clay layer known as the Bootlegger Cove clay that is particularly

© SKIDMORE, OWINGS & MERRILL LLP 2019                                                                                              PG 3/23
susceptible to failure during seismic shaking. The USGS investigation of the 1964 earthquake (Grantz, et al.)
and geotechnical investigations undertaken by the Municipality of Anchorage (GIS Services) have diagrammed
two typical manners in which soil failures can occur in the city (Figures 5 and 6). In one scenario, failures occur
vertically through the soil column and earthquake motion forces the column monolithically toward the coast.
When this rigid body motion occurs, a relatively small portion of the column breaks off and settles into the void
left by the ground movement, resulting in grabens (similar to the failures seen at 4th and L Streets in 1964).
In a second scenario, multiple planes of slope failure develop in the weaker Bootlegger Cove layer, resulting in
landslides toward the coast.

Fig. 5: Soil failure scenario #1 - Soil column translation toward the   Fig. 6: Soil failure scenario #2 - Slope failures through Bootlegger
coast and graben formation (Image Credit: Grantz, USGS Circular         Clay layer resulting in landslides (Image Credit: Grantz, USGS
491)                                                                    Circular 491)

These hazards (Figure 7) have been mapped and made publicly available by the Municipality of Anchorage
authorities. In the map, it can be seen that some of the most notable ground failures in the 1964 earthquake
occurred near the shoreline in areas assessed with either “High” or “Very High” susceptibility to ground failure,
including the large stretch of vulnerable land underlying the Turnagain Heights (now Earthquake Park) area.

                                                                                                              Fig. 7: Mapping of geotechnical
                                                                                                              hazard risk in Anchorage
                                                                                                              (Image Credit: Municipality of
                                                                                                              Anchorage)

© SKIDMORE, OWINGS & MERRILL LLP 2019                                                                                                  PG 4/23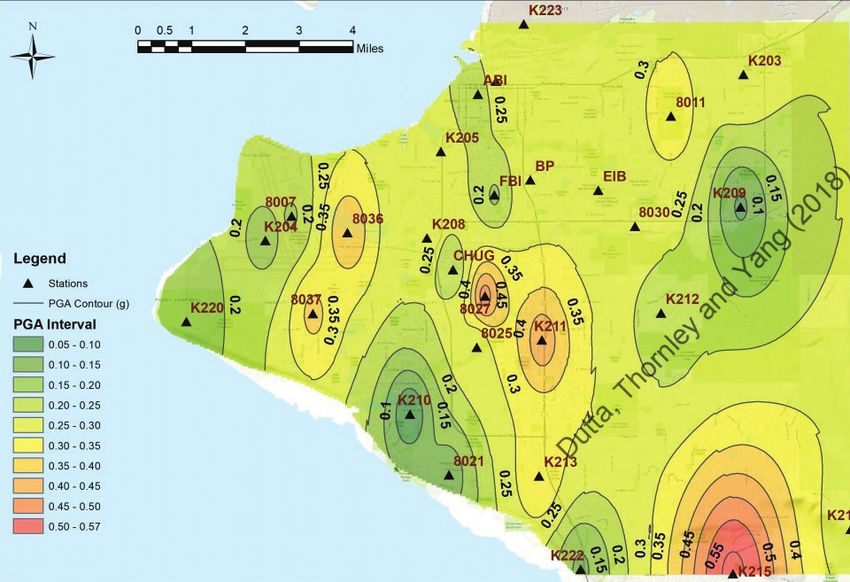
2.0 Seismology of the 2018 Earthquake

The 7.0M November 30, 2018, Anchorage earthquake occurred at 8:29 AM local AKST at a depth of 29 miles.
The epicenter of the earthquake was less than 10 miles from downtown Anchorage in a sparsely populated
region on the western shore of the Knik Arm, at approximately the same latitude as the suburban community
of Eagle River. Strong shaking typically lasted between 30 and 60 seconds across the Anchorage metropolitan
area. Several aftershocks occurred in the days following the main earthquake, the largest being a 5.7M event in
the evening of November 30 (USGSb).

Due to the dearth of ground motion recording stations in Alaska in 1964, it is difficult to draw comparisons
with the ground accelerations experienced in the Good Friday Earthquake. One result of the 1964 earthquake
was the introduction of a broad array of recording stations across Alaska and even—as described below—the
instrumentation of a handful of buildings in Anchorage. The image below maps the recorded peak ground
accelerations (PGAs) at stations throughout Anchorage with values ranging from 0.27g downtown to a
maximum of 0.47g recorded at a midtown Anchorage station. A contour map of the PGAs provided below
(Dutta, et al.) similarly indicates PGAs in the 0.2g - 0.5g range typically.

                                                                                    Fig. 8: Recorded peak ground
                                                                                    accelerations at Center for
                                                                                    Engineering Strong Motion Data
                                                                                    (CESMD) stations in Anchorage
                                                                                    (units %g) (Image Credit:
                                                                                    graphic on Google Map)

© SKIDMORE, OWINGS & MERRILL LLP 2019                                                                     PG 5/23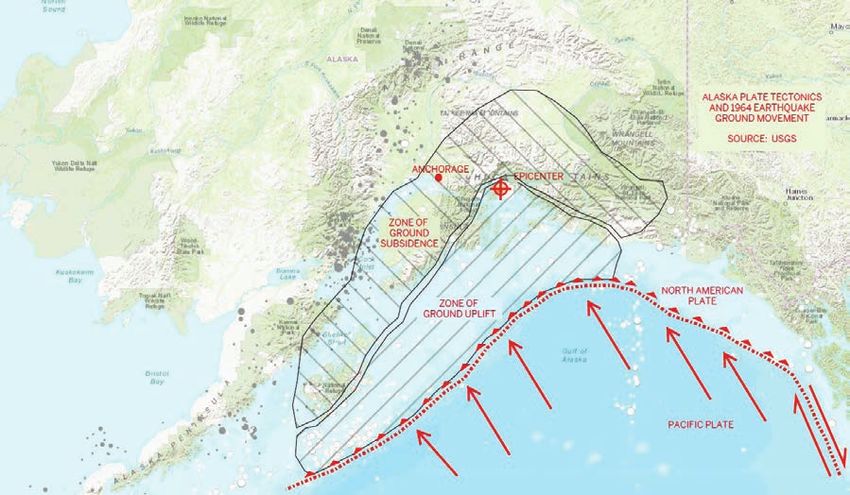
Fig. 9: Peak ground acceleration
                                                                                      (PGA) contour map of
                                                                                      Anchorage (Dutta, et al.)

For reference, the ASCE 7-16 design response spectrum for a hypothetical soil site class D structure
in downtown Anchorage—which per earlier studies (Martirosyan, et al.) appears to conform to typical
subgrade conditions across the downtown area—is provided below and compared against contour maps of
the 0.2-second period and 1.0-second period spectral accelerations. Noting the design-based earthquake
spectral acceleration values of 1.00g (0.2-s period) and 0.77g (1.0-s period), it can be seen that for the most
part, recorded ground motions did not exceed the DBE spectral accelerations for those particular periods.
On the 0.2-second short period response map, two spikes in excess of the DBE values were noted—one
near Lake Spenard at the airport and one near Rabbit Creek in the southern part of the city. From these
maps, the majority of structures at the 0.2-s and 1.0-s fundamental periods were not subjected to design-
level accelerations. The contour maps and relative differences between the DBE and recorded spectral
accelerations also indicate a greater concentration of the earthquake’s energy at lower periods. The spectral
accelerations recorded at instrumented high-rise buildings, shown in subsequent sections, and lack of
observable cosmetic damage in those buildings further indicate that longer period structures were typically
not subjected to design accelerations.

                                                                                      Fig. 10: ASCE 7-16 Design and
                                                                                      MCE response spectra for
                                                                                      a hypothetical structure in
                                                                                      downtown Anchorage (soil site
                                                                                      class D)

© SKIDMORE, OWINGS & MERRILL LLP 2019                                                                         PG 6/23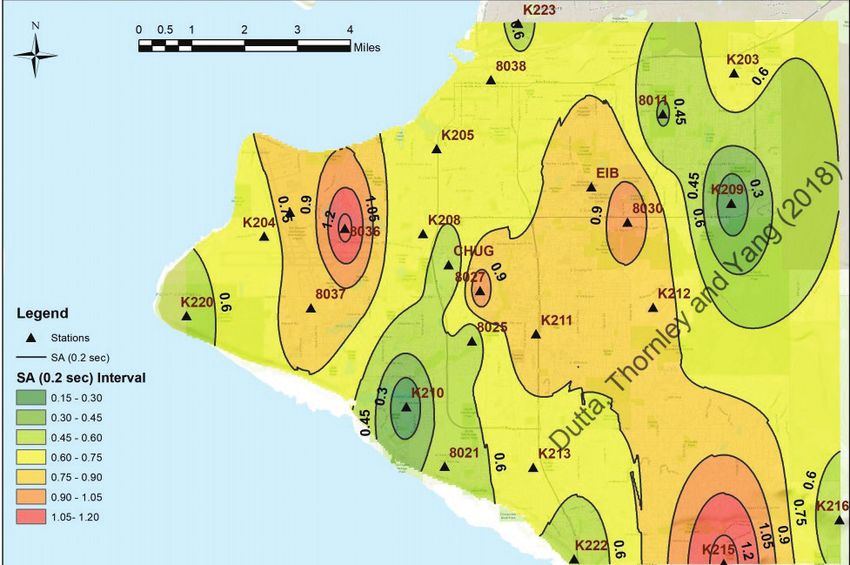
Fig. 11: 0.2-second period
                                        spectral acceleration contour
                                        map of Anchorage (Dutta, et al.)

                                        Fig. 12: 1-second period spectral
                                        acceleration contour map of
                                        Anchorage (Dutta, et al.)

© SKIDMORE, OWINGS & MERRILL LLP 2019                            PG 7/23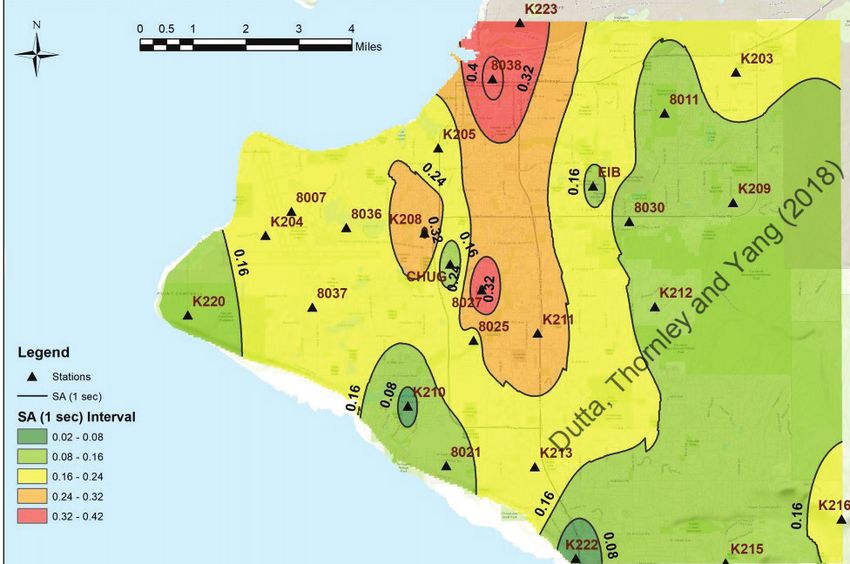
3.0 Reconnaissance Observations
Beginning approximately 24 hours after the earthquake, the authors performed a four-day reconnaissance of
the area to document earthquake-related building and infrastructure damage and, where possible, to assist
local authorities in their efforts to evaluate damaged buildings.
The reconnaissance focused on the most affected areas near the epicenter, including Anchorage and Eagle
River. The locations visited by the SOM team are indicated in the map shown in Figure 13 below.
Fig. 13: Data Map showing
reconnaissance locations from
the 2018 Alaska earthquake. The
epicenter is marked by a red star
and the locations visited by the
SOM reconnaissance team are
highlighted in blue (EERI)
SOM shared its findings and coordinated its efforts with EERI, local reconnaissance teams on the ground
in Alaska, and other researchers and professionals by participating in the nightly Clearinghouse Briefings
organized by EERI. SOM also shared its findings by uploading photos and observations to the EERI Data Map,
which is publicly available online.
The reconnaissance observations are summarized in the following sections. This article reflects a selection of
representative cases from the SOM reconnaissance and does not purport to draw overall conclusions beyond
the noted observations.
3.1 Anchorage
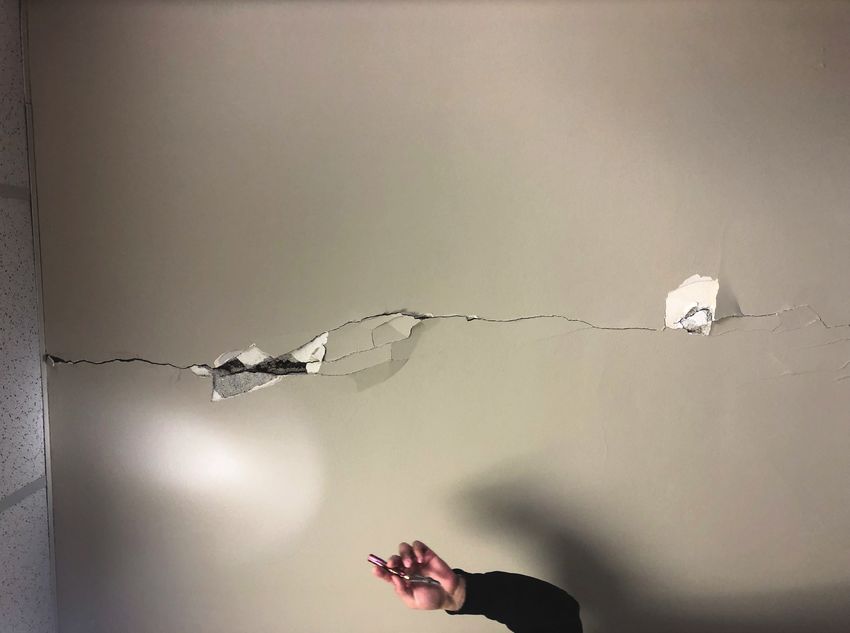
Throughout Anchorage, good structural performance was generally observed, with limited instances of
nonstructural damage. Across building heights, building materials, and building usage, observed damage
was generally limited to some cracked facades and windows, spalled stucco, fallen ceiling tiles, and toppled
unbraced items or shelf contents. Figure 14 below shows cracked windows in some of the buildings in
downtown Anchorage, which had already been boarded up the day after the earthquake.
© SKIDMORE, OWINGS & MERRILL LLP 2019 PG 8/23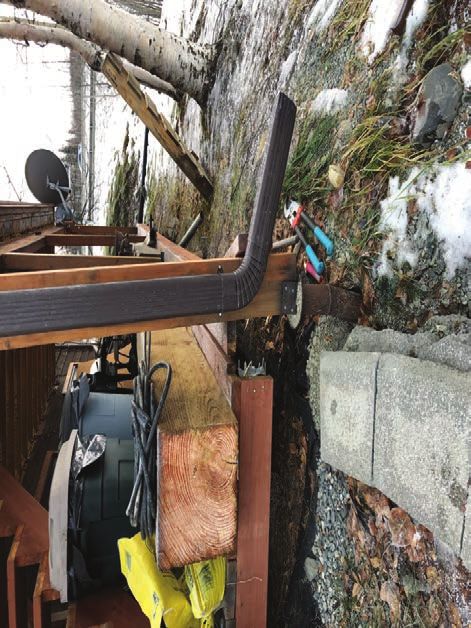
Fig. 14: Cracked windows observed in buildings in downtown Anchorage

There are a number of high-rise structures in Anchorage in the 15- to 25-story range. Most appeared to
have withstood the earthquake with little to no evident damage. In addition to the broad array of ground
motion recording stations in the area, there are also several instrumented buildings in Anchorage, including
the Robert B. Atwood Building, the Frontier Building, the Hilton Anchorage East Tower, the BP Exploration
Building, and the Alaska VA Healthcare System. These instrumented structures were an area of focus for the
reconnaissance team.

The authors observed the exterior of the 20-story Atwood Building and noted little to no damage apparent
from the exterior. Per reports from EERI peers, nonstructural damage was observed in some of the upper
floors, mostly fallen acoustic ceiling tiles and rails as well as limited flooding from water pipe failure (Archbold,
et al.). The authors also learned that the building’s structure is composed of a steel moment frame and shear
wall plate lateral system. The records for the Atwood Building were obtained from the Center for Engineering
Strong Motion Data (CESMD) website. The recorded site response spectra at the ground level of the Atwood
Building are shown in Figure 15 below, compared to the ASCE 7-16 Design and MCE response spectra for site
class D. The recorded spectra fall below the ASCE 7-16 Design response spectra. The recorded horizontal
acceleration histories for two sensors at the ground and roof levels are shown in Figure 16 below. The peak
acceleration was approximately 0.24g at ground level and increased to 0.44g at the roof level, with some of the
middle stories exhibiting higher accelerations than some of the upper stories. The vertical acceleration history
recorded by sensor 6 at basement level is shown in Figure 17 below. The peak vertical acceleration recorded at
that location was 0.18g. A maximum displacement of 12.1 inches was recorded at the roof level. The maximum
recorded story drift ratio at the roof was 0.004, which is significantly less than the allowable story drift ratio of
0.02 for buildings of this type per ASCE 7-16 and the operational performance drift ratio limit of 0.01 for light
partitions per ASCE 41-13. The maximum recorded story drift ratio at the roof corresponds to a drift of 0.8 in,
which is greater than the minimum drift limit of 0.5 in for glass fallout per ASCE 41-13.

© SKIDMORE, OWINGS & MERRILL LLP 2019                                                                        PG 9/23
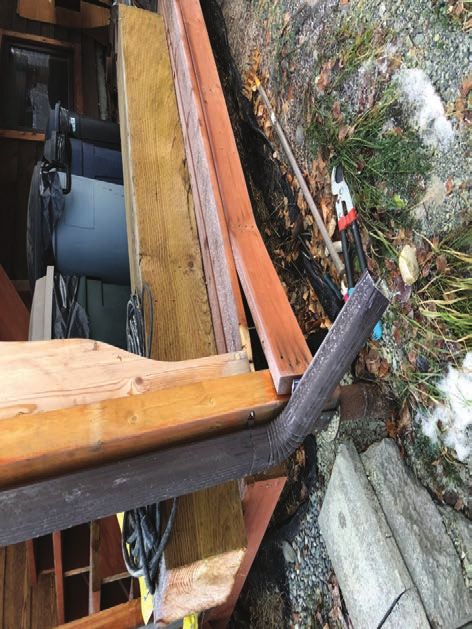
Fig. 15: Recorded site response
                                        spectra (5% damping) at the
                                        Atwood Building ground level
                                        compared to the ASCE 7-16
                                        Design and MCE response
                                        spectra (site class D)

                                        Fig. 16: Recorded horizontal
                                        acceleration history at ground
                                        level, sensor 07, (top left) and
                                        roof level, sensor 32, (bottom
                                        left) of the Atwood Building

© SKIDMORE, OWINGS & MERRILL LLP 2019                           PG 10/23
Fig. 17: Recorded vertical
acceleration history at basement
level, sensor 06, of the Atwood
Building
The authors observed the 14-story Frontier Building from both the exterior and several interior floors. During
the visit, the authors learned that the building’s structural system is composed of reinforced concrete core
walls and post-tensioned flat floor slabs. Minor non-structural damage was observed, including cosmetic
cracks between the partitions and columns as well as fallen sprinkler head covers. Figure 18 shows an example
of typical cosmetic damage that was observed inside the Frontier Building. The records for the Frontier
Building were obtained from the CESMD website. The recorded site response spectra at the ground level of
the Frontier Building are shown in Figure 19 below, compared to the ASCE 7-16 Design and MCE response
spectra for site class D. The recorded spectra fall below the ASCE 7-16 Design response spectra. The recorded
horizontal acceleration histories for two sensors at the ground and roof levels are shown in Figure 20 below.
The peak acceleration was approximately 0.20g at ground level and increased to 0.22g at the roof level. The
vertical acceleration history recorded by sensor 6 at basement level is shown in Figure 21 below. The peak
vertical acceleration recorded at that location was 0.11g. A maximum displacement of 9.4 inches was recorded
at the roof level. The maximum recorded story drift ratio at the roof was 0.003, which is significantly less than
the allowable story drift ratio of 0.02 for buidings of this type per ASCE 7-16 and the operational performance
drift ratio limit of 0.01 for light partitions per ASCE 41-13. The maximum recorded story drift ratio at the roof
corresponds to a drift of under 0.5 in, which is the minimum drift limit for glass fallout per ASCE 41-13.
© SKIDMORE, OWINGS & MERRILL LLP 2019 PG 11/23Fig. 18: Cosmetic cracks
between columns and partitions
observed at the Frontier Building
Fig. 19: Recorded site response
spectra (5% damping) at the
Frontier Building ground level
compared to the ASCE 7-16
Design and MCE response
spectra (site class D)
© SKIDMORE, OWINGS & MERRILL LLP 2019 PG 12/23Fig. 20: Recorded horizontal
acceleration history at ground
level, sensor 05, (top) and roof
level, sensor 33, (bottom) of the
Frontier Building
© SKIDMORE, OWINGS & MERRILL LLP 2019 PG 13/23Fig. 21: Recorded vertical
acceleration history at basement
level, sensor 06, of the Frontier
Building
The authors observed the exterior and interior of two other mid-rise buildings in downtown Anchorage.
Through examination of the structural drawings, one of the buildings appears to be composed of a composite
steel moment frame and reinforced concrete core lateral system, and the other a steel moment frame lateral
system. From the exterior, potential flexural cracks were observed at the perimeter encased columns (see
Figure 22). From the street level, the cracks did not appear to extend into the concrete encasement. On the
interior, nonstructural damage in the form of dislodged ceiling panels was observed (see Figure 23). Per ASCE
41-13, to achieve position retention or operational performance levels in a seismic event, such integrated
ceilings systems shall be retrofitted to meet the requirements of ASCE 7-16. One of the buildings also exhibited
a vertical crack in the sheet rock over the height of the building at the joint where the core wall return stopped
and transitioned to partition framing (see Figure 24).
Fig. 22: Potential flexural cracks
at the perimeter columns in a
mid-rise building in downtown
Anchorage
© SKIDMORE, OWINGS & MERRILL LLP 2019 PG 14/23Fig. 23: Typical nonstructural
damage in a mid-rise building
in downtown Anchorage (left:
upper story, right: above ground
parking garage)
Fig. 24: Vertical crack between
core wall and partition inside
building in downtown Anchorage
© SKIDMORE, OWINGS & MERRILL LLP 2019 PG 15/233.2 Eagle River The authors visited Eagle River, which had suffered more building damage than Anchorage per reports from EERI peers. Multiple shear cracks in the brittle exterior finish of a commercial building were observed, but did not appear to extend into the structure beneath (see Figure 25). Fig. 25: Shear cracks in brittle exterior finish of a commercial building in Eagle River The authors observed multiple types of nonstructural damage at the Eagle River Public Library, including brick veneer failure, shattered windows, and collapse of ceiling panels and rails (see Figures 26 and 27). The brick veneer failure was more significant on one side of the building, potentially indicative of a torsional issue. Many of the books had also fallen off the library shelves and workers wearing hard hats were partaking in the laborious task of replacing them (see Figure 28). Speaking with local tenants, the authors learned that the building adjacent to the library suffered major water damage from burst pipes, which flooded the building in the time it took to turn off the building’s water supply. © SKIDMORE, OWINGS & MERRILL LLP 2019 PG 16/23
Fig. 26: Brick veneer failure at multiple locations at the Eagle River Public Library

Fig. 27: Shattered glass (left) and collapsed ceiling panels and rails (right) at the Eagle River Public Library

© SKIDMORE, OWINGS & MERRILL LLP 2019                                                                              PG 17/23
Fig. 28: Hard hat-wearing
workers replacing fallen books
on the shelves at the Eagle River
Public Library
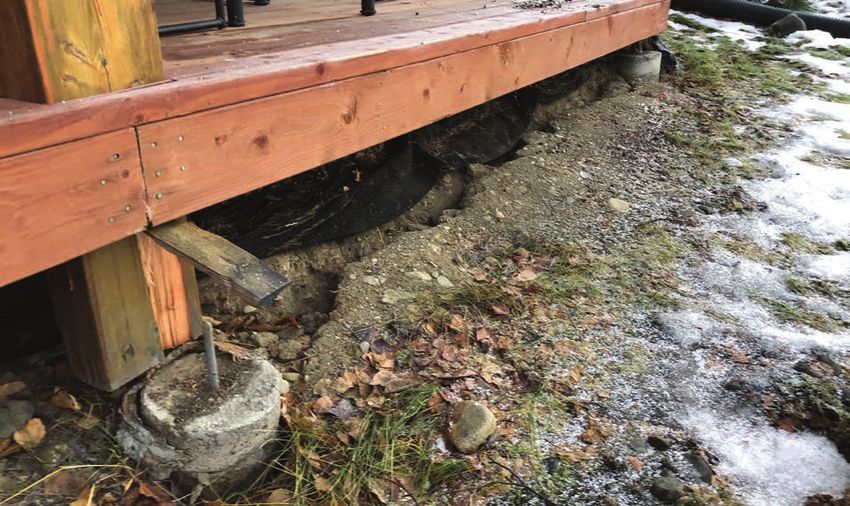
The authors observed significant fissures in the driveway and backyard of a private residence by Eagle River
(see Figures 29 and 30). The fissure in the backyard continued across the house, cracking the slab-on-grade.
At the largest opening, the fissure measured approximately one foot wide with a depth of several feet (see
Figure 31). According to the homeowners, the house was constructed on fill. The earthquake caused the fill
to settle towards the river, resulting in an elevation drop of several inches at some locations and foundation
breakout from the porch posts (see Figures 32 and 33). At one corner of the porch, a steel pipe supporting
a wood post buckled, which led to failure of the joist-to-post connection on one side and weak axis bending
failure of the joist on the other side (see Figure 34). A shear crack in the front entrance slab-on-grade caused
the entryway to drop several inches (see Figure 35). During the earthquake, the residents recounted that they
felt their entire house undergo a vertical drop.
Fig. 29: Fissure in the driveway
of a private residence by Eagle
River (left)
Fig. 30: Fissure running through
the house (right)
© SKIDMORE, OWINGS & MERRILL LLP 2019 PG 18/23Fig. 31: Largest opening of fissure (bigger gauge required) Fig. 32: Elevation change at fissure Fig. 33: Fill settlement toward the river, resulting in foundation breakout from the porch posts © SKIDMORE, OWINGS & MERRILL LLP 2019 PG 19/23
Fig. 34: Failure of the joist-to-post connection on one side (left) and weak axis bending failure of the joist on the other side (right) due to fill
settlement

                                                                             Fig. 35: Shear crack in entrance
                                                                             slab on grade (left)

© SKIDMORE, OWINGS & MERRILL LLP 2019                                                                                                        PG 20/23
3.3 Infrastructure The repair of major roadways that were damaged by the earthquake occurred rapidly in the days following the event. The damaged off-ramp of Minnesota Drive, an important link to the Ted Stevens Anchorage International Airport, was already under repair when the SOM team began its reconnaissance mission the day after the event. Vine Road, a main artery outside the northern suburb of Wasilla, was heavily damaged due to lateral spreading of the soil where the road crosses over a bog (see Figure 36). Similar damage occurred in roads constructed over bogs during the 1964 earthquake (see Figure 37). Repairs commenced on Vine Road on December 4, four days after the event (see Figure 38) and the road reopened five days later. Nearby Pittman Road was similarly damaged from the earthquake. Although repair work was already underway on both roads, the significant dips over the damaged areas were still noticeable (see Figure 39). Fig. 36: Drone photo of Vine Road failure outside Wasilla, Alaska Fig. 37: Roadway constructed along a bog area, damaged in the 1964 (Photo credit: Anchorage Daily News) earthquake (Photo credit: USGSa) Fig. 38: Vine Road repairs underway Fig. 39: Dip in Vine Road at damaged area © SKIDMORE, OWINGS & MERRILL LLP 2019 PG 21/23
4.0 Conclusions and Next Steps

Overall, the damage caused by the 2018 Alaska earthquake appeared to have been mainly caused by ground
failures and failure of non-structural components. The following types of damage were generally observed by
the SOM reconnaissance team:

  •      Facade damage (cracked facades and windows, spalled stucco, and brick veneer);
  •      Interior nonstructural component failure (fallen ceiling panels and sprinkler head covers, and toppled
		       unbraced items or shelf contents);
  •      Structural damage to a private residence caused by ground failure;
  •      Damage to roads caused by ground failure, particularly adjacent to bodies of water;
  •      Little observable damage in mid-rise and high-rise structures, likely owing to a concentration of
		       earthquake spectral energy at lower periods.

As relatively little direct structural damage was observed in the wake of the 2018 Alaska earthquake, the
information that the SOM team gathered from this reconnaissance mission will primarily provide insight
on nonstructural component failures and the effect of ground failures on buildings and infrastructure. This
information has been shared with the engineering community through organizations such as EERI. The team
is also documenting its findings to be presented to educators, students, architects, and practicing structural
engineers, both in the United States and internationally.

Acknowledgments

The authors were assisted by several structural engineers, seismologists, geotechnical engineers, and other
professionals—both on the ground in Anchorage and from remote locations. The team wishes to acknowledge
the contributions of colleagues Wael Hassan, John Thornley, Utpal Dutta, Scott Hamel, and all those not
mentioned here.

1.  Alaska Earthquake Center. https://earthquake.alaska.edu/event/20419010
2.  American Society of Civil Engineers (2017). “ASCE/SEI 7-16: Minimum Design Loads and Associated
    Criteria for Buildings and Other Structures.“
3. American Society of Civil Engineers (2014). “ASCE/SEI 41-13: Seismic Evaluation and Retroft of Existing
    Buildings.“
4. Anchorage Daily News. (December 4, 2018). “ ‘I just kept going’: The tale of an old Buick, Vine Road and
    a 7.0 earthquake.” https://www.adn.com/alaska-news/mat-su/2018/12/04/i-just-kept-going-the-tale-of-
    an-old-buick-vine-road-and-a-70-earthquake/
5. Archbold, et al. (December 2018). “Alaska Earthquake Preliminary Virtual Assessment Team (P-VAT)
    Joint Report.” StEER: Structural Extreme Event Reconnaissance Network & Earthquake Engineering
    Research Institute (EERI).
6. Brocher, et al. (2014). “The 1964 Great Alaska Earthquake and Tsunamis – A Modern Perspective and
    Enduring Legacies.” https://pubs.usgs.gov/fs/2014/3018/pdf/fs2014-3018.pdf
7. Center for Engineering Strong Motion Data (CESMD). “Strong Motion Data Set - Anchorage,
    Alaska Earthquake of 30 Nov 2018.” https://strongmotioncenter.org/cgi-bin/CESMD/iqr_dist_DM2.
    pl?ID=us1000hyfh
8. Diaz, et al. (September 2017). “Preliminary Observations in the Aftermath of the September 19, 2017
    Puebla-Morelos Earthquake.”
9. Dutta, et al. (2018). “Ground Motion Contour Maps”. http://www.learningfromearthquakes.org/2018-11-
    30-anchorage-alaska/images/2018_11_30_Anchorage_Alaska/pdf/2018.11.30.Countours_rev2.pdf
10. Earthquake Engineering Research Institute (EERI). “Anchorage, Alaska Earthquake Clearinghouse.” http://
    www.learningfromearthquakes.org/2018-11-30-anchorage-alaska/data-map

© SKIDMORE, OWINGS & MERRILL LLP 2019                                                                   PG 22/23
11. GIS Services Data, Projects & Procurement Division - Information Technology Department, Municipality of
Anchorage (December 2006). “Anchorage Bowl - Seismic Map.”
12. Grantz, et al. (1964). “Alaska’s Good Friday Earthquake, March 27, 1964: A Preliminary Geologic
Evaluation.” USGS Circular 491.
13. Martirosyan, et al. (2003). “Ground Motion Analysis in the Anchorage Basin: A 1-D Approach.” Journal of
Earthquake Engineering, 7(2), 251-274.
14. Municipality of Anchorage. “Emergency Management - Tsunami Preparedness.” https://www.muni.org/
Departments/OEM/Prepared/Pages/TsunamiPrep.aspx
15. Network for Earthquake Engineering Simulation (NEES). “Atwood Building, Anchorage”. http://nees.ucsb.
edu/facilities/atwood-building-anchorage
16. Network for Earthquake Engineering Simulation at U. of California, Santa Barbara (NEES@UCSB). “EEG@
UCSB Data Portal.” http://www.nees.ucsb.edu/data-portal
17. United States Geological Survey (USGSa). “1964 Alaska Earthquake Damage Photos.” https://
earthquake.usgs.gov/earthquakes/events/alaska1964/1964pics.php
18. United States Geological Survey (USGSb). “2018 Anchorage Earthquake.” https://www.usgs.gov/
news/2018-anchorage-earthquake
© SKIDMORE, OWINGS & MERRILL LLP 2019 PG 23/23You can also read