PRIVATE WEALTH EQUITY FUND - Q1 2019 - Nedbank
←
→
Page content transcription
If your browser does not render page correctly, please read the page content below

PRIVATE WEALTH
EQUITY FUND
Q1 2019

   Nedgroup Private Wealth (Pty) Ltd Reg No 1997/009637/07, trading as Nedbank Private Wealth. Authorised financial services provider (FSP828), registered
            credit provider through Nedbank Ltd (NCRCP16) and a member of JSE Ltd through Nedgroup Private Wealth Stockbrokers (Pty) Ltd (NCRCP59).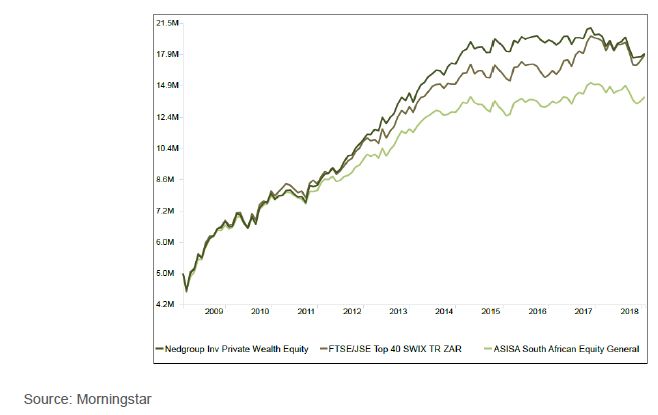
MARKET REVIEW
The JSE posted a strong rebound in the first quarter (SWIX40: +6.06%) with certain stocks experiencing double digit
percentage gains. Among the names which enjoyed a good quarter were Anglo American Platinum, British American
Tobacco, Capitec and BHP.

During the quarter, the top performing sectors were Industrial Minerals (+54.9%), Platinum Mining (+49.7%) and
Tobacco (+29.5%). On the downside, the decliners were led by Pharmaceuticals & Biotechnology (-28.2%), Industrial
Engineering (-20.2%) and General Retailers (-14.2%).

FUND PEFORMANCE
The Fund returned 3.06% for the first quarter, underperforming its SWIX40 benchmark by 3.0% over this period.

Stocks held which contributed to the Q1 performance included Multichoice (+0.56%) and Anheuser-Busch Inbev
(+0.18%) as well an underweight position in MTN (+0.40%). Stocks held which detracted from Q1 performance
included EOH (-0.32%) and Pepkor (-0.14%) as well as underweight positions in Naspers (-1.88%) and Anglo
American Plc (-0.49%).

PORTFOLIO CHANGES
NEW TO THE FUND
The Fund participated in the unbundling of MultiChoice from Naspers during the quarter and increased the position
size further in response to the technical share price weakness created by the unbundling process.

In our view, a price below R100 assumed continued losses from MultiChoice Africa and placed an overly punitive
rating on MultiChoice South Africa (SA). This price range also provided sufficient margin of safety for the potential
impact from heightened competition and regulatory pressure. MultiChoice SA is a stable, steady compounder which
generates very healthy margins. MultiChoice Africa is on a steady pathway towards profitability.

MultiChoice Group has meaningful scale and a wide footprint across multiple platforms. It can defend against over-the-
top and on-demand online video players like Netflix through (i) its large local content library (40k+ hours), and (ii) its
strong local distribution and production capabilities. Exclusive sports rights are an added defence.

The Group’s runway is supported by positive demographics and consumption trends, which are boosted by its use of
big data and its purchasing scale. The Group has attractive dividend prospects, given its high cash conversion (FY18:
92%) and no debt.

INTERNATIONAL EQUITIES
We added to existing positions in global logistics group FedEx and IT consulting group Cognizant.

About FedEx: FedEx, founded in 1971, is the world’s largest express delivery company and the second largest
ground shipping company in the US. The company’s FedEx Express segment (42% of operating profit) provides
delivery services for packages and freight (weight > 70kg per item) to more than 220 countries and counties, covering
99% of the world’s GDP. The FedEx Ground segment (48% of operating profit), which uses an independent contractor
model, does deliveries in the US and Canada, utilising a drop-off and pick-up network of more than 50,000 locations.
The third segment, FedEx Freight (10% of operating profit), does deliveries of less than-truck-load (LTL) in size in the
US, Canada and Mexico.

                                                                                                              PAGE 2 OF 5
FedEx has continued to feel the macro pressures during the first quarter of the year as the trade war between the US
and China impacts the overall global flow of goods. Europe has experienced a slowdown in economic activity over the
last six months. This impacted FedEx’s Express delivery volumes outside of the US, with the main weakness coming
from Europe and Asia. This was the first-time management has noted weakness in Asia compared to previous
quarters where only Europe was noted as weak.
The US region continues to perform well as most of the segments had stronger volumes and pricing. Though strong
momentum on the top-line for the Ground segment came as no surprise, lower operating profit for the segment did.
The lower profitability in the quarter was accredited to the opening of two new hubs in Pennsylvania and Connecticut,
as well as the move from five to six days a week delivery. These incremental costs will continue to weigh on profits in
the short term as capacity is not yet fully utilised. Management feels comfortable with this investment as it will cater for
growing business-to-consumer deliveries from e-commerce. On e-commerce, FedEx reiterated that it does not see
Amazon as a threat to its business, citing that it represents less than 1.3% of total revenue.
FedEx implemented a voluntary retrenchment programme that will cost $450 million to $575 million and will result in
savings of $225 million to $275 million a year. Three reasons have been listed for the programme: (i) the move from
legacy mainframe to cloud has made certain mainframe positions redundant; (ii) mechanisation is reducing the
demand for certain positions; (iii) there is some overlap of roles from the TNT acquisition which will be reduced as the
consolidation nears the end.
There have been numerous calls for management to reduce its capital expenditures and instead return capital to
shareholders via share buybacks, given the Company’s current valuation. Management has reiterated their
commitment to returning capital to shareholders and indicated that $14 billion had been returned over the last five
years. However, this will not happen at the expense of strategic growth initiatives. President and COO, Rajesh
Subramaniam said: “We had a bad quarter. No doubt about it. But I’m not letting one bad quarter decide how we’re
going to manage the business for the next five years”.
About Cognizant: Cognizant Technology Solutions is a global provider of information technology services,
specialising in Outsourcing and Consulting & Technology services. The Company partners with leading third-party
software providers (Adobe, AWS, IBM, Microsoft, Salesforce.com, Workday and more) to develop tailored IT solutions
for its Fortune 1000 clients. Cognizant’s IT services and solutions are tailored to specific industries using an integrated
global delivery model with employees based: (i) onsite; (ii) at dedicated regional offices; and (iii) at global delivery
centres in low-cost regions.
Cognizant is exposed to corporate IT budgets, which are expected to continue to benefit from a large runway
opportunity. Traditional businesses face growing competition from asset-light disruptors such as Amazon, Netflix,
Airbnb etc. and Cognizant facilitates shifting business models to move to a world where they can own hard assets and
still be digital. Digital spend is likely to be resilient across economic cycles as companies not only look at ways to
generate new revenue streams to drive top line growth (through new products and new client experiences), but digital
spend also acts as an enabler to drive cost-saving initiatives. These cost-savings are often used to fund future digital
investments.
Incumbents such as Cognizant have successfully navigated the impact of digital disruption for its clients in the past
and therefore are likely to remain the go-to partners in the future. Most industries do not have the skills to build the
required digital capabilities at scale, thereby outsourcing to the likes of Cognizant who possess technology expertise.
The importance of domain expertise and conceptual knowledge has also increased over the past several years as
clients are looking for industry and client specific solutions. Cognizant’s relationships with its top clients stretch back
many years, even decades. These relationships with global 2000 businesses allow Cognizant to get first hand insight
into the latest technological trends. Cognizant’s net cash position of $3.8 billion further enhances its ability to acquire
any shortfalls in its existing offering.
The latest digital wave has proved to be more disruptive than imagined, having had an impact across industries
requiring businesses to respond. Malcolm Frank, Executive Vice President, Chief Strategy Officer and Chief Marketing
PAGE 3 OF 5Officer stated at Cognizant’s most recent investor day: “In 2010, IT supported the business. It supported an industrial
business model through a bespoke client server stack that had been customised over time inside of our clients. Now
we’re moving to an era where technology is the business”. This means that IT service providers are no longer purely
exposed to its clients’ Chief Information Office but will also become engaged with clients’ Chief Executive Officers,
Chief Marketing Officers, Chief Strategy Officers etc. This will enable Cognizant to capture a greater portion of its
clients’ spend. Frank further went on to mention that there are estimates that “companies will spend roughly $500
billion in the next few years to transform their organisation and capabilities to compete on experience”.
POSITION SIZES REDUCED
We continued reducing our position size in British American Tobacco in response to industry wide issues relating to
more stringent FDA action in the US and the transition to Next Generation Products resulting in reduced future
cashflow visibility.
In prior fact sheets, we have set out the risk management rationale behind capping the overall exposure of the Fund to
the now resurgent Naspers share price.
Aspen de-rating on gearing concerns: Aspen released interim results for the six months ended 31 December 2018
that were, operationally, largely in line with expectations. The market, however, took an extremely negative view with
respect to the high levels of gearing in the firm and expressed its concerns by de-rating the stock c.30% on the day.
Results overview: Group revenue declined -0.8% y/y versus our forecast of -0.5% for the full year. Sales into
Developed Markets (44% of Commercial Pharma revenue) were down -3% y/y, constrained by availability of
anaesthetics. Emerging Market sales grew by 5% and comprise 56% of Commercial Pharma revenue. Gross Margins
improved 50bps to 52.0%, the result of improved efficiencies from thrombosis manufacturing. We anticipate
improvements from anaesthetics manufacture over the medium term as the current capital expenditure on the facilities
bears fruit.
Foreign exchange effects, increased expenditure on selling and distribution costs in Japan and China as well as lower
manufacturing volumes in oncology resulted in the EBITDA margin declining to 28.1% (1H18: 29.3%). Movements in
foreign exchange had a negative impact on the results. FD HEPS declined 9.8% and, on a constant currency basis,
declined 6.0%. Guidance is for a similar result for the full year. We had originally forecast -4.7% for the full year.
Working capital poor: It was disappointing to once again see a large increase in working capital. Management
attributed the inventory increase of 15% y/y to four factors: a stock build ahead of the transfer of manufacturing to the
factory at Notre Dame de Bondeville, stockpiling of heparin in the face of a global shortage, serialisation and Brexit.
While these all have valid business cases, the concern is that inventory levels will not decrease over the medium term
given that there are three factories approaching commercial production that will require similar stock builds. We
therefore no longer expect any cashflow benefits from an inventory drawdown over the medium term. The result of this
inventory stockpiling was that cash conversion was reported at 47%. Cash conversion for the full year is guided to
improve to 90-100%.
Sale of Infant Milk Formula business vital: Aspen’s sale of its infant milk business to Lactalis for EUR740m is
progressing slower than originally expected. Originally, the deal was expected to be concluded by December 2018 and
is now expected to conclude by the end of May. The remaining external condition precedent is the approval for the
Lactalis investment by the New Zealand Overseas Investment Office. The first leg of the approval process, being the
acquisition by Aspen of the 50% local JV partner, has already been approved. The net proceeds are expected to be
EUR635m and will be applied to retire debt.
Precarious financial position: Current gearing increased (per Aspen) to 4.43x net debt to EBITDA. The 4.0x covenant
level had been increased by Aspen’s financiers to 4.75x at higher interest rates. Aspen intends to apply the proceeds
of the Nutritionals sale and the divestment from parts of its Asia Pacific portfolio to reduce the net debt to EBITDA to
PAGE 4 OF 54.0x. Aspen intends to reduce the gearing levels to 3.0x EBITDA over the medium term. No mention was made of
suspending the dividend, but we would welcome this action.
70% of Aspen’s debt is euro denominated versus 44% of revenue from developed markets. 29% of revenue is
denominated in euro. However, euro EBITDA contributes only 8%. This mismatch means that adverse movements in
relative exchange rates will affect gearing and interest cover ratios negatively. This precarious financial position has
raised the risk of a rights issue in spite of Aspen management’s view that the business is at an inflection point. A rights
issue at current multiples will be dilutionary to shareholders and the share price is reflecting this likelihood.
FY19 peak payment period: One positive is that FY19 is the peak payment period for both capital expenditure and
deferred payments (due for past acquisitions). The capex amount is just under R3bn and the deferred payment will
total R5.9bn. This has put strain on the balance sheet for this year but will decline over the next two: guidance is for
R2.6bn in capex and R500m in deferred payments in FY20, R1.5bn capex in FY21 and R1.2bn for FY22. This will be a
tailwind for Aspen to de-gear, provided revenue growth and margins remain stable.
Risks: The key risk to the investment case is that Aspen is unable to generate sufficient revenue growth to maintain
margins and cash flows. Under this scenario, gearing does not get under control, heightening the prospect of a rights
issue. In addition, divestitures of any future products/portfolios are likely to be at low multiples as Aspen will be viewed
by acquirers as a forced seller of assets. As always, regulatory risk and pricing pressure from funders is prevalent
across all geographies.
CLOSING
The fund is positioned for various SA Inc. scenarios which could potentially play out in South Africa over the next few
years. We will continue to take advantage of opportunities as they present themselves.
PAGE 5 OF 5Nedgroup Investments Private Wealth Equity Fund
March 2019
RISK RATING INVESTMENT APPROACH
The appointed investment manager, in conjunction with the Nedbank Private Wealth Investment Research and
Fund Management team, meets on a regular basis to review the fund. The investment manager adopts a bottom-up
approach to position the fund. From a bottom-up perspective, stock picking decisions are based on exploiting
market inefficiencies through diligent fundamental analysis.
LOW MEDIUM HIGH
PORTFOLIO PROFILE
The portfolio seeks to provide investors with capital growth by investing in equities predominantly traded on the JSE
as well as internationally on a select basis. Investors should be prepared for and be comfortable with market
RISK REWARD PROFILE volatility in order to achieve long-term objectives.
Equity investments are volatile by nature and are
subject to potential capital loss. The portfolio is
suitable for investors seeking exposure to equity
markets with maximum capital appreciation as
their primary goal over the long term. Investors
should have a tolerance for short-term market
2
volatility in order to achieve long-term objectives. PERFORMANCE
Period Portfolio Benchmark
1 year pa -3.1% 0.4%
GENERAL INFORMATION
3 Years pa -2.2% 3.5%
BENCHMARK / TARGET RETURN 5 Years pa 4.0% 5.7%
JSE SWIX Top 40 Index 7 Years pa 10.7% 10.8%
10 Years pa 13.8% 13.8%
Lowest 1 year return -15.7%
INVESTMENT MANAGER ASSET CLASS
Highest 1 year return 41.7%
Nedgroup Investment Advisors (Pty) Ltd is
authorised as a Financial Services Provider
under the Financial Advisory and Intermediary The annualized total return is the average earned by an investment each year over a given period of time.
Services Act (FSP No. 1652).
ASISA CATEGORY PORTFOLIO STRUCTURE
South African Equity General
REGULATION 28 COMPLIANT
No Basic materials 10.5%
Industrials 11.1%
INCEPTION DATE Consumer goods 6.6%
01 May 2004 Health care 1.9%
Consumer services 31.1%
FUND SIZE
Telecommunications 3.0%
R 1,746 Million
Financials 22.1%
1
NET ASSET VALUE Technology 3.1%
5757.94 cpu Cash and money market 4.6%
Foreign equity 4.5%
Foreign cash 1.5%
MINIMUM INVESTMENT
Lump sum: R50,000
INCOME DISTRIBUTION TOP 10 HOLDINGS
Frequency: Annually
Share Percentage
December 2018: 98.36 cpu
Naspers Ltd 13.8
Previous 12 months: 98.36 cpu
Remgro Ltd 4.4
Anheuser-Busch InBev SA 4.0
FEES Sasol Ltd 3.8
Annual management fee (excluding VAT): 0.80% BID Corporation Ltd 3.7
RMI Holdings Ltd 3.5
Allied Electronics Corp Ltd 3.4
Reinet Investments SCA 3.3
Total expense ratio 1.17%
RMB Holdings Ltd 3.1
Transaction costs 0.27%
BHP Group Plc 3.1
Total investment charges 3 1.44%
Total 46.1
MINIMUM DISCLOSURE DOCUMENT Published: 18 April 2019Nedgroup Investments Private Wealth Equity Fund
March 2019
SINCE INCEPTION CUMULATIVE PORTFOLIO PERFORMANCE
The graph shows growth of R5 000 000 invested in the portfolio plotted against the Fund's benchmark, the FTSE/JSE SWIX40, as well as the average of the ASISA South African
Equity General category.
Mandatory disclosures:
1. Funds are valued daily at 15:00. Instructions must reach us before 14:00 (12:00 for Nedgroup Money Market Fund) to ensure same day value. Daily prices are available on request from your
relationship manager.
2. Performance is calculated for the portfolio and individual investment performance may differ as a result of initial fees, the actual investment, the actual investment date, the date of reinvestment
and dividend withholding tax. Data source: © 2015 Morningstar.
3. Total Expense Ratio (TER), expressed as a percentage of the Fund, relates to expenses incurred in the administration of the Fund. A higher TER does not necessarily imply a poor return, nor
does a low TER imply a good return. The current TER may not necessarily be an accurate indication of future TER’s. Transaction Costs (TC), expressed as a percentage of the Fund, relates
to the costs incurred in buying and selling the underlying assets of the Fund. TC are a necessary cost in administering the fund and impacts fund returns. It should not be considered in isolation
as returns may be impacted by other factors over time including market returns, the type of fund, the investment decisions of the investment manager and the TER. The Total Investment
Charges expressed as a percentage of the Fund, relates to all investments costs of the Fund. Both the TER and TC of the Fund is calculated on an annualised basis, beginning January 2016
and ending December 2018.
Whilst Nedbank Private Wealth offers you a choice of investment services, the underlying funds forming part of Nedbank Private Wealth strategy solution, are managed by Nedgroup Investments.
More specifically, Nedgroup Collective Investments (RF) Proprietary Limited, is the company that is authorised in terms of the Collective Investment Schemes Control Act to administer the Nedgroup
Investment Private Wealth unit trust portfolios. It is a member of the Association of Savings & Investment South Africa (ASISA). Contact: Nedgroup Investments, P O Box 1510, Cape Town 8000,
info@nedgroupinvestments.co.za, Tel 0860 123 263 (RSA only). The Standard Bank of South Africa Limited is the registered trustee. Contact: Standard Bank, P O Box 54, Cape Town 8000, Trustee-
compliance@standardbank.co.za, 021 401 2002.
Unit trusts are generally medium to long term investments. The value of your investment may go down as well as up. Past performance is not necessarily a guide to future performance. Nedgroup
nvestments does not guarantee the performance of your investment and even if forecasts about the expected future performance are included you will carry the investment and market risk, which
includes the possibility of losing capital. Unit trusts are traded at ruling prices and can engage in borrowing and scrip lending. Certain unit trust funds may be subject to currency fluctuations due to its
international exposure. Nedgroup Investments has the right to close unit trust funds to new investors in order to manage it more efficiently. A fund of funds may only invest in other unit trust funds, that
levy their own charges, which could result in a higher fee structure. A schedule of fees and charges and maximum commissions is available on request from Nedgroup Investments. For further
additional information on the fund, including but not limited to, brochures, application forms and the annual report please contact your relationship manager.
Contact
Nedbank Private Wealth
Contact suite 0860 111 263
email: contact@nedbankprivatewealth.co.za
Visit www.nedbankprivatewealth.co.za for further details
MINIMUM DISCLOSURE DOCUMENT Published: 18 April 2019You can also read