Promoting Green Urban Development in African Cities - Urban Environmental Profile ETHEKWINI, SOUTH AFRICA - Tralac
←
→
Page content transcription
If your browser does not render page correctly, please read the page content below
Report no. 103643

Promoting Green Urban
Development in African Cities
ETHEKWINI, SOUTH AFRICA
Urban Environmental Profile
Promoting Green Urban
Development in African Cities
ETHEKWINI, SOUTH AFRICA
Urban Environmental Profile
COPYRIGHT

© 2016 International Bank for Reconstruction and Development / The World Bank

1818 H Street NW
Washington DC 20433
Telephone: 202-473-1000
Internet: www.worldbank.org

This work is a product of the staff of The World Bank with external contributions. The findings, interpretations,
and conclusions expressed in this work do not necessarily reflect the views of The World Bank, its Board of
Executive Directors, or the governments they represent.

The World Bank does not guarantee the accuracy of the data included in this work. The boundaries, colors,
denominations, and other information shown on any map in this work do not imply any judgment on the part of
The World Bank concerning the legal status of any territory or the endorsement or acceptance of such boundaries.

February 2016

RIGHTS AND PERMISSIONS

The material in this work is subject to copyright. Because The World Bank encourages dissemination of its
knowledge, this work may be reproduced, in whole or in part, for noncommercial purposes as long as full
attribution to this work is given.

Any queries on rights and licenses, including subsidiary rights, should be addressed to the Publishing and
Knowledge Division, The World Bank Group, 1818 H Street NW, Washington, DC 20433, USA; fax: 202-522-2625;
e-mail: pubrights@worldbank.org.
ACKNOWLEDGEMENTS

The Promoting Green Urban Development in African Cities, Urban Environmental Profile for eThekwini, South
Africa was prepared by a core study team led by Roland White (Global Lead: City Management, Governance
and Financing - Task Team Leader) and included Chyi-Yun Huang (Urban Specialist) and a consultant team from
AECOM including John Bachmann, Diane Dale, Brian Goldberg, Maritza Pechin and Dr. Jane Turpie (Anchor
Environmental). Dr. Jeffrey Wielgus Yanovich (Consultant/Environmental and Natural Resource Economist) and
Dr. Timm Kroeger (Senior Environmental Economist, The Nature Conservancy) contributed invaluable technical
insights, critical review and guidance. Jonathan Schroeder (AECOM), Robert Pretorius (AECOM) and Chivashni
Bachen (AECOM) provided secondary data collection and research support. Sonia Wheeler offered organizational
and administrative support and Sarah Botta (AECOM) provided graphic design support.

The document was prepared under the overall guidance of Francisco Ferreira (Chief Economist), Sameh Wahba
(Practice Manager), Mukami Kariuki (Practice Manager) and Asad Alam (Country Director).

This Urban Environmental Profile benefited immensely from close collaboration with representatives from
the Government of South Africa, including the eThekwini Municipality Environmental Planning and Climate
Protection Department (EPCPD), the Office of the City Manager, the Development Planning, Environment and
Management Unit, and the Water and Sanitation Unit. The team would like to express its gratitude especially
to Dr. Debra Roberts (EPCPD) for her close involvement and guidance, and to her team represented by Richard
Boon, Joanne Boulle, Natasha Govender and Bheki Mdletshe for their support and important contributions made.
Special thanks are also given to Mr. Adrian Peters (Chief Strategy Office) for his invaluable key insights.

The study would not have been possible without the generous financial contribution of Korean Green Growth
Partnership.
CONTENTS

I.     INTRODUCTION................................................................................................................................................................ 5
        A.      Methodology....................................................................................................................................................................5

        B.      Summary of Report..........................................................................................................................................................6

II.    ETHEKWINI CONTEXT ...................................................................................................................................................... 7
        A.      Geophysical and Economic Context . ...............................................................................................................................7

        B.      Climate Change Impacts and Challenges........................................................................................................................11

III.   QUALITY OF THE ENVIRONMENTAL ASSETS ................................................................................................................... 13
        A.      Terrestrial Assets ...........................................................................................................................................................15

        B.      Aquatic Assets ...............................................................................................................................................................20

        C.      Coastal Assets ................................................................................................................................................................24

        D.      Air...................................................................................................................................................................................32

IV.    DIRECT DRIVERS AND CAUSES OF ENVIRONMENTAL VULNERABILITY AND DEGRADATION ............................................. 37
        A.      Informal Settlements .....................................................................................................................................................37

        B.      Effluent ..........................................................................................................................................................................39

        C.      Extraction of Natural Resources ....................................................................................................................................41

        D.      Development of the Port of Durban ..............................................................................................................................42

        E.      Solid Waste.....................................................................................................................................................................43

V.     INSTITUTIONAL CHALLENGES......................................................................................................................................... 45
        A.      Overview........................................................................................................................................................................45

        B.      Prevailing Institutional Landscape..................................................................................................................................46

        C.      Institutional Key Findings...............................................................................................................................................55

VI.    KEY FINDINGS ................................................................................................................................................................ 59
VII. BIBLIOGRAPHY............................................................................................................................................................... 61
VIII. APPENDIX ..................................................................................................................................................................... 66
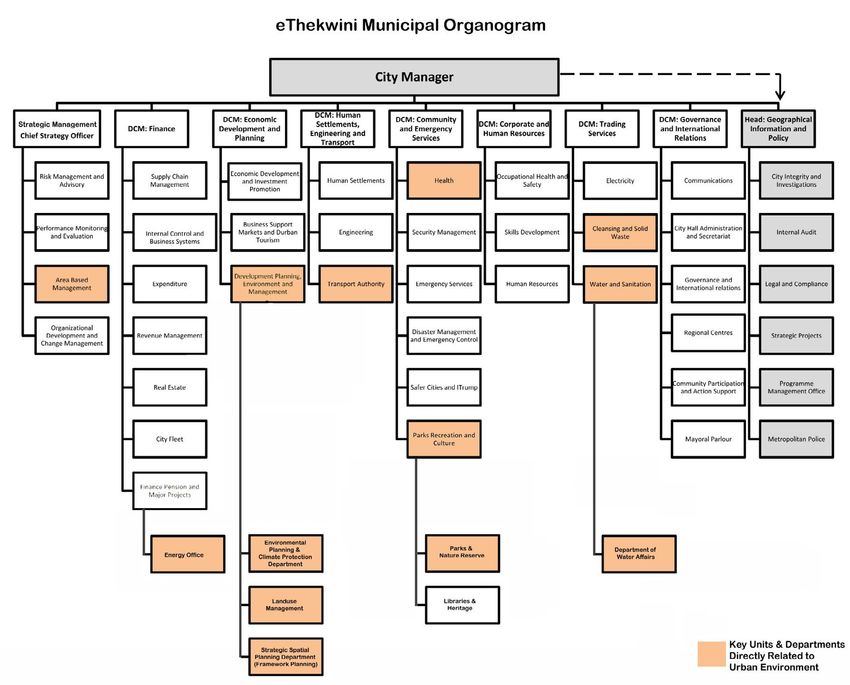
FIGURES

Figure 1    Topographical Map of eThekwini Showing Major Rivers..........................................................................................7
Figure 2    High and Low Growth Scenarios Metro Population.................................................................................................7
Figure 3    eThekwini AIDS Progression.....................................................................................................................................8
Figure 4    Percentage Contribution to GDP in 2012.................................................................................................................8
Figure 5    eThekwini Population Density..................................................................................................................................9
Figure 6    Existing Informal Settlements . ................................................................................................................................10
Figure 7    Land Use Regulatory Framework.............................................................................................................................10
Figure 8    Key Biodiversity Areas (KBA) in the Maputaland-Pondoland-Albany Hotspot ........................................................13
Figure 9    Environmental Map .................................................................................................................................................14
Figure 10   Different Asset Types in eThekwini in 2010 . ...........................................................................................................14
Figure 11   eThekwini Vegetation Cover . ..................................................................................................................................14
Figure 12   Transformed Land in eThekwini...............................................................................................................................15
Figure 13   Relief Map of Original and Remaining KwaZulu-Natal Sandstone Sourveldi............................................................16
Figure 14   Vegetated Patches by Vegetation Type and Size......................................................................................................17
Figure 15   eThekwini River Water Quality (E.coli counts), October 2014 ................................................................................20
Figure 16   Wetlands Permanently Lost.....................................................................................................................................23
Figure 17   Wetland Condition...................................................................................................................................................23
Figure 18   Durban’s Bays and Estuaries.....................................................................................................................................24
Figure 19   Decline in Water Bird Population from 1974 to 1999..............................................................................................29
Figure 20   Durban’s Three Protected Mangrove Habitats.........................................................................................................29
Figure 21   North Beach Quality Monitor...................................................................................................................................31
Figure 22   Annual Benzene Average, 2005................................................................................................................................33
Figure 23   SO2 Monthly Averages (24hr Averages), 2014 Q1....................................................................................................33
Figure 24   PM10 Annual Average Concentration for 2005 at Various Stations...........................................................................34
Figure 25   PM10 and PM2.5 Monthly Averages, 2014 Q1............................................................................................................34
Figure 26   O3 Monthly Averages (8-hour), 2014 Q1..................................................................................................................34
Figure 27   NO2 Monthly Averages (24hrs), 2014 Q1.................................................................................................................34
Figure 28   CO Monthly Averages, 2014 Q1...............................................................................................................................35
Figure 29   TRS Monthly Averages (30 min), 2014 Q1................................................................................................................35
Figure 30   GHG Emissions by Sector.........................................................................................................................................35
Figure 31   Historic Emissions Data for the eThekwini Municipality (tCO2e)..............................................................................36
Figure 32   Existing Informal Settlement ...................................................................................................................................38
Figure 33   Environmental Map..................................................................................................................................................38
Figure 34   Durban Bay Habitat Distribution, 1893-1991...........................................................................................................42
Figure 35   Scope of Rapid Institutional Mapping .....................................................................................................................45
Figure 36   EThekwini Municipality Organogram ......................................................................................................................47
Figure 37   Traditional Authority Areas within eThekwini Municipality’s Jurisdiction...............................................................49
Figure 38   Example of Relevant Legislation and Authorities on Developments of Environmentally Sensitive Areas . .............50
Figure 39   Graphic Illustrating Key Steps and Processes to be Completed for Sanctioning a Legal Sand Mining Activity.........50
Figure 40   Map Showing the eThekwini Schemes Coverage.....................................................................................................51
Figure 41   Schematic Hierarchy of Plans...................................................................................................................................52
Figure 42   Changing Municipal Boundary and Open Space Footprint .....................................................................................53
TABLES

Table 1    eThekwini Historic Population and Population Projections.....................................................................................7
Table 2    Vegetation Targets and Deficiencies by Vegetation Type.........................................................................................16
Table 3    Ecostatus for all Sites Monitored in the 2006 River Survey .....................................................................................20
Table 4    River Quality Rating Scale.........................................................................................................................................20
Table 5    Condition of Notable eThekwini Rivers ...................................................................................................................21
Table 6    Durban Estuarine Health..........................................................................................................................................25
Table 7    Provisional Present Ecological Health Status for Durban Bay . ................................................................................28
Table 8    Beach Closing Due to Poor Water Quality ...............................................................................................................31
Table 9    Access to Sanitation Facilities: eThekwini Households in Informal Settlements......................................................39
Table 10   Wastewater Treatment Works Loading & Capacity – Status Quo, 2030 Scenario and Ultimate Scenario...............40
Table 11   Example of Process, Relevant Authorization and Authorities on Sand Mining........................................................51
EXECUTIVE SUMMARY
The municipality of eThekwini (also known as Durban),           Urbanization and Climate Change
South Africa has undergone a period of rapid urbanization
that has contributed to the degradation of the city’s natural   Although eThekwini is experiencing relatively moderate
environment. The arrival of thousands of in-migrants year       growth in the context of Sub-Saharan Africa, the
after year has overwhelmed the city’s ability to deliver        municipality has been challenged by a fragmented
adequate public services, housing and jobs. Unplanned,          pattern of growth that has contributed to the decline of
densely populated informal settlements that lack basic          the region’s environmental assets. Between 2001 and
water, sewer, and waste services now cover much of the          2011, the population within the municipality grew at an
city’s land area. At the same time, climate change is placing   average rate of 1.13% per annum. By contrast, the cities
further strains on the city’s ability to manage the urban       of Dar es Salaam, Tanzania and Kampala, Uganda grew
environment. Increasing levels of rainfall from climate         at near 5% and 4% per year, respectively, over the past
change contribute to storm runoff levels that exceed the        three decades, with significant environmental degradation.
capacity of the city’s infrastructure, causing flooding and     Though more modest in comparison, the environmental
the spread of pollution. Such conditions have degraded          impacts of eThekwini’s growth have been significant and
the quality of the city’s environmental assets and the vital    threaten the city’s long-term sustainability.
ecosystem services that they provide.
                                                                The city has developed in a fragmented pattern with
eThekwini Municipality (EMA) has considerable                   higher growth in peri-urban areas that have encroached
institutional capacity and has been a leader in conservation    into natural habitats and conservation areas. Key drivers
planning, developing an inventory of greenhouse gas             of the low density pattern of development have included:
emissions, and resiliency planning for climate change           the legacy of Apartheid-based segregation that pushed
adaptation. There are numerous environmental programs           the poor to informal settlement areas in the periphery, the
and projects in place to improve the quality of EMA’s           trend of single-dwelling/plots that has been supported
environmental assets. Yet the municipality is challenged        by national housing policy subsidies, and, more recently,
by the lack of jurisdiction over traditional authority areas    the outward push of development by the private sector.
where many key environmental assets are located.                The proportion of eThekwini households in informal
                                                                settlements is increasing with inadequate provision of
The Urban Environmental Profile for eThekwini has               formal affordable housing. Informal settlements are often
been prepared as the first component of the assignment          located within the Trust Lands that are not subject to either
“Promoting Green Urban Development in Africa: Enhancing         municipal development or environmental regulations.
the Relationship Between Urbanization, Environmental            The lack of planning and compliance with municipal
Assets and Ecosystem Services,” a project being conducted       environmental and conservation objectives has led to the
under the leadership of the World Bank. The Urban               destabilization of land and vegetation in critical catchment
Environmental Profile summarizes the existing quality of        areas and resulted in the degradation of the water quality
the city’s environmental assets, identifies the drivers of      downstream. The decline in water quality has been
environmental vulnerability, and describes the institutional    compounded by the lack of sanitation infrastructure in
challenges and constraining factors that limit the city’s       approximately 67% or 209,847 households within informal
ability to address the environmental management                 settlements which directly and indirectly discharge effluent
challenges. By consolidating, into one document,                into the municipality’s rivers.
eThekwini’s drivers and challenges in environmental
management, this document can inform and empower                eThekwini has already experienced the impacts of
municipal officials, non-governmental entities and other        climate change that threaten coastal wetland and dune
advocates to more effectively promote sustainable and           ecosystems. Projected changes in climate include: a 1.5 to
inclusive development.                                          2.5° C increase in mean annual temperature by 2065 with
                                                                a 3 to 5° C increase in mean annual temperature by 2100;
                                                                an increase in aggregate rainfall by 2065 with an increase
                                                                of up to 30% by 2100; and an increase in coastal storms,
                                                                storm surges, and flooding due to an increase in sea
                                                                level rise of 2.7 +- 0.05 mm/yr. The changes could result
                                                                in an increase in droughts and water shortages that will
                                                                exacerbate existing water stress.

                                                                                            eThekwini, South Africa    Page 1
Environmental Assets and the Drivers of Environmental There is significant and increasing competition for
Vulnerability water with growing water requirements as the city and
region develop. The city’s water is predominantly from
eThekwini is located in the middle of a global biodiversity Umgeni Water Supply Scheme, which is managed as an
and therefore requires careful consideration and balance integrated system for greater regional supply. Water is
between nature conservation and urban development. becoming increasingly more expensive as local resources
The region supports a high proportion of endemic plant are fully developed and depleted, requiring more water
and animal species and includes savanna, forest, and to be imported inter-basin transfers. Disposal of treated
grassland terrestrial biomes that support over 2,000 plant effluent into estuaries is beginning to decrease available
species. Over the past decades, the degradation of upland high quality water and may increase treatment costs.
natural habitat of flora and fauna, the invasion of alien Uncertainty about the impacts of climate change on water
species, and a general decline in biodiversity has been resources further challenges EMA planning.
observed. Land development in the upland areas has
resulted in the increase in compacted and impervious land The unchecked release of untreated or inadequately
surfaces and the excessive extraction of natural resources treated sewage and effluent is a contributing factor to
such as sand has stripped soil and vegetation cover with the poor water quality of the city’s rivers and degrades
significant erosion and sedimentation. These practices estuarine health. Approximately 209,000 households
have exacerbated stormwater runoff and flooding, causing within EMA lack sanitation services, resulting in untreated
further disturbance in water catchment areas and the sewage and effluent discharging directly and indirectly
decline of water quality and availability. into the rivers and streams. Furthermore, a number of
wastewater treatment plants are approaching designed
The vegetated ecosystems of EMA are highly fragmented. capacity and will need to be upgraded (eThekwini
While 26% of EMA land area is vegetated with natural Municipality, 2011). Waste water treatment is hindered by
and semi natural habitats, the majority of the vegetated illegal storm water drainage ingress that is introduced into
areas are not large. Contiguous vegetated areas are the sewer system, resulting in an unintended “combined”
generally in the range of 50 ha or less while the majority sewer system effect. The excessive storm water flow during
are significantly smaller. Habitat fragmentation impacts peak events results in temporary overwhelming of the
different species in different ways and could greatly capacity of waste water treatment works. The anticipated
threaten the municipality’s biodiversity. While the increase in the intensity of storm events from climate
vegetated areas need not be particularly large to contain change will cause more frequent occurrences of overflow
significant ecosystems, inter-connectedness of vegetated from combined runoff and exacerbate its impacts.
areas can compound their ecological value.
The average rate and volume of storm water runoff
eThekwini’s rivers have become heavily polluted by human in the EMA has increased due to the increase in the
activities and continue to degrade. There are 16 main rivers proportion of impervious surface area. The EMA lacks a
and estuaries, a number of which have headwaters and city-wide drainage system to slow the velocity and volume
catchments that begin outside the EMA. In a 2010 sampling of storm water runoff. Flooding has been increasing with
of 61 river sites, 40% were rated in poor condition and only sea level rise and intensity of storm events. Compounding
3% rated in good to intermediate condition. All but three of the problem is the degraded quality of the storm water
the estuaries were rated with generally good condition in runoff received from informal settlement areas that lack
2009. The causes of degradation of the aquatic assets are infrastructure as the runoff carries untreated sewage into
numerous and include: effluent spills and illegal discharge, the systems.
sporadic short term waste water treatment challenges
during high rainfall events, solid waste dumping, realignment
and canalization of water channels, flow reductions
(dams), and the sedimentation that has resulted from
land conversion, removal of vegetation (particularly within
the riparian corridors), and sand mining. In general, the
conditions of the rivers worsen as they flow through EMA
toward the coast.
Page 2 Promoting Green Urban Development in African CitieseThekwini’s wetlands are significantly degraded, Key Findings
with limited support for biodiversity and biological
productivity. Twenty-four percent of the original wetlands eThekwini has experienced urbanization over periods of
of the EMA have been permanently lost. Most of the development; economic, social, and political drivers have
damage to the wetlands was driven by historical agriculture shaped the spatial arrangement and the environmental
uses although land use conversions, encroachment, the quality of the city. Much of the environmental
construction of dams, and irrigation have reduced flows degradation is the result of longer term activities due
and contributed to the pollution of inflows to the wetlands. to the development and expansion of the port and the
In 2014, 6,200 ha of wetlands remain, although 90% of the growth of a multi-nodal city. While the rate of population
wetlands are rated degraded and only 10% are rated in growth is relatively low, the pace of land conversion for
good or intermediate condition. development suggests relocation of households (resident
and commercial flight from the central business district)
The coastal ecology has been heavily impacted by and the decompression of households. The conversion
development. The originally healthy mangrove forests of large inland and upstream areas– for formal and
along the coast have nearly disappeared and eThekwini’s informal development– is a source of degradation to water
renowned beaches are eroding and becoming increasingly catchments, compromising essential environmental assets
polluted. The degradation of mangroves occurred and services of the city as a whole.
predominantly in the 1960-1970s due to modernization
of the port and coastal development. The remaining eThekwini is challenged by the fragmented capacity to
significant mangrove forest areas include 15 ha at Durban implement and enforce environmental regulation. There
Bay, 44 ha at the mouth of the Umgeni River, and 12.5 are multiple layers of government involved in the regulation
ha at Isipingo River. The beaches, an important economic of the environment with limited authority at local levels and
asset to the city, are declining in quality and quantity a lack of integration between planning and environmental
from increased erosion due to more frequent and intense processes. As of 2012, only 12% of the Durban Metropolitan
storms and the interruption of natural sand deposits due to Open Space System (D’MOSS), the primary tool for
shoreline construction. There has also been an increasingly conservation of the municipality’s environmental assets,
poor level of water quality at the beaches in the first 24 of the municipality’s environmental assets, is formally
hours after a storm event due to the volume and quality of protected via land acquisition, nature reserve proclamation
runoff. Beach erosion also threatens the habitat of plants and non-user conservation servitudes.
and animals and the biodiversity of the aquatic ecosystems,
which projected sea level rise will exacerbate. Institutionally, the most difficult issue to address is the
EMA’s lack of authority over land under traditional
eThekwini has implemented air quality regulations that authority and consequent inability to promote their
have resulted in lowering of the concentration of major development and conservation. The lack of operational
air pollutants below international thresholds. It has coherence between the municipality and land under
become a leader among African cities in understanding traditional authority has had significant impact on the
the municipality’s contribution to climate change, having environmental assets. Land under traditional tenure
initiated the inventory of greenhouse gas emissions more systems is informally regulated and not aligned with
than a decade ago. Intervention by EMA has reduced the municipal planning or environmental goals, resulting in
historically high levels of SO2 from industrial activities, the de facto land development and degradation of upland
impact of agricultural activities such as sugar cane crop catchment areas. While eThekwini has developed
burning, and required capture of landfill methane gas numerous programs to address environmental degradation,
onsite. However, vehicular emissions from the transport it has been limited by the lack of authority over some of
sector are a growing source of air pollution. eThekwini the most critical conservation lands.
began to document an inventory of GHG emissions in 2002
and has improved data collection with the most recent eThekwini is further challenged by the absence of an
reporting in 2012, which identified an increase from 20 effective platform or mechanisms for integrated and
MtCO2e to approximately 29 MtCO2e over the prior ten cross-sectoral dialogue and decision making. Strategic
year period. Durban’s 45% increase in emissions between and financial planning across the sectors lacks integration
2002 and 2012 is roughly equivalent to the 46% increase in and there are misalignment of goals, schedules, and
emissions among a portfolio of large developing countries reporting requirements. This has resulted in institutional
including South Africa, India, Brazil and Mexico (Olivier, Jos fragmentation that has failed to provide an effective
G.J. et al., 2013). framework to protect and conserve the municipality’s
environmental assets.
eThekwini, South Africa Page 3Page 4 Promoting Green Urban Development in African Cities
I.       INTRODUCTION                                             A.       Methodology
The city of eThekwini or Durban has undergone a period of         The Urban Environmental Profile was developed based on
rapid urbanization that has contributed to the degradation        the collection of data using the Rapid Urban Environmental
of the city’s natural environment. The arrival of thousands       Assessment (RUEA) tool developed jointly by the United
of in-migrants year after year has overwhelmed the city’s         Nations Development Programme, United Nations Centre
ability to deliver adequate public services, housing, and         for Human Settlements (UNCHS – Habitat), and the World
jobs. Unplanned, densely populated informal settlements           Bank (Leitmann, 1994). The purpose of the RUEA is to
that lack basic water, sewer, and waste services now cover        document available data and identify gaps in knowledge. A
much of the city’s land area.                                     questionnaire was developed to guide the collection of data
                                                                  and to generate a baseline of environmental information.
Climate change is placing further strains on the city’s ability
to manage the urban environment. Increasing levels of             The RUEA questionnaire includes numerous charts to be
rainfall from climate change contribute to storm runoff levels    populated with specific data on sanitation, solid waste,
that exceed the capacity of the city’s infrastructure, causing    energy, and other urban systems and services. While
flooding and the spread of pollution. Such conditions have        the questionnaire was used as a starting point for data
degraded the quality of the city’s natural environment and        collection, the team found that for the most part the
the vital ecosystem services that it provides.                    information was not available in this format and that the
                                                                  focus of the questionnaire was more narrow than that of
The Urban Environmental Profile of eThekwini has been             the study. However, while the questionnaire often could
prepared as the first component of the assignment                 not be answered directly within the format or specific units
“Promoting Green Urban Development in Africa:                     requested, it did guide the team towards the intended
Enhancing the Relationship Between Urbanization,                  data, provided that the team considered the purpose or
Environmental Assets and Ecosystem Services,” a project           intention of each question.
being conducted under the leadership of the World Bank.
An overall objective of this project is to link the study of      Identification of the key environmental assets and key
urban environmental issues with the advancement of                drivers of environmental degradation within the city
more sustainable urban growth. The Profile summarizes             required a more comprehensive review of reports on
the existing quality of the terrestrial and other aquatic         urban planning and infrastructure services. The required
environmental assets, identifies the key drivers that are         information was too complex to fit into the RUEA
the cause of their vulnerability, and describes the key           questionnaire format. Therefore, the process evolved to
institutional challenges and constraining factors that limit      the definition and annotation of an outline for the profile
the city’s ability to address environmental management            that was then developed into this document.
challenges. By consolidating, into one document,
eThekwini’s drivers and challenges in environmental               Consultation with key stakeholders informed the drafting
management, this document can inform and empower                  of the profile. A kick-off workshop held in eThekwini in
municipal officials, non-governmental entities and other          September 2014 introduced relevant municipal officials
advocates to more effectively promote sustainable and             and stakeholders to the objectives and intentions of
inclusive development.                                            the study. Participants provided overall direction on
                                                                  relevant secondary sources of environmental data, such
                                                                  as municipal development plans and strategic planning
                                                                  documents and reports prepared by national-level
                                                                  ministries, the World Bank, and United Nations (UN).
                                                                  Information was also gathered from interviews with
                                                                  municipal officials.

                                                                  A PowerPoint presentation summarizing the intermediate
                                                                  findings was presented during a second workshop in
                                                                  November 2014. During the event, key stakeholders
                                                                  provided preliminary comments and feedback that guided
                                                                  the refinement of the Profile.

                                                                                              eThekwini, South Africa    Page 5
B. Summary of Report
The Urban Environmental Profile is organized as follows:
Section II: eThekwini Context sets the background and
context of the study of Durban, providing an overview
of the impacts of urbanization and climate change and
drawing the link to the urban environment.
Section III: Quality of the Environmental Assets of
eThekwini describes the state of the key environmental
assets of eThekwini: the terrestrial assets, aquatic assets,
coastal assets, and the air, and attempts to infer the
associated historic and current trends.
Section IV: Drivers of Environmental Vulnerability and
Degradation describes the key issues that are driving
degradation, the impacts caused, and the reason for
these challenges. Drivers include informal settlements;
effluent from residential, industrial and municipal sources;
extraction of natural resources; development of the Port of
Durban; and solid waste.
Section V: Institutional Issues and Challenges describes
the key factors that constrain the eThekwini‘s ability to
effectively address environmental management challenges.
Section VI: Key Findings provides a synthesis of key findings
of the study.
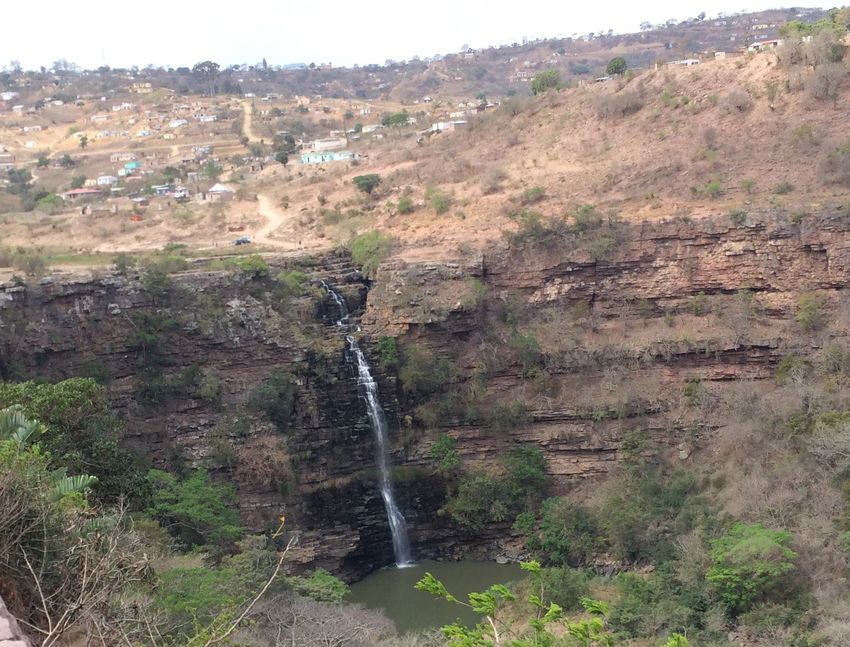
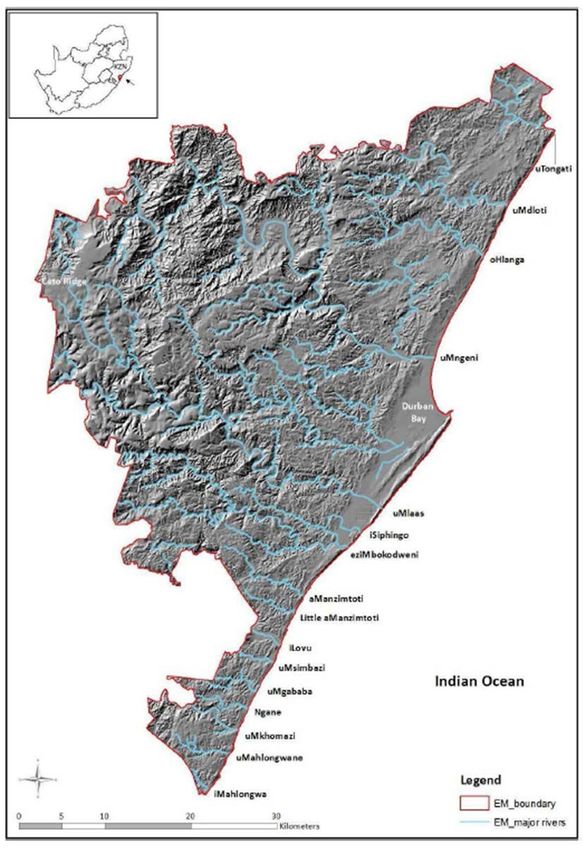
Page 6 Promoting Green Urban Development in African CitieseThekwini is located on the southeastern coast of South Africa in the province of KwaZulu‐Natal (KZN) (se
1). eThekwini is 229,193 hectares (2297 km2) and is bounded by uTongati River in the north, the aMahlon
to the south, and the Indian Ocean to the east (Govender N, EPCPD, 2014). The eThekwini Municipal Area
Promoting Green Urban Development in African Cities AECOM
characterized by diverse topography, fromeThekwini, South Africa
steep escarpments Urban
in the westEnvironmental Profile
to a relatively flat coastal plain
east.
Durban’s population is growing at an average annual rate of 1.3% and is expected to continue to increase.
Between 2001 and 2011, the population of
II. ETHEKWINI
Durban grew from 3.09CONTEXT
million to 3.45 Table 1 eThekwini Historic Population and Population Projections
million at an average annual growth rate of Year Population Annual growth rate
A. Geophysical and Economic
1.13%, as shown in Table 1 (eThekwini 2001 3,090,000 Average Annual
growth of 1.13%
2011 3,442,361
Context
Municipality, 2014a). This growth rate is
2012 3,446,447 0.12%
slower than other urbanizing African cities,
2013 3,480,726 0.98%
eThekwinisuch as Dar is
or Durban eslocated
Salaam’s onaverage growth rate
the southeastern coast
of 4 toin5%, 2014 3,517,157 1.04%
of South Africa thebut it is nonetheless
province a high (KZN)
of KwaZulu-Natal
2015 3,555,868 1.09%
(see Figureaverage growth rate.
1). eThekwini (URT 2002,
is 229,193 hectares2012).
(2297
2016 3,596,543 1.13%
km2) and is bounded by uTongati River in the north, the
However, eThekwini’s 2017 3,638,918 1.16%
aMahlongwa River to the south, mortality rates,Ocean to
and the Indian
inflated2013c).
by AIDSThedeaths, may be masking Area
the 2018 3,682,524 1.18%
the east (EPCPD, eThekwini Municipal
rate of in-migration
(EMA) is characterized in population
by diverse topography, growth
from steep 2019 3,727,032 1.19%
escarpmentsrates. In 2007,
in the west 40,000 deaths flat
to a relatively werecoastal plain in 2020 3,772,097 1.19%
the east. attributed to AIDS (eThekwini Municipality, 2021 3,818,499 1.22%
2012). Figure 2 depicts the number of deaths 2035* 4,000,000
Between 2001
causedandby2011,
AIDS the
and population
the numberofnew HIV grew Sources: eThekwini Municipality, 2014a; *eThekwini Housing Unit, 2012
Durban
from 3.09cases
million to 3.45 million at an average annual
annually.
growth rate of 1.13%, as shown in Table 1 (eThekwini
Municipality, 2014a).
Durban’s This growth
population rate is relatively
continues to increase,slower
than otherreaching
rapidly urbanizing African cities, such
a conservative estimate of 4 million as Dar es
Salaam (atandan average
an aggressive estimate of over 4.5 2002,
growth rate of 4 to 5%) (URT
2012). million by 2035 (eThekwini Housing Sector
Unit, 2012; eThekwini Municipality, 2012).
Durban’s population is projected to grow at a steady rate
According to the Housing Sector Plan’s
over the next couple of decades. By 2035, the population
projections, Durban will reach 3.7 million by
is projected to be between 4.1 and 4.5 million as shown
2020 and 4 million by 2035, as shown in
is Figure 2, and under low and high growth scenarios
Table 1 (eThekwini Housing Sector Unit,
respectively (eThekwini Housing Sector Unit, 2012,
2012). The Water and Sewer Department’s
eThekwini Municipality, 2014a).
growth scenarios, shown in Figure 3,
Table 1 conservatively
eThekwini predict and
Historic Population a population of just
Population Projections
over 4.1 million and aggressively predict a Figure 1 ofTopographical Map Major
of eThekwini
Year Population Figure 1 Topographical Map eThekwini Showing Rivers Showing Major Rivers
population of over 4.5Annual
millionGrowth
by 2035Rate* Figure
Source: Govender 20142 eThekwini
N, Source: Govender N,AIDS
2013 Progression
Source: eThekwini Municipality, 2012
2001 (eThekwini Municipality, 2012). Regardless
3,090,000 12 December 2014 85% Draft Submission P
of the exact future population figure both
2011 sources 3,442,361 Average will
agree that eThekwini Annual growth of
continue
1.13% (2001-2011)
to grow at a steady rate over the next couple
2012 of decades.
3,446,447 0.12%
2013 3,480,726 0.98%
2014 Migration of population to eThekwini
3,517,157 1.04% is an
important contributing factor to population
2015 3,555,868 1.09%
growth. According to Census 2011, the
2016 province 3,596,543
that provided most migrants 1.13% to
2017 eThekwini was KwaZulu-Natal. 1.16%
3,638,918 Considering
2018 other sources
3,682,524 besides KwaZulu-Natal,
1.18% the
largest source of migrants (39,500) was from
2019 3,727,032 1.19%
outside the country. The next largest source
2020 was the 3,772,097
Eastern Cape (38,500) 1.19% followed by Figure 2 High and Low Growth Scenarios Metro Population
2021 Gauteng (24,300). Many of the1.22%
3,818,499 migrants are Source:
Figure eThekwini
3 High Municipality,
and Low Growth 2012
Scenarios Metro Population
2035* taking up residence
>4,000,000 in informal settlements, Source: eThekwini Municipality, 2012
and in the case of migrants from outside
* Note: Best published estimate, though numbers are not considered accurate
with projected growth to be far in excess of the amount reported. Source:
eThekwini Municipality, 2014a; *eThekwini Housing Unit, 2012
12 December 2014 85% Draft Submission Page 13 of 58
eThekwini, South Africa Page 72016 3,596,543 1.13%
2017 3,638,918 1.16%
ng the 2018 3,682,524 1.18%
wth 2019 3,727,032 1.19%
2020 3,772,097 1.19%
ality, 2021 3,818,499 1.22%
deaths 2035* 4,000,000
Sources: eThekwini Municipality, 2014a; *eThekwini Housing Unit, 2012
HIV
AIDS Deaths New HIV’s eThekwini’s mortality rates, inflated by AIDS deaths, may
eThekwini Municipality:
ease, 2013/14 IDP Review be
masking the rate of in-migration population growth
million rates. In 2007, 40,000 deaths were attributed to AIDS
significant bloc having tremendous clout to influence tangible outcomes at the global level. On
(eThekwini Housing Unit, 2012). Figure 3 depicts the
he regional front it gives eThekwini the opportunity to explore or strengthen economic gateways
octor
the Southern African Development Community (SADC) and with the other members within number of deaths caused by AIDS and the number of new
BRICS as the Municipality embarks on its ambitious plans to develop it’s freight corridor and
012).
expand operations at the existing- and the new Dig-Out Ports.
HIV cases annually.
s
These lofty goals, however, may be hampered by various socio-economic and other threats
on by In-migration is a key contributor to eThekwini’s population
such as the lack of appropriate job skills, poor political will, unspectacular economic- and
in
employment growth. According to Census 2011, the province that
growth, inadequate foreign direct investment, high cost of doing business, poor
nfrastructure and a lack of serviced industrial land.
t, provided most migrants to eThekwini was KwaZulu-Natal,
ent’sStrategy examines trends in the detailed sub sectors in manufacturing noting the
The followed by migrants from Eastern Cape and Gauteng. 15%
of eThekwini’s newcomers reside in informal settlements,
comparative and competitive attributes for each after which a choice of industries are selected.
These priority sectors include automotive, chemicals, clothing and textiles, food and beverage,
just
urniture, metals, electronics and electrical machinery and green industries. In the services
(IDP, 2014).
ct a tourism, ICT, creative industries (Film and Media; Crafts; Fashion), finance and
sector
professional services
Figure 2and transport and
3 eThekwini
eThekwini AIDS
AIDSlogistics were identified.
Progression
Progression GDP growth in the eThekwini Municipal region increased
dlesseThekwini’s GDP (in constant 2005 prices) amounted to R206, 9 billion in 2012. It by
The
Source: eThekwini
Source: eThekwiniHousing Unit, 2012
Municipality, 2012
is 3.5% between 2011 and 2012, while KwaZulu-Natal
orecasted
oth to grow by 3, 1% to R213,2 billion during 2013. Presently it comprises 65, 5% and of South Africa grew by 2.5% and 3.0% respectively
KwaZulu-Natal’s GDP and 10, 7% nationally.
inue (eThekwini Municipality, 2014a). This GDP growth has
couple
GDP been steady, growing from 2009 at 3.3% (eThekwini), 3.2%
growth in the eThekwini Municipal region increased by 2.0% between 2011 and 2012
while KwaZulu-Natal and South Africa grew by 2.5% and 3.0% respectively. (KZN), and 3.1% (SA) (eThekwini Housing Unit, 2012).
In 2012, the two largest economic sectors (in terms of
s an percentage contribution to GDP) in eThekwini were finance
ation (22%) and manufacturing (22%), as shown in Figure 4.
e The manufacturing sector includes food and beverage
to production, as well as petroleum, fuel, chemical, and
ering rubber production (eThekwini Municipality, 2014a).
the
s from The Port of Durban is a critical economic asset for the city.
ource The Port of Durban is the largest port on the east coast
d by of Africa and on average, handles 31.4 M tons of cargo
ts are Figure 3 High and Low Growth Scenarios Metro Population valued at R 50 billion annually (Environmental Resources
ments, Source: eThekwini Municipality, 2012 Management et al, 2011). Port activity is anticipated to
de increase over the next several years as there are plans to
Figure 5: Percentage Contribution to GDP in 2012 (Constant 2005 prices)
Figure
Source: Global 4 Percentage Contribution to GDP in 2012
Insight expand Durban’s shipping capacity with the construction
Source: eThekwini Municipality, 2014a of a dig-out port in South Durban. Plans call for tripling or
The above chart shows the percentage contribution to GDP by broad sectors during 2012. The
eThekwini economy
85% Draftwas dominated by tertiary industries that included (1) finance
Submission Page(22%),
quadrupling the capacity of current port operations. After
13 of 58(2)
manufacturing (22%), (3) community services (18%), trade (16%), transport (16%) and completion, the Port of Durban will be the biggest port in
construction (3%). Apart from the tertiary sector fulfilling a major role within the context of
eThekwini’s economy, manufacturing (which is classified within the secondary sector) the southern hemisphere (Steyn, 2013).
South
30 Durban is home to several heavy industrial activities
including one of the two largest oil refineries in South
Africa, which refines 60% of South Africa’s petroleum. A
paper mill, airport, landfills, incinerators, manufacturers,
and rail facilities are also located in South Durban
(eThekwini Municipality, n.d. b).
Page 8 Promoting Green Urban Development in African CitiesAlthough the unemployment rate is generally high,
eThekwini has shown significant improvement,
decreasing from 31.4% in 2006 to 20.4% in 2011. When
compared to the other metro municipalities in 2011,
only the City of Tshwane performed better achieving
a 13.2% unemployment rate. Despite the decrease in
unemployment, a more representative figure is the
percentage of people employed from 2006 to 2011 as
it includes the effect of workers who left the workforce.
eThekwini still outperformed the other metros with an
employment increase percentage of 3.8% during the five
year period. These gains are essentially not as great as
the reduction of unemployment rates portray (eThekwini
Municipality, 2014a).
A much higher unemployment rate is observed in
informal settlements. Informal settlements exhibit a much
higher average unemployment rate of 43% (The Housing
Development Agency, 2013). The gap between the rich
and the poor is high, with the 2012 Gini coefficient1 for
eThekwini Municipality standing at 0.63, which is the
national average (eThekwini Municipality, 2014a).
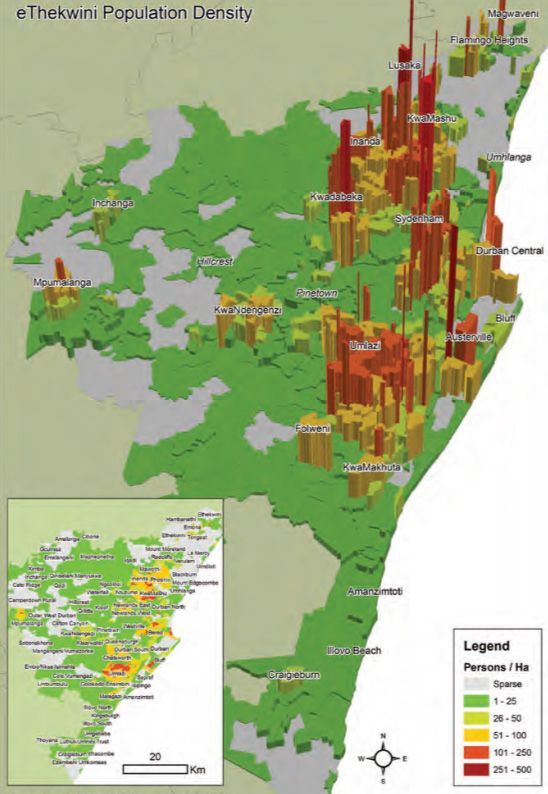
Historically, the city has developed in a fragmented
pattern, with higher growth in peri-urban areas.
eThekwini has a multi-nodal spatial development form.
In addition to the central business district (and nearby
inner western suburbs), two other large residential zones
of medium-high density can be observed – to the north
Figure 5 eThekwini Population Density
(KwaMashu, Inanda and Lusaka) and south-west (around
Source: State of the City Report 2011
Umlazi) (see Figure 5). On average the density is 4 dwelling
units per hectare (eThekwini Housing Unit, 2012). This
development pattern is partially due to legacy Apartheid
segregation policies, a development and cultural trend
of developing one unit per plot, and development by the
private sector in outer areas where land is more readily
available.
1
The Gini coefficient is a measure of income inequality where a Gini coefficient of 0
represents complete equality and a coefficient of 1 represents complete inequality
(World Bank, n.d.).
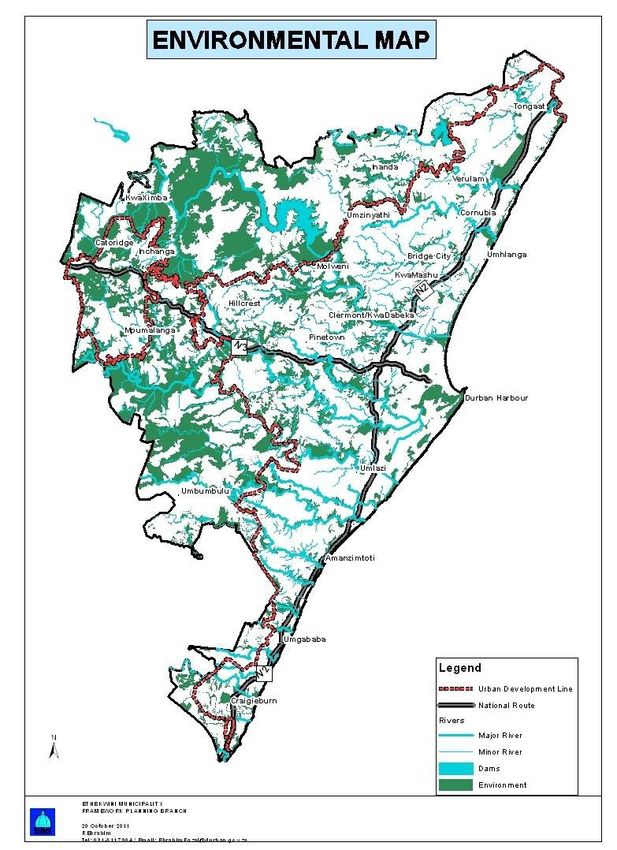
eThekwini, South Africa Page 9Figure 13: Existing Informal Settlement
EXISTING INFORMAL SETTLEMENTS &
New development that is transforming land is largely
THEIR DENSITIES taking place along the urban periphery. The percentage
of eThekwini land area that is transformed increased from
49 to 53 percent from 2008 to 2011 (EPCPD, 2011/2012).
Transformed land describes land that is used for agriculture,
recreation, human settlements, and utilities. While the
growth rate of developed land is comparable to that of
population, new developments are largely taking place along
the periphery of the urban boundary, which has led to:
• Greater encroachment into natural habitats
and reduction in biodiversity;
• Increasing reliance on travel by motorized vehicles,
which contributes to an increase in air pollution;
• Higher costs and capacity challenges to provide
infrastructure services to areas not yet served.
The proportion of eThekwini households in informal
settlements is increasing due to inadequate provision or
availability of affordable housing. Informal settlements
were home to 24.9% of eThekwini’s households in 2001
and 27.2% in 2011. As shown in Figure 6, these settlements
are located on the edge of the urban core and spread into
the urban periphery. The settlements are predominantly
medium density, with less than 20-40 dwelling units
per hectare. In addition, there are pockets of informal
settlements throughout the city with over 40 dwelling units
Figure 6 Existing Informal Settlements per hectare (eThekwini Housing Unit, 2012).
The Informal
Source: Settlement
eThekwini programme
Municipality, 2013b is the major focus of eThekwini Housing. The principal intention is to
upgrade informal settlements wherever possible and to only relocate residents if Informal
upgrading issettlements
impossible in the periphery have extended
for health, safety or technical reasons. Social and economic amenities to enhancethe
the reach of development
sustainability of the into natural habitats and
upgraded settlements may also be provided, or existing ones expanded. conservation areas. Informal settlements are predominantly
located in the urban periphery in undeveloped areas. When
comparing
Informal settlements must be integrated into the broader urban fabric to overcome Figure
spatial, social and6 and Figure 7, informal settlements
predominate in areas not administered by the eThekwini
economic exclusion. This will require a range of short- and long-term responses, including interim relief,
Municipality.
incremental upgrades, planning and management of informal settlements, greenfields, and sustained,The encroachment into natural habitats and
long-term upgrading programs. conservation areas destabilizes the land and vegetation of
critical catchment areas. This, coupled with the fact that
approximately 67% (209,847 out of 313,958 households)
85
of informal settlement and rural traditional households
lack sanitation infrastructure results in the degradation of
water quality downstream (eThekwini Municipality, 2012a).
Informal settlements are located at the urban edge for
three primary reasons. First, historic Apartheid-era planning
did not allocate land for low-income housing in the urban
core, thereby pushing informal settlements to the urban
fringe (Marx et al, 2003). Second, the combination of a
high demand and high price premium for well-located land
within the urban core means that there is limited space for
low-income settlements. Third, land use regulations within
Ingonyama Trust lands are lenient, thereby encouraging
informal settlements to occur. Areas formally administered
by the eThekwini Municipality occupy approximately 36% of
Figure 7 Land Use Regulatory Framework the EMA, while the remainder of the EMA is composed of
Source: eThekwini Municipality, 2013b traditional authority (approximately 37%) and non-scheme
agriculture zones (approximately 27%) (EPCPD, 2013e;
Page 10 Promoting Green Urban Development in African Cities eThekwini Municipality, 2013b).B. Climate Change Impacts and • Increased and varied rainfall may impact potable
water collection, lead to flooding, overburden
Challenges waste-water treatment plants thereby impacting
water quality, and lead to an increase in water-
eThekwini is already experiencing the impacts of climate
borne diseases. Increased frequency of large storms
change, with a documented annual sea level rise of 2.7
will erode the shoreline. eThekwini is projected to
mm that threatens coastal wetland and dune ecosystems.
experience increasing and more varied rainfall. Rain
Climate change has been identified globally as one of the
events are expected to increase in intensity, with a
key challenges of the 21st Century (IPCC, 2014a). The
potential increase in aggregate rainfall by 2065 of up
impact of climate change is likely to fall disproportionately
to 500 mm by 2100. The northern parts of the EMA
on cities of the global south, such as eThekwini, which
are expected to experience increases of up to 20% in
are already facing developmental and other challenges.
long duration (1 day and longer) rainfall. The outer
It is widely acknowledged that despite Africa’s minimal
west areas are predicted to experience increases in
contribution to global greenhouse gas emissions, the
short duration rainfall which may lead to localized
continent is likely to experience severe consequences
increases of up to 30% in short-term flooding (EPCPD,
from climate change, such as amplified water-stress and
2014a).
food insecurity. Climate change is likely to undermine
development efforts in the region and exacerbate poverty.
The efficacy of dams to capture and store water will be
Africa is particularly vulnerable because it lacks the
impacted, as will the amount of water available for human
capacity to cope with climate change impacts due to its
consumption and industrial use (eThekwini Municipality,
socio-economic status, political constraints, and limited
2013c). At a high governmental level the KwaZulu-Natal
access to technology (IPCC, 2014c). eThekwini has already
(KZN) reconciliation Strategy by the National Department
experienced climate change effects, with a documented
of Water and Sanitation is considering potential climate
annual sea level rise of 2.7 mm (EPCPD, 2014a). It is
change impacts on water resources (AECOM, 2014).
anticipated that the following challenges will arise as a
Increased rainfall may cause flooding damage to buildings
result of climate change:
and infrastructure below the 100 year flood line. Also,
increased rainfall has the potential to overload waste-water
• Increase in annual mean temperature Projections
treatment plants and impact water quality by causing
show a 1.5 to 2.5° C increase in mean annual
untreated sewage to overflow in waterways, potentially
temperature by 2065 and a 3 to 5° C increase in
increasing the risk of water-borne infectious diseases
mean annual temperature by 2100, along with an
(Golder Associates Africa, 2011).
increasing number of heat waves (EPCPD, 2014a). As
Durban becomes warmer and wetter, the population Recent work by Rouault (2009) predicts storm events and
may experience higher incidences of heat-related, wave heights, further exacerbating the effects of local sea
vector-borne diseases, such as malaria, and water- level rise. The effect will be an increase in the frequency
borne diseases, including cholera. Residents living in and magnitude of storms (Corbella and Stretch, 2012),
damp conditions may develop respiratory illnesses. which is likely to erode the shoreline, particularly in
As a result of increased temperatures, food will spoil low-lying areas and areas weakened by previous erosion
quicker, and the risk of food-borne diseases will (Theron, 2007).
increase (Golder Associates, 2011). The poor, the
elderly, and the sick will be most vulnerable, which The urban heat island effect describes the condition where
may place a strain on available medical resources the mean air temperature of built-up areas is hotter than
(Ebi, et al., 2006). An increase in temperature nearby rural areas leading to increased peak energy and
may lead to increased evaporation rates, thereby water demand, increases in greenhouse gas emissions and
influencing water availability (AECOM, 2014). reduced water quality (U.S. EPA, 2015). The urban heat
• Rise in sea level As a coastal municipality with island effect was identified within Durban as early as 1968
98 km of highly developed coastline, eThekwini (Whyte, 1970) and island effect is anticipated to intensify
is particularly vulnerable to sea level rise. Future within Durban (eThekwini Municipality, n.d.a). The EMA’s
sea level rise is expected to rise at a rate of 2.5 cm Municipal Climate Protection Programme has already
per decade (EPCPD, 2010a). The areas particularly initiated programs to mitigate urban heat island impacts
vulnerable to sea-level rise are coastal wetland such as the green roof program which rely on vegetated
and dune ecosystems. Shoreline Management surfaces to reduce urban temperatures (eThekwini
Plans are being prepared to determine what Municipality, n.d.a).
adaptation interventions, if any, are required or
will be required into the future (EPCPD, 2014a).
eThekwini, South Africa Page 11You can also read